HAL Id: pastel-01003736
https://pastel.archives-ouvertes.fr/pastel-01003736
Submitted on 10 Jun 2014HAL is a multi-disciplinary open access archive for the deposit and dissemination of sci-entific research documents, whether they are pub-lished or not. The documents may come from teaching and research institutions in France or abroad, or from public or private research centers.
L’archive ouverte pluridisciplinaire HAL, est destinée au dépôt et à la diffusion de documents scientifiques de niveau recherche, publiés ou non, émanant des établissements d’enseignement et de recherche français ou étrangers, des laboratoires publics ou privés.
chromatographie en phase gazeuse miniature Une
nouvelle technique de dépôt collectif de la phase
stationnaire pour la fabrication de micro colonnes sur
puce: faisabilité, caractérisations, et applications
pétrolières
Raphaël Haudebourg
To cite this version:
Raphaël Haudebourg. Application de la pulvérisation cathodique à la chromatographie en phase gazeuse miniature Une nouvelle technique de dépôt collectif de la phase stationnaire pour la fabrication de micro colonnes sur puce: faisabilité, caractérisations, et applications pétrolières. Chimie analytique. Université Pierre et Marie Curie - Paris VI, 2014. Français. �NNT : 2400900�. �pastel-01003736�
THÈSE
PRÉSENTÉE A
L’UNIVERSITÉ PIERRE ET MARIE CURIE
ÉCOLE DOCTORALE DE CHIMIE PHYSIQUE
ET DE CHIMIE ANALYTIQUE DE PARIS CENTRE
Par Raphaël HAUDEBOURG
POUR OBTENIR LE GRADE DE
DOCTEUR
Application of sputtering
to micro gas chromatography
a novel collective stationary phase deposition technique
for micro gas chromatography columns fabrication:
feasibility, evaluations and oilfield applications
Application de la pulvérisation cathodique
à la chromatographie en phase gazeuse miniature
une nouvelle technique de dépôt collectif de la phase stationnaire pour la fabrication de micro colonnes sur puce: faisabilité, caractérisations, et applications pétrolières
Directeur de thèse : Jérôme VIAL
Soutenue le : 05/02/2014, devant la commission d’examen formée de :
M. Carlo BICCHI Professeur à l’Université de Turin Rapporteur
M. Jérôme RANDON Professeur à l’Université Claude Bernard de Lyon Rapporteur M. Jacques FATTACCIOLI Maître de Conférences à l’Université Pierre et Marie Curie de Paris Examinateur M. Franck LAUNAY Professeur à l’Université Pierre et Marie Curie de Paris Examinateur
M. Michel SABLIER Directeur de Recherches au CRCC de Paris Examinateur
M. Jérôme BREVIERE Directeur de Département à GeoServices, Schlumberger Examinateur
M. Jérôme VIAL Maître de Conférences à l’ESPCI ParisTech Directeur de thèse
M. Didier THIEBAUT Chargé de Recherche CNRS à l’ESPCI ParisTech Co-directeur de thèse Laboratoire des Sciences Analytiques,
Application of sputtering to gas chromatography
A novel collective stationary phase deposition technique for micro gas chromatography columns fabrication:
feasibility, evaluations and oilfield applications.
A thesis submitted in fulfillment of the requirements for the degree of
Doctor of Philosophy in Analytical Chemistry
At the
Doctoral School of Physical Chemistry and Analytical Chemistry of Paris (ED388, Pierre & Marie Curie University), FRANCE
In partnership with the
Laboratory of Analytical and Bioanalytical Sciences and Miniaturization ESPCI ParisTech, FRANCE
And
Schlumberger MEMS Technology Center Elancourt, FRANCE
By
Raphael HAUDEBOURG
To
Mr. Carlo BICCHI Professor at the University of Turin Reporter
Mr. Jerome RANDON Professor at the University Claude Bernard of Lyon Reporter
Mr. Jacques FATTACCIOLI Associate professor at the University Pierre et Marie Curie of Paris Examiner
Mr. Franck LAUNAY Professor at the University Pierre et Marie Curie of Paris Examiner
Mr. Michel SABLIER Research manager at the CRCC of Paris Examiner
Mr. Jerome BREVIERE Department manager at GeoServices, Schlumberger Examiner
Mr. Jerome VIAL Associate professor at the ESPCI ParisTech Thesis supervisor
Mr. Didier THIEBAUT CNRS Research fellow at the ESPCI ParisTech Thesis co-supervisor
Defended
Statement of original authorship
The work contained in this thesis has not been previously submitted to meet requirements for an award at this or any other higher education institution. To the best of the author’s knowledge and belief, this thesis does not contain previously published or written by another person material except where due reference is made.
Date:
Table of contents
Statement of original authorship ... 3
Table of contents ... 4
List of tables and figures ...11
Foreword ...14
I. Introduction ...15
I.A. Fundamental notions of gas chromatography ...15
I.A.1. Gas chromatography general principle ...15
I.A.2. Separation mechanism in a gas chromatography column ...16
I.A.3. Different types of gas chromatography columns ...16
I.A.4. Injectors and detectors ...17
I.A.5. Thermodynamic evaluation of a gas chromatography column ...18
I.A.6. Kinetic evaluation of a gas chromatography column ...19
I.A.7. Other significant values ...21
I.A.8. Gas chromatography common applications ...22
I.B. Use of gas chromatography in oilfield services ...22
I.B.1. Targeted compounds ...22
I.B.2. Schlumberger confidential paragraph ...22
I.B.3. Schlumberger confidential paragraph ...25
I.C. MEMS technology developments and miniaturization ...25
I.C.1. General background ...25
I.C.2. Usual processes ...26
I.C.2.01 Deposition ... 26
I.C.2.02 Patterning ... 26
I.C.2.03 Etching ... 27
I.C.2.04 Dicing ... 27
I.C.2. Applications of MEMS technology ...28
I.C.3. Perspectives of silicon-based gas chromatography ...28
I.D. Problem statement ...31
I.E. Sputtering as a potential solution; justification of the research ...32
I.F. Approach and methodology ...34
I.G. Delimitations of scope ...36
II. Literature review ...38
II.A. Gas chromatography ...38
II.A.1. Reference books ...38
II.A.2. Common stationary phases ...38
II.A.2.01 Gels and liquids for WCOT columns ... 38
II.A.2.02 Solid adsorbents for packed columns... 39
II.A.2.03 Solid adsorbents for PLOT columns ... 41
II.A.2.04 Conclusion ... 42
II.B. Micro gas chromatography ...44
II.B.1. How it all began...44
II.B.2. Columns etching processes and designs ...45
II.B.2.01 Isotropic etching (semi-circular or circular channels)... 45
II.B.2.02 Anisotropic etching (square channels) ... 47
II.B.2.03 Micro structure etching in channels ... 49
II.B.2.04 Influence of tubing shape ... 50
II.B.2.05 Conclusion ... 50
II.B.3. Heating methods ...50
II.B.4. Up- and downstream components and integration ...51
II.B.4.01 Injectors ... 52
II.B.4.02 Detectors ... 53
II.B.4.03 Pre concentrators and calibration vapor source ... 54
II.B.5. Computer science contribution ...55
II.B.6. Stationary phases ...55
II.B.6.01 Coating gel stationary phases ... 56
II.B.6.02 Packing solid stationary phases ... 57
II.B.6.03 Porous layer stationary phases ... 57
II.B.6.04 Conclusion ... 58
II.B.7. Applications ...58
II.B.8. Summary of reported kinetic performances of micro columns ...59
II.C. Sputtering ...60
II.C.1. Sputtering parameters...60
II.C.1.01 Sputtering mode and power ... 60
II.C.1.02 Gases and pressure ... 60
II.C.1.03 Deposition time ... 60
II.C.2. Sputter-deposited layers micro structure ...61
II.C.2.02 Influence of deposition parameters ... 62
II.C.2.03 Influence of substrate structure ... 62
II.C.3 Chosen target materials ...64
II.C.3.01 Silica ... 65 II.C.3.02 Alumina ... 65 II.C.3.03 Graphite ... 65 II.C.3.04 Magnesia ... 65 II.C.3.05 Titania ... 65 II.C.4. Conclusion ...66
II.D. Adsorption properties of silica, alumina and graphite ...66
II.D.1. Short summary of reported adsorption heats ...67
II.D.2. Adsorption isotherms and prediction of peak shapes ...67
II.D.3. Effects of hydration and overloading ...69
II.D.4. Conclusions ...69
II.E. Schlumberger confidential section ...69
Conclusion ...70
Bibliography ...72
III. Materials and methods ...77
III.A. Micro columns fabrication ...77
III.A.1. Computer designing ...77
III.A.1.01 Columns ... 77
III.A.1.02 Inlet and outlet holes ... 78
III.A.1.03 Platinum filaments ... 78
III.A.2. Clean room fabrication process ...81
III.A.2.01 Clean room process flow at the ESIEE ... 81
III.A.2.02 Sputtering at MEMS TC ... 83
III.A.3. SEM observations of deposited layers ...84
III.A.3.01 Silica ... 84 III.A.3.02 Alumina ... 86 III.A.3.03 Graphite ... 86 III.A.3.04 Magnesia ... 87 III.A.3.05 Titania ... 87 III.A.3.06 Conclusions ... 87
III.A.4. Bench completion ...88
III.A.4.01 Capillary gluing ... 88
III.A.5. Troubleshooting inventory ...90
III.A.5.01 Stationary phase sputtering deposition ... 90
III.A.5.02 Chip fabrication ... 91
III.A.5.03 Conclusion ... 93
III.B. Temperature programming engineering ...93
III.B.1. Temperature sensing ...94
III.B.2. Resistive heating through Pulse Width Modulation ...95
III.B.3. Thermoelectric cooling ...95
III.B.4. Electronics ...96
III.B.5. Calibration ...96
III.B.6. Software ...98
III.B.7 Conclusion ...99
III.C. Gas chromatography ...99
III.C.1. Equipment ...99
III.C.1.01 Equipment at MEMS TC ... 99
III.C.1.02 Equipment at the ESPCI ... 100
III.C.2. Samples ... 101
III.C.3. Column evaluation ... 101
III.C.3.01 Preliminary observations ... 101
III.C.3.02 Precision tests ... 101
III.C.3.03 Thermodynamic evaluation ... 103
III.C.3.04 Kinetic evaluation ... 104
III.C.3.05 Potential applications evaluation ... 104
III.D. Schlumberger confidential section ... 105
III.D.1. Schlumberger confidential paragraph ... 105
III.D.2. Schlumberger confidential paragraph ... 105
Conclusion ... 105
IV. Results and discussions ... 108
IV.A. Temperature programming ... 108
IV.A.1. Heating ... 108
IV.A.2. Cooling ... 110
IV.A.3. Conclusion ... 110
IV.B. Columns evaluations ... 111
IV.B.1. Preliminary observations ... 111
IV.B.1.02 Alumina ... 112
IV.B.1.03 Graphite ... 112
IV.B.1.04 Magnesia ... 112
IV.B.1.05 Conclusion ... 113
IV.B.2. Precision tests ... 114
IV.B.2.01 Injection repeatability ... 114
IV.B.2.02 Column evaluation precision ... 114
IV.B.2.03 Column fabrication intermediate precisions ... 116
IV.B.2.04 Temperature-programmed use intermediate precision ... 119
IV.B.2.05 Conclusions ... 119
IV.B.3. Thermodynamic evaluation ... 120
IV.B.3.01 Influence of alkane carbon number ... 120
IV.B.3.02 Influence of pressure ... 121
IV.B.3.03 Influence of temperature; Van’t Hoff plot ... 121
IV.B.3.04 Influence of column section ... 123
IV.B.3.05 Influence of stationary phase film thickness ... 124
IV.B.3.06 Van’t Hoff plots for sputter-deposited silica columns ... 125
IV.B.3.07 Other stationary phases ... 127
IV.B.3.08 Conclusions ... 129
IV.B.4. Kinetic evaluation ... 130
IV.B.4.01 Influence of carbon number ... 130
IV.B.4.02 Influence of temperature ... 130
IV.B.4.03 Demonstration of the influence of carrier gas velocity... 131
IV.B.4.04 Influence of column section ... 132
IV.B.4.05 Influence of column length ... 132
IV.B.4.06 Influence of column structure ... 134
IV.B.4.07 Influence of stationary phase film thickness ... 134
IV.B.4.08 Influence of stationary phase deposition pressure ... 135
IV.B.4.09 Stationary phase comparison ... 136
IV.B.4.10 Conclusions ... 138
IV.B.5. Potential application evaluation ... 138
IV.B.5.01 C1-C4 (or C5) temperature-programmed separations ... 138
IV.B.5.02 Other hydrocarbons separations on sputter-deposited silica ... 140
IV.B.5.03 Use of nitrogen as carrier gas ... 142
IV.B.5.04 High temperature C1-C2 separations ... 143
IV.B.5.05 Effect of silica layer hydration ... 143
IV.B.5.06 Conclusions ... 144
IV.C. Schlumberger confidential section ... 146
IV.C.1. Schlumberger confidential paragraph ... 146
IV.C.2. Schlumberger confidential paragraph ... 146
Conclusion ... 148
V. Conclusions and perspectives ... 149
V.A. Improvements ... 149
V.A.1. In micro gas chromatography ... 149
V.A.2. In oilfield applications ... 149
V.B. Limitations ... 149
V.B.1. In column evaluation ... 150
V.B.2. In industrial developments ... 150
V.C. Perspectives ... 150
V.C.1. Column fabrication ... 150
V.C.2. Column handling and evaluation ... 151
V.C.3. High throughput XXXXXXXXXXX analyses ... 151
V.C.4. Low-cost pocket gas chromatography ... 151
Appendices ... 153
Appendix A: micro thermal conductivity detector evaluation ... 153
Apdx A.1. Detection limit ... 153
Apdx A.1.01 Physical evaluation ... 153
Apdx A.1.02 Chromatographic evaluation ... 157
Apdx A.2. Sensitivity to flow rate ... 159
Apdx A.3. Detector linearity ... 159
Apdx A.4. Conclusion ... 160
Apdx A.5. References ... 160
Appendix B: limitations of other solid stationary phases ... 161
Apdx B.1. Stationary phase insertion processes ... 161
Apdx B.2. Chromatographic evaluation ... 162
Apdx B.3. Conclusion ... 163
Appendix C: details on self-made temperature-programming system development ... 165
Apdx C.1. Electronic components references ... 165
Apdx C.2. Influence of input voltage ... 165
Apdx C.3. Cooling system optimization ... 167
Abbreviations & symbols... 169
Semi-indexed glossary ... 170
List of publications and communications ... 171
A. Publications ... 171
A.1. As first author ... 171
A.2. As co-author ... 171
B. Communications ... 171
B.1. Oral communication ... 171
B.2. Poster communications ... 171
Résumé et mots-clés ... 172
A. Contexte du travail de recherche ... 172
B. Principaux résultats ... 174
B.1. Observations préliminaires ... 174
B.2. Caractérisation fondamentale ... 174
B.3. Caractérisation appliquée ... 175
B.4. Paragraphe restreint à Schlumberger... 177
C. Conclusions et perspectives ... 178
Acknowledgements ... 179
List of tables and figures
Figure/Table Name Page
Figure 1: GC general principle 15
Figure 2: separation mechanism in a column 16
Figure 3: the three main types of conventional GC columns 17
Figure 4: typical chromatogram and relevant values 18
Figure 5: illustration of the notion of efficiency 21
Table 1: examples of chemical constituents in oilfield environment 23
Figure 6: Schlumberger confidential figure – address requests to raphael.haudebourg@gmail.com 24 Figure 7: Schlumberger confidential figure – address requests to raphael.haudebourg@gmail.com 24 Figure 8: Schlumberger confidential figure – address requests to raphael.haudebourg@gmail.com 24
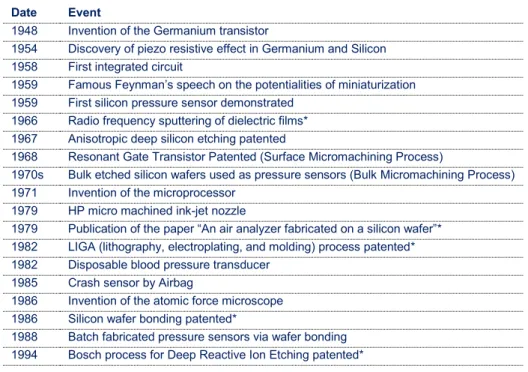
Table 2: early major MEMS milestones 26
Figure 9: substrate micro machining processes 27
Figure 10: examples of MEMS devices developed at MEMS TC 28
Figure 11: typical gas chromatograph and gas chromatography column 29
Figure 12: examples of recently commercialized portable gas chromatographs 30
Figure 13: micro injector, column and detector developed at MEMS TC 30
Figure 14: schematic process of micro gas chromatography columns fabrication 31
Figure 15: scheme of the sputtering process 33
Figure 16: pictures of MEMS TC clean room sputtering machine 33
Table 3: people and institutions directly implied in the project 35
Figure 17: squalane and PDMS structure 38
Figure 18: ultra-high speed C1-C4 separation on a silica-packed column 39
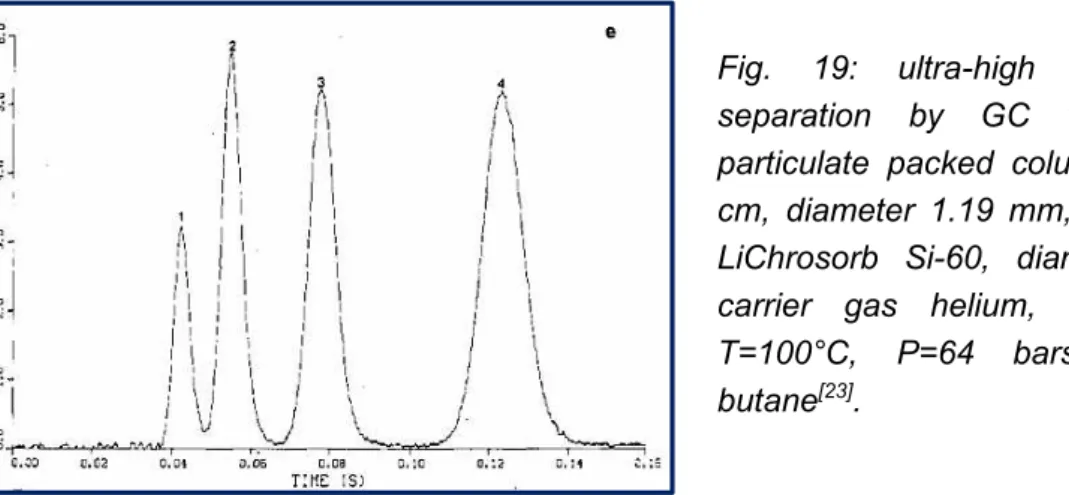
Figure 19: use of packed columns for the separation of light hydrocarbons 41
Figure 20: range of applicability of PLOT columns 41
Figure 21: use of PLOT columns for the separation of light hydrocarbons 43
Figure 22: from conventional micro machining processes to PLOT columns 44
Figure 23: the first silicon-based gas chromatographic system 45
Figure 24: another example of development of semi-circular channels 45
Figure 25: process and SEM of circular micro channels obtained by BCT 46
Figure 26: circular micro channels obtained by wafer-wafer bonding 47
Figure 27: process and SEM of square anisotropically-etched micro channels 48
Figure 28: micro posts etching in micro channels; semi-packed design 49
Figure 29: influence of tubing shape on kinetic performances of a micro column 50
Figure 30: heating and temperature-programming problematics in µGC 52
Figure 31: MEMS integrated gas chromatograph by Lu (2005) 53
Figure 32: examples of up- and downstream MEMS components 54
Figure 33: two examples of integrated micro gas chromatographs 55
Figure 34: examples of computer science contribution to µGC 56
Figure 35: micro columns gel-coating, packing and porous layer-coating 57
Figure 36: micro column with monolithic porous silica 58
Table 4: comparative summary of micro columns kinetic performances 59
Figure 37: sputter-deposited films structure 61
Figure 38: influence of sputtering deposition parameters on layers structure 63
Figure 39: influence of substrate on sputter-deposited layers structure 64
Figure 40: sputter-deposited materials of first interest in chromatography 66 Figure 41: adsorption heat as a function of carbon number for various adsorbents 67 Table 5: adsorption heats of light alkanes on silica, alumina, and graphite 68
Figure 42: adsorption isotherms and peak shapes 68
Figure 43: Schlumberger confidential figure – address requests to raphael.haudebourg@gmail.com 70 Figure 44: multidimensional µGC as an analysis quality and speed enhancer 71
Figure 45: the different columns designs used in the study 79
Figure 46: examples of SEM images of the different designs 79
Figure 47: the three masks used in the fabrication process 80
Table 6: calculation of chip thermal capacity 80
Table 7: targeted platinum filaments characteristics 80
Table 9: columns fabrication process flow 81
Figure 49: virtual visit of ESIEE clean room equipment 82
Table 8: summary sputtering parameters for deposition 83
Figure 50: SEM images of sputter-deposited silica layers 85
Figure 51: SEM image of sputter-deposited alumina layer 86
Figure 52: SEM images of sputter-deposited graphite layers 86
Figure 53: SEM image of sputter-deposited magnesia layer 87
Figure 54: SEM image of sputter-deposited titania layer 87
Figure 55: capillary gluing process (fluidic connections) 89
Figure 56: electrical connections 90
Figure 57: failures and problems encountered in columns fabrication 92
Figure 58: resistance-temperature plots of sensing filaments 94
Figure 59: PWM technique principle 95
Figure 60: pictures of the 3 hardware components for temperature programming 97
Figure 61: temperature programming system hardware map 97
Figure 62: typical chip calibration curve 98
Figure 63: screenshot of Labview software for temperature programming 98
Figure 64: pictures of the different GC setups used in this study 100
Table 10: mixtures used in this study, quantitative compositions and purposes 102 Figure 65: illustration of method precision evaluation for column fabrication 103 Figure 66: Schlumberger confidential figure – address requests to raphael.haudebourg@gmail.com 106
Table 11: summary of fabricated wafers 107
Figure 67: linear-like temperature ramp obtained by PWM 109
Figure 68: temperature ramps of 12°C/s, 16°C/s and 20°C/s 109
Figure 69: frozen images from infrared video recordings of PWM heating 109
Figure 70: cooling system most relevant results 109
Figure 71: typical separations on sputter-deposited silica columns 111
Figure 72: typical separations on sputter-deposited alumina columns 112
Figure 73: typical separations on sputter-deposited graphite columns 113
Figure 74: typical separation on sputter-deposited magnesia columns 113
Figure 75: estimation of injection repeatability 114
Table 12: standard deviations for three consecutive injections 115
Figure 76: precision over time and connections of column evaluation 115
Figure 77: precision over GC apparatus and user of column evaluation 116
Figure 78: column to column precision (wafer 1) 117
Figure 79: column to column precision (wafer 3) 118
Figure 80: evaluation of fabrication method precision: wafer to wafer variability 118
Figure 81: temperature-programmed use precision 119
Figure 82: retention factors as a function of carbon number 120
Figure 83: retention factors as a function of carrier gas velocity 121
Figure 84: thermodynamic evaluation of a silica regular column 122
Figure 85: influence of column section on retention 123
Figure 86: retention factors as a function of deposition time 124
Figure 87: a thermodynamic study on sputter-deposited silica micro columns 126
Figure 88: thermodynamic data gathering 126
Table 13: retentions on the two different semi-packed column designs 127
Figure 89: thermodynamic study of other sputter-deposited stationary phases 128
Table 14: retentions on open columns with graphite as stationary phase 129
Figure 90: C2-C3 selectivity for all columns evaluated in the study 129
Figure 91: influence of carbon number on separation efficiency 130
Figure 92: influence of temperature on efficiency 131
Figure 93: illustration of the influence of carrier gas velocity on efficiency 132
Figure 94: influence of column section on efficiency 133
Figure 95: influence of column length on efficiency 133
Figure 96: influence of column structure on efficiency 134
Figure 98: influence of silica deposition pressure on efficiency 136
Figure 99: influence of sputter-deposited material on efficiency 136
Figure 100: graphite as stationary phase, kinetic comparison 137
Table 15: summary of kinetic evaluations of graphite columns 137
Figure 101: magnesia as stationary phase, kinetic comparison 137
Figure 102: C1-C4/C5 temperature-programmed separations on silica 139
Figure 103: C1-C4 temperature-programmed separations on graphite 140
Figure 104: C1-C4 temperature-programmed separation on alumina 140
Figure 105: various temperature-programmed separations on silica 141
Figure 106: comparison between helium and nitrogen as carrier gas 142
Figure 107: high temperature C1-C2 separations 143
Figure 108: effect of water percolation on thermodynamic and kinetic properties 144
Table 16: summary of thermodynamic and kinetic evaluations 146
Figure 109: Schlumberger confidential figure – address requests to raphael.haudebourg@gmail.com 147
Figure 110: TCD platinum filaments description and characterization 156
Figure 111: baseline monitoring of TCD signal 157
Figure 112: TCD detection limit chromatographic evaluation 158
Figure 113: sensitivity of platinum filament resistance to carrier gas flow rate 159
Figure 114: µTCD-FID series setup main result 160
Figure 115: integrated “USB-GC” 160
Figure 116: developments of other stationary phases developed at MEMS TC, pictures 162 Table 17: developments of other stationary phases developed at MEMS TC, results 163 Figure 117: developments of other stationary phases developed at MEMS TC, separations 164 Figure 118: illustration of the influence of input voltage choice for chip heating 166 Table 18: summary of the different Peltier-based cooling systems evaluated 167
Figure 119: Labview software block diagram 168
Figure 120: principe du procédé de pulvérisation cathodique 173
Figure 121: exemples d’images MEB des micro colonnes 174
Figure 122: séparations des alcanes légers sur une micro colonne capillaire 175
Tableau 19: récapitulation simplifiée des colonnes fabriquées 176
Tableau 20: résumé des résultats thermodynamiques et cinétiques obtenus 176
Figure 123: séparations C1-C2 à haute température 177
Foreword
The research work presented in this report is the fruit of a “CIFRE” collaboration (French industrial convention of education through research). From March 2010 to January 2014, it implied Schlumberger, the leading oilfield services company, as the industrial collaborator, the ESPCI ParisTech, the top-ten transdisciplinary graduate engineering school, as the academic collaborator, and the Doctoral School of Pierre & Marie Curie University in Physical Chemistry and Analytical Chemistry, as the educational and administrative host. It was conducted at Schlumberger MEMS TC (Micro Electro-Mechanical Systems Technical Center), at GeoServices (a Schlumberger subsidiary), at the ESPCI LSABM (Laboratory of Analytical and Bioanalytical Sciences and Miniaturization), and at the ESIEE Paris (Graduate Engineering School in Electrotechnics and Electronics). It is transdisciplinary, standing at the crossroads of analytical chemistry (fundamental and applied), micro engineering (including micro fabrication, packaging, thermal management), automation (including hard- and software developments), and petro chemistry.
The purpose of this foreword is to justify the author’s will to intend this report to the industrial community as well as to the academic one, to the international scientific community as well as to the French one, and to micro fabrication or petroleum engineers as well as to analytical chemistry researchers. Therefore, the author made the two following choices (in agreement with the Doctoral School): first, this report is written in English (instead of French, which is usually recommended for thesis manuscripts; a 7-pages summary of the thesis in French is proposed page 172); then, the introduction of the thesis will begin with a short and basic description of elementary gas chromatography notions (I.A.), for non-specialists; finally, this report, meant to be read, purports to be as synthetic as possible. The hurried expert reader is of course allowed to directly jump to sections I.B. and I.C., which are respectively dedicated to a basic description of the use of gas chromatography in oilfield services and to MEMS technology, or even to next chapters. A few additional notions, too marginal to be defined in the body of the report for readability reasons but occasionally useful, are followed by an asterisk and defined in a short glossary at the end of the report.
This version of the report is non-confidential, and, therefore, all sections related to the specific application developed in partnership with GeoServices do not appear. However, it is obviously possible for any interested reader to ask for confidential information and/or the full version of the report, at the author address: raphael.haudebourg@gmail.com.
I. Introduction
As mentioned in the foreword, the first section of this introduction will firstly be intended to gas chromatography (GC) non-specialists, and has two main purposes, which are crucial for the understanding of the method: the description of the different types of GC columns and detectors, and the definitions of the thermodynamic and kinetic evaluations of a GC column. Then, emphasis will be put on the use of GC in oilfield services and on miniaturized systems and their contribution to this technique. In the five last sections of this introduction chapter, problem will be stated, research justified, approach and methodology described, scope delimited, and finally report structure outlined.
I.A. Fundamental notions of gas chromatography
I.A.1. Gas chromatography general principle
Chromatography is a chemical analysis technique aiming at the separation, identification, and quantification of the different species in a mixture. Gas chromatography refers to the use of this technique for the analysis of gaseous mixtures (gaseous under standard conditions or after easy vaporization). On figure 1 is displayed the general functioning principle of a Gas Chromatograph (GC), the apparatus enabling the process.
The apparatus consists of three main components:
an injector, which allows the injection of the sample to analyze into the column,
a column, similar to a tube, which allows the separation of the different species in the sample,
a detector, which allows the measurement of a physical value at the end of the column.
A continuous stream of a carrier gas (usually helium, but also nitrogen or hydrogen) passes through the column towards the detector. The sample to analyze is injected upstream of the column and percolates through the column. The recording over time of the electronic signal returned by the detector placed downstream of the column is called the chromatogram, which consists in a succession of peaks corresponding to the different species eluting out of the column at different times (retention times, tR).
I.A.2. Separation mechanism in a gas chromatography column
The column consists of a tubing, whose length is generally comprised between 5 cm and 50 m, depending on the type of column (see I.A.3.), and whose inner diameter is generally comprised between 100 µm and 1 mm. The column is packed (or its inner walls are coated) by an adsorbing material, named the stationary phase (by opposition to the carrier gas also named mobile phase). The separation mechanism is displayed on figure 2.
In this cross-sectional view of the tubing, the inner walls of the column (in black) are coated with a thin film of stationary phase (green). A two components (red and blue) mixture (purple) is injected upstream of the column (left) and carried through it towards the detector (right) thanks to the carrier gas stream (big black arrows). During the percolation, the molecules of the sample diffuse laterally (small black arrows) and adsorb and desorb several times on the stationary phase. The strength of the adsorption is a thermodynamic value and is specific to a couple adsorbent-adsorbed molecule. Thus, molecules that weakly adsorb on the stationary phase (red) elute before molecules that strongly adsorb (blue). If all the parameters are relevantly chosen, the chromatogram results in two separated peaks, the first one corresponding to the less retained compound (red).
Fig. 2: separation mechanism in a column
I.A.3. Different types of gas chromatography columns
In a basic approach, there are 3 main types of conventional GC columns, according to the layout of the stationary phase inside the column (see figure 3).
Packed columns are filled with porous solid grains. They are often short and wide, to compensate the high pressure drop induced by the low permeability of the inner structure. Retention is ensured by small diffusion lengths. First GC columns were of this type.
Porous Layer Open Tubular (PLOT) columns are coated with a thin film of a porous solid monolithic structure. Retention is ensured by a longer length, made possible by the high permeability of the column.
Wall Coated Open Tubular (WCOT) columns are coated with a thin film of a gel material. Although their layout seems to be quite similar to PLOT columns at first sight, retention mechanisms are different (dissolution of the analyte in the liquid stationary phase, contrary to surface physi-sorption of the analyte on the surface of the porous solid stationary phase), and their length is often longer to enable separation. They represent the most used type of columns.
Fig. 3: the three main types of GC columns: packed column, Porous Layer Open Tubular column (PLOT) and Wall Coated Open Tubular column (WCOT)
Packed column PLOT column WCOT column
I.A.4. Injectors and detectors
The injection of the sample into the flow line of the apparatus can be executed manually by the user with a syringe, or automatically by a robot. It is also possible to use a switch injection system, the first step being the loading of the sample into a sampling loop, the second step being the unloading of the sample from the loop to the main flow line. Loop injectors are widely used for automated tasks. Moreover, they enable multidimensional chromatography (several columns in parallel in the same system).
The continuous measurement of a physical value at the end of the column is performed by a detector. The main types of detectors are:
Flame Ionization Detector (FID), whose response is proportional to the instantaneous quantity of C-H bonds in the detector chamber; it is a robust detector with relatively low detection and quantification limits; however, it is not universal (only C-H bonds-containing molecules can be detected) and it requires hydrogen supply;
Thermal Conductivity Detector (TCD), which signal is proportional to the difference of thermal conductivity in the main flow line and in a carrier gas reference flow line; it generally shows poorer performances than FID, but it is universal and requires no other gases than the carrier gas;
many other types of detector exist (e.g. optical, specific to one atom, mass detection), but are of lower interest here.
Generally, the area of the chromatographic peak displayed by the detection system is linked to the injected quantity of the corresponding analyte (proportional in the linear domain of the detector). A typical chromatogram and the relevant values for evaluation are displayed on figure 4.
Fig. 4: typical chromatogram and relevant values
I.A.5. Thermodynamic evaluation of a gas chromatography column
The thermodynamic behavior of a column (towards one compound) is characterized by the retention factor k:
� =
where K is the distribution coefficient of the compound between the stationary phase and the mobile phase; if ∆rH°, ∆rG° and ∆rS° are respectively the standard enthalpy, Gibbs
free energy, and entropy associated to the adsorption equilibrium, T the temperature in Kelvin, R the ideal gas constant (8.314 J.K-1.mol-1), K is ruled by the following equation:
∆rG° = ∆rH° - T∆rS° = -RT ln K or K = K° exp(-∆rH°/RT) with K° = exp(∆rS°/R)
and where β is the phase ratio of the column, which is the ratio between the geometric volume of mobile phase, or void, inside the column, and the volume of stationary phase inside the column; e.g., for a round-section open tubular column with an inner diameter dc, and coated with a ef-thick thin film of stationary phase, β=dc/4ef.
k is experimentally measured thanks to the following relation: � = �−
where tR is the retention time of the compound and t0 the zero retention time, dead time or
The main use of k is to give a universal and dimensionless value of the retention of one compound in one column, for comparison purposes. Moreover, adsorption heat |∆rH°| is
easily exhibited by the plot of the logarithm of k against 1/RT at different temperatures (Van’t Hoff plot). Finally, the plot of ln k against column’s and stationary phase’s dimensions, and the possible deviation to ideality, gives precious information about the influence of such parameters on the thermodynamic behavior of the column.
As a consequence of the thermodynamic behavior of a GC column, a higher column temperature will result in a weaker retention. To decrease the retention times of the most retained compounds in the mixture, without decreasing the retention of the less retained (which would generally result in a poorer resolution), chromatographists apply linear temperature ramps to the column. By choosing the appropriate temperature programming parameters (start temperature, slope in °C/min, and stop time), it is possible to shorten analysis time without losing separation quality, compared to isothermal conditions. An obvious demonstration of this will be shown in IV.B.3, but the key point here is to keep in mind that column thermal management is a crucial issue in gas chromatography.
The last thermodynamic quantity to be introduced here is the selectivity kA/kB of a stationary
phase between two compounds A and B. This value is generally useful for the comparison between the thermodynamic behaviors of two different stationary phases from different columns which could not have the same phase ratio β for practical reasons. By using two retained compounds, the value of β can be passed-by, which is of the most helpful utility when this value cannot be accurately known (for instance in the case of solid stationary phases with unknown porosities). Investigated differences can obviously concern stationary phase type or material, but also structure, porosity, or hydration, in the case of solid stationary phases.
I.A.6. Kinetic evaluation of a gas chromatography column
The plate theory predicts Gaussian shapes for chromatographic peaks in ideal conditions. The broadening of the peaks (considered as a Dirac delta function at the injection) is ruled by three phenomena:
a multiple path effect, occurring almost only in packed columns, and independent of the carrier gas velocity,
a longitudinal diffusion effect (along the column axis), proportional to the diffusion coefficient of the analyte in the mobile phase, and inversely proportional to the carrier gas velocity,
a resistance to mass transfer effect, both due to the high density of the stationary phase and of the inhomogeneous radial velocity profile of the mobile phase, and is proportional to it.
These three phenomena are respectively represented in the three terms of the Van Deemter equation:
= + +
where u is the carrier gas velocity, where A, B and C three constants related to the analyte, the stationary phase structure, and the mobile phase nature, and where H is the plate height. The name of plate height, or Height Equivalent to a Theoretical Plate (HETP), comes from an historical analogy of chromatographic separation with fractionation distillation (as well as the name of “column” for the separating element). This plate height is linked to the efficiency of the retention of one compound on one column under one set of experimental parameters by the simple following relation:
� =
where L is the length of the column; N, also named efficiency, is thus the number of plates in the column (again, for one compound and one column under one set of experimental parameters).
N is calculated from the data processing of the chromatogram by the following equation: � = . �
/ ²
where w1/2 is the half-height width of the peak (see figure 4). In other words, the retention of
one compound on one column is said to be efficient when the column is able to retain the most the compound with a low peak broadening, i.e. when the number of plates is high, i.e. when the plate height is small. Nowadays, numbers of plates often exceed 10000 plates per meter in open columns (a few 10 to a few 100 meters long). Efficiency is sometimes expressed in number of plates per second to take into account pressure drop effects and consequences on analyses time in the comparison of different columns (open or packed…)μ acknowledged limit value for open columns is around 1000 plates per second.
The plot of HETP against u (regulated through the pressure difference applied to the column, and calculated with u=L/t0) is called a Van Deemter plot, and has a typical shape as shown
on figure 5.
The relevance of the value of efficiency to assess the performance of a separation is demonstrated on figure 5a. At low velocities, peak summits are better separated than at high velocities, but peak broadening is more important, which results in a poor separation; on the contrary, at high velocities, peak broadening is low, but peak summits are closer to each other on the time axis, also resulting in a poor separation. Therefore, efficiency reaches a maximum (and plate height reaches a minimum, see figure 5b) at an optimal velocity. The values of the minimal plate height Hmin and of the optimal velocity uopt can be extracted from
Van Deemter equation as following:
Fig. 5a: schematic plot of efficiency (number of plates N) as a function of carrier gas velocity in the example
of the separation of two compounds
Fig. 5b: typical Van Deemter plot of plate height H against carrier gas
velocity u, showing the three terms of the Van Deemter equation Fig. 5: illustration of the notion of efficiency
I.A.7. Other significant values
Four last simple and intuitive values of the highest relevance for this report are introduced here:
separation time ttot, which is the overall time required to complete the separation, from the
injection to the return of the signal to the baseline after the peak of the most retained compound in the mixture to analyze;
resolution RAB of the separation between two compounds A and B, calculated as
following:
= . �, − �,
/ , + / ,
a resolution higher than 1.25 is generally mandatory for quantitative purposes, however, in particular cases (compounds in similar quantities, high signal to noise ratio) a value of 0.75 can be sufficient (see also separation number, in the glossary);
peak asymmetry As, quantifying the deviation to ideal Gaussian peaks (especially in the case of tailing peaks), calculated as following:
= / ,�
where w1/10,R is the right half-width of the peak at 10% of maximal height (distance from
the point at peak midpoint to the right tailing edge measured at 10%), and w1/10,L the left
half-width of the peak at 10% of maximal height (distance from the point at peak midpoint to the left edge measured at 10%); the further As from 1, the more asymmetric the peak.
I.A.8. Gas chromatography common applications
GC has been applied to applications in which the targeted compounds are easily vaporizable (gaseous and stable below 300°C). These applications include biology, chemistry, pharmacology, water pollution, biological and chemical warfare agent or drug detection, food- and beverage-processing, oil and petroleum etc.
Moreover, GC has been commonly used for the monitoring (autonomous and cycled detection and quantification) of pollutants in air, such as Volatile Organic Compounds*. And last, but not least, GC is also first choice technique for the monitoring of gases such as light hydrocarbons (C1-C9, and more commonly C1-C5, cyclic and aromatic compounds), or permanent gases (O2, N2, CO2, and the dangerous H2S), in oil- and gas field environments.
As a study led in partnership with Schlumberger, this report focuses on this last domain of application.
I.B. Use of gas chromatography in oilfield services
I.B.1. Targeted compounds
Oil analysis, from crude to refined, is crucial in petroleum industry. Table 1 gathers the main categories of chemical compounds commonly found in oilfield environment and refining industry. Excepted metal and salt traces, and hydrocarbons heavier than C16, the compounds are vaporizable below 300°C and are directly compatible with most GC available on the market. Hydrocarbons (paraffins, cycloalkanes, alkenes, aromatics and naphtalenes), but also functionalized compounds (sulfides, amines, alcohols, ketones, ethers and esters) can be detected and quantified with a FID. Analyses beyond C100 (with simulated distillation) are routinely performed.
Therefore, GC has been commonly used in petroleum industry. Contrary to liquid chromatography, where the sampling, the transportation of the sample from the sampling point to the lab, and the conservation of the sample before analysis, are generally uncomplicated steps, gas chromatography can also be used in direct on-field real-time monitoring. In the following paragraph, one of the best examples of the use of GC-based light hydrocarbons monitoring in oilfield industry is introduced.
I.B.2. Schlumberger confidential paragraph
This example of GC monitoring in oilfield industry was purposely chosen, as the first application of the discovery presented in this report (see III.D., and IV.C.).
Compound Category Occurrence Boiling point (°C) FID detection
O2 Oxygen Permanent gas Abundant -183 N
N2 Nitrogen Permanent gas Abundant -196 N
CO2 Carbon Dioxide Permanent gas Abundant -57 N
H2O Water Permanent gas Abundant 100 N
C1 Methane Paraffins Abundant -160 Y
C5 Pentane Paraffins Abundant 36 Y
C10 Decane Paraffins Abundant 174 Y
C20 Isosane Paraffins Abundant 343 Y
cC6 Cyclohexane Cycloalkanes Occasional 81 Y
Eth Ethene Alkenes Abundant -104 Y
Bnz Benzene Aromatics Abundant 80 Y
Nph Naphtalene Naphtalenes Abundant 218 Y
H2S Hydrogen Sulfide Sulfides Occasional -60 N
DMS Dimethyl Sulfide Sulfides Traces 41 Y
MA Methyl Amine Amines Traces -6 Y
PH Phenol Alcohols Traces 182 Y
Ni Nickel Metal Traces 2913 N
NaCl Sodium Chloride Salt Traces 1413 N
Table 1: examples of chemical constituents in oilfield environment (Y=yes, N=no)
Schlumberger confidential content – address requests to raphael.haudebourg@gmail.com Schlumberger confidential content – address requests to raphael.haudebourg@gmail.com Schlumberger confidential content – address requests to raphael.haudebourg@gmail.com Schlumberger confidential content – address requests to raphael.haudebourg@gmail.com Schlumberger confidential content – address requests to raphael.haudebourg@gmail.com Schlumberger confidential content – address requests to raphael.haudebourg@gmail.com Schlumberger confidential content – address requests to raphael.haudebourg@gmail.com Schlumberger confidential content – address requests to raphael.haudebourg@gmail.com Schlumberger confidential content – address requests to raphael.haudebourg@gmail.com Schlumberger confidential content – address requests to raphael.haudebourg@gmail.com Schlumberger confidential content – address requests to raphael.haudebourg@gmail.com Schlumberger confidential content – address requests to raphael.haudebourg@gmail.com Schlumberger confidential content – address requests to raphael.haudebourg@gmail.com Schlumberger confidential content – address requests to raphael.haudebourg@gmail.com Schlumberger confidential content – address requests to raphael.haudebourg@gmail.com Schlumberger confidential content – address requests to raphael.haudebourg@gmail.com Schlumberger confidential content – address requests to raphael.haudebourg@gmail.com Schlumberger confidential content – address requests to raphael.haudebourg@gmail.com Schlumberger confidential content – address requests to raphael.haudebourg@gmail.com Schlumberger confidential content – address requests to raphael.haudebourg@gmail.com Schlumberger confidential content – address requests to raphael.haudebourg@gmail.com Schlumberger confidential content – address requests to raphael.haudebourg@gmail.com Schlumberger confidential content – address requests to raphael.haudebourg@gmail.com Schlumberger confidential content – address requests to raphael.haudebourg@gmail.com Schlumberger confidential content – address requests to raphael.haudebourg@gmail.com Schlumberger confidential content – address requests to raphael.haudebourg@gmail.com Schlumberger confidential content – address requests to raphael.haudebourg@gmail.com Schlumberger confidential content – address requests to raphael.haudebourg@gmail.com Schlumberger confidential content – address requests to raphael.haudebourg@gmail.com Schlumberger confidential content – address requests to raphael.haudebourg@gmail.com Schlumberger confidential content – address requests to raphael.haudebourg@gmail.com Schlumberger confidential content – address requests to raphael.haudebourg@gmail.com
Schlumberger confidential content – address requests to raphael.haudebourg@gmail.com Schlumberger confidential content – address requests to raphael.haudebourg@gmail.com Schlumberger confidential content – address requests to raphael.haudebourg@gmail.com Schlumberger confidential content – address requests to raphael.haudebourg@gmail.com Schlumberger confidential content – address requests to raphael.haudebourg@gmail.com Schlumberger confidential content – address requests to raphael.haudebourg@gmail.com Schlumberger confidential content – address requests to raphael.haudebourg@gmail.com Schlumberger confidential content – address requests to raphael.haudebourg@gmail.com Schlumberger confidential content – address requests to raphael.haudebourg@gmail.com Schlumberger confidential content – address requests to raphael.haudebourg@gmail.com Schlumberger confidential content – address requests to raphael.haudebourg@gmail.com Schlumberger confidential content – address requests to raphael.haudebourg@gmail.com Schlumberger confidential content – address requests to raphael.haudebourg@gmail.com Schlumberger confidential content – address requests to raphael.haudebourg@gmail.com Schlumberger confidential content – address requests to raphael.haudebourg@gmail.com Schlumberger confidential content – address requests to raphael.haudebourg@gmail.com Schlumberger confidential content – address requests to raphael.haudebourg@gmail.com Schlumberger confidential content – address requests to raphael.haudebourg@gmail.com Schlumberger confidential content – address requests to raphael.haudebourg@gmail.com Schlumberger confidential content – address requests to raphael.haudebourg@gmail.com Schlumberger confidential content – address requests to raphael.haudebourg@gmail.com Schlumberger confidential content – address requests to raphael.haudebourg@gmail.com Schlumberger confidential content – address requests to raphael.haudebourg@gmail.com Schlumberger confidential content – address requests to raphael.haudebourg@gmail.com Schlumberger confidential content – address requests to raphael.haudebourg@gmail.com Schlumberger confidential content – address requests to raphael.haudebourg@gmail.com Schlumberger confidential content – address requests to raphael.haudebourg@gmail.com Schlumberger confidential content – address requests to raphael.haudebourg@gmail.com Schlumberger confidential content – address requests to raphael.haudebourg@gmail.com Schlumberger confidential content – address requests to raphael.haudebourg@gmail.com Schlumberger confidential content – address requests to raphael.haudebourg@gmail.com Schlumberger confidential content – address requests to raphael.haudebourg@gmail.com Schlumberger confidential content – address requests to raphael.haudebourg@gmail.com Schlumberger confidential content – address requests to raphael.haudebourg@gmail.com Schlumberger confidential content – address requests to raphael.haudebourg@gmail.com Schlumberger confidential content – address requests to raphael.haudebourg@gmail.com Schlumberger confidential content – address requests to raphael.haudebourg@gmail.com Schlumberger confidential content – address requests to raphael.haudebourg@gmail.com Schlumberger confidential content – address requests to raphael.haudebourg@gmail.com Schlumberger confidential content – address requests to raphael.haudebourg@gmail.com Schlumberger confidential content – address requests to raphael.haudebourg@gmail.com Schlumberger confidential content – address requests to raphael.haudebourg@gmail.com Schlumberger confidential content – address requests to raphael.haudebourg@gmail.com Schlumberger confidential content – address requests to raphael.haudebourg@gmail.com Schlumberger confidential content – address requests to raphael.haudebourg@gmail.com Schlumberger confidential content – address requests to raphael.haudebourg@gmail.com Schlumberger confidential content – address requests to raphael.haudebourg@gmail.com Schlumberger confidential content – address requests to raphael.haudebourg@gmail.com Schlumberger confidential content – address requests to raphael.haudebourg@gmail.com Schlumberger confidential content – address requests to raphael.haudebourg@gmail.com Schlumberger confidential content – address requests to raphael.haudebourg@gmail.com Schlumberger confidential content – address requests to raphael.haudebourg@gmail.com Schlumberger confidential content – address requests to raphael.haudebourg@gmail.com
I.B.3. Schlumberger confidential paragraph
Schlumberger confidential content – address requests to raphael.haudebourg@gmail.com Schlumberger confidential content – address requests to raphael.haudebourg@gmail.com Schlumberger confidential content – address requests to raphael.haudebourg@gmail.com Schlumberger confidential content – address requests to raphael.haudebourg@gmail.com Schlumberger confidential content – address requests to raphael.haudebourg@gmail.com Schlumberger confidential content – address requests to raphael.haudebourg@gmail.com Schlumberger confidential content – address requests to raphael.haudebourg@gmail.com Schlumberger confidential content – address requests to raphael.haudebourg@gmail.com Schlumberger confidential content – address requests to raphael.haudebourg@gmail.com Schlumberger confidential content – address requests to raphael.haudebourg@gmail.com Schlumberger confidential content – address requests to raphael.haudebourg@gmail.com Schlumberger confidential content – address requests to raphael.haudebourg@gmail.com Schlumberger confidential content – address requests to raphael.haudebourg@gmail.com Schlumberger confidential content – address requests to raphael.haudebourg@gmail.com Schlumberger confidential content – address requests to raphael.haudebourg@gmail.com Schlumberger confidential content – address requests to raphael.haudebourg@gmail.com Schlumberger confidential content – address requests to raphael.haudebourg@gmail.com
I.C. MEMS technology developments and miniaturization
I.C.1. General background
Micro electro-mechanical systems (MEMS) are made up of components between 1 to 100 micrometers in size; MEMS generally range in size from 20 micrometers to 20 millimeters. They usually consist of one or several components that interact with the surroundings such as a micro sensor, and sometimes of a central unit that processes data (microprocessor). Because of the large surface area to volume ratio of MEMS, surface effects such as electrostatics, adsorption and wetting dominate over volume effects such as inertia or thermal mass.
The potential of very small machines was appreciated before the technology existed that could make them. MEMS became practical once they could be fabricated using modified semiconductor device fabrication technologies, normally used to make electronics. The economies of scale, ready availability of cheap high-quality materials, ability to incorporate electronic functionality and advantaging crystallographic and mechanical properties have made silicon the most attractive material in MEMS fabrication. Table 2 sums up some of the earliest and most significant milestones in MEMS technology history.
The starting substrate of a process is generally a blank silicon wafer (see figure 9a). Processes are divided in four categories: deposition, patterning, etching and dicing. A substrate can undergo up to 100 processes during fabrication. The processes, very diversified in each category and quite complex, are briefly introduced in the following paragraph, in order to then understand the contribution of MEMS technology to microfluidics.
Date Event
1948 Invention of the Germanium transistor
1954 Discovery of piezo resistive effect in Germanium and Silicon 1958 First integrated circuit
1959 Famous Feynman’s speech on the potentialities of miniaturization 1959 First silicon pressure sensor demonstrated
1966 Radio frequency sputtering of dielectric films* 1967 Anisotropic deep silicon etching patented
1968 Resonant Gate Transistor Patented (Surface Micromachining Process)
1970s Bulk etched silicon wafers used as pressure sensors (Bulk Micromachining Process) 1971 Invention of the microprocessor
1979 HP micro machined ink-jet nozzle
1979 Publication of the paper “An air analyzer fabricated on a silicon wafer”* 1982 LIGA (lithography, electroplating, and molding) process patented* 1982 Disposable blood pressure transducer
1985 Crash sensor by Airbag
1986 Invention of the atomic force microscope 1986 Silicon wafer bonding patented*
1988 Batch fabricated pressure sensors via wafer bonding 1994 Bosch process for Deep Reactive Ion Etching patented*
Table 2: earliest and major MEMS milestones; * Inventions with direct implications in the present study
I.C.2. Usual processes
I.C.2.01 Deposition
One of the basic building blocks in MEMS processing is the ability to deposit thin films of material with an accurate thickness, generally between a few nanometers to about 100 micrometers. There are two types of deposition processes, as follows.
Physical vapor deposition ("PVD"), in which a material is removed from a target, and deposited on the surface of substrate, in a vacuum system. This includes sputtering, in which an ion beam liberates atoms from a target, and evaporation, in which a material is evaporated from a target using either heat (thermal evaporation) or an electron beam (e-beam evaporation).
Chemical vapor deposition ("CVD"), in which a stream of source gas reacts on the substrate in order to grow the desired material. This can be further divided into categories depending on the details of the technique, for example, LPCVD (Low Pressure chemical vapor deposition) and PECVD (Plasma Enhanced chemical vapor deposition).
Oxide films can also be grown by the technique of thermal oxidation, in which the silicon wafer is exposed to oxygen and/or steam, to form a thin surface layer of silicon dioxide. I.C.2.02 Patterning
Photolithography (figure 9b) uses light to transfer a geometric pattern from a mask to a light-sensitive chemical photoresist deposited on the substrate. A series of chemical treatments then either engraves the exposure pattern into (negative resist), or enables deposition of a
new material in the desired pattern upon (positive resist), the material underneath the photo resist.
Other more specific lithography techniques exist, such as electron, ion or X-ray beam lithography, and follow the same principle. Ion track technology and diamond patterning are other patterning techniques.
I.C.2.03 Etching
Etching consists in removing specific volumes from layers. Combined with lithography, it is used to create geometrical shapes in the substrate (e.g. by removing to a fixed depth the regions of the substrate that are not protected by resist).
Etching is wet when the material to remove is dissolved when immersed in a chemical solution, or dry when it is sputtered or dissolved using reactive ions in a plasma or a vapor phase etchant. Etching can be isotropic or anisotropic, highly selective or poorly selective. Deep Reactive Ion Etching (DRIE, figure 9c) is a common highly anisotropic etching process used to create deep penetration, steep-sided holes and trenches in substrates, typically with high aspect ratios.
I.C.2.04 Dicing
After having prepared a large number of MEMS devices on a silicon wafer, individual dies have to be separated. Wafer dicing may then be performed either by sawing using a cooling liquid or a dry laser process called stealth dicing.
Fig. 9a: blank silicon wafers before processing (diameters 2 to 12 inches, 5 to 30 cm)
Fig. 9b: photolithography schematic process: the pattern of the mask is negatively or positively transferred to the substrate
Fig. 9c: SEM picture of a geometrical structure on a silicon wafer obtained by DRIE with a standard Bosch process
Figure 10a: micro sapphire-based pressure sensor (chip and packaging).
Figure 10b: batch fabrication of micro
thermal conductivity detectors; unit size is 7x5mm²; 100 units are fabricated on one wafer. Fig. 10: two examples of sensors
designed and fabricated at MEMS TC
I.C.2. Applications of MEMS technology
Common and historical applications of MEMS technology are electronics and physical micro sensors fabrication. For instance, Schlumberger MEMS TC has been designing and developing MEMS-based pressure (figure 10a), temperature, thermal conductivity (figure 10b, also see I.C.3, figure 13, and appendix A), density, viscosity, seismic, acceleration and rotation embedded sensors, for surface or down hole tools.
Both due to the great variety of materials available for deposition, and to surface effects predominance, MEMS deposition techniques have been utilized in the fabrication of adsorption-based or oxidation-reduction chemical sensors, mainly for gas detection.
MEMS technology has finally been used for the design and fabrication of a new generation of micro fluidic circuits. By combining etching and bonding technologies, it became possible to create various shapes of circuits and functions for very specific purposes (e.g. flow channels and mixers, droplet producers and breakers). Thanks to the increase of the resolution of micro machining processes, fluidic circuits can integrate longer serpentine-shaped channels and more functions in smaller volumes. This, in addition to the increase of wafer sizes (figure 9a), increases the number of units that can be fabricated on one wafer. MEMS thus contributed to improve gas chromatography technology as suggested in next paragraph.
I.C.3. Perspectives of silicon-based gas chromatography
First and foremost, it has to be reminded here to the non-specialist reader that a gas chromatograph is a bulky laboratory equipment. Typical dimension is 50 cm (see figure 11a). GC conventional columns are coiled to form a cylinder (figure 11b) which is placed in the GC oven (typical dimension 30 cm) for temperature programming. Due to the big volume of the GC oven, temperature ramps are generally limited to 100°C/min, and cooling times (between two analyses) are several minutes-long. Moreover, gas supply implies additional heavy
equipment, such as carrier gas bottle, hydrogen generator or bottle, air compressor and filters. Finally, an analogical to numerical converting unit and a computer are necessary to control the system and to process the data.
Consequently, a conventional gas chromatograph is not a portable equipment, and, in oilfield, even less a surface or down hole tool-embedded sensor, contrary to most MEMS devices. It is also an expensive equipment (purchase, maintenance, replacement, human operating, power consumption, helium supply), mainly dedicated to laboratory analyses, which are usually longer than 1 minute, whereas MEMS are designed to be batch-fabricated in great quantity, mainly out of relatively low-cost raw materials, easily replaceable, autonomous, low-powered, and dedicated to in-situ fast monitoring.
However, GC technology was recently enough miniaturized so that a few models of portable gas chromatographs were commercialized (figure 12). Miniaturization was here achieved by basically reducing the size of each component in the gas chromatograph (injection system, valves and actuators, column, detector, electronic boards…), avoiding the resort to external supplies (computer, power), and using air as carrier gas. This approach, enabling to perform analyses almost anywhere on the surface, is a major advance in the domain, but yet struggles to overcome limitations in terms of analysis time and whole cycle time (preparation plus analysis). Indeed, even size-reduced, column blocks still show high thermal capacities, and stationary phase choice can be constraining.
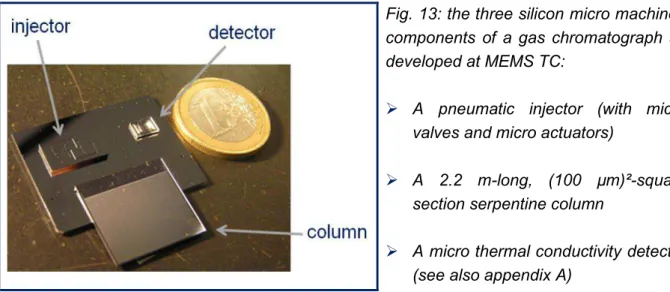
The improvements allowed by silicon micro machining technologies in micro fluidics leads one to believe that all these limitations could be overcome by the developments of MEMS-based gas chromatographs (extremely small size and adequate thermal properties). As it will be further developed in the literature review, the first attempt to fabricate a GC-based gas analyzer on a silicon wafer dates back to 1979. Ever since, efforts have been made to fully enable this technology. As an example, MEMS TC has developed since the middle 2000s a MEMS injector, a MEMS column and a MEMS detector for a hypothetical MEMS-based gas chromatograph (figure 13).
Fig. 11a: GC by Varian (model 3800) Fig. 11b: coiled GC column
Fig. 12: examples of recently commercialized portable gas chromatographs: C2V (top left), Torion (top right), SLS (bottom left) and Defiant Tech (bottom right)
Fig. 13: the three silicon micro machined components of a gas chromatograph as developed at MEMS TC:
A pneumatic injector (with micro
valves and micro actuators)
A 2.2 m-long, (100 µm)²-square
section serpentine column
A micro thermal conductivity detector