HAL Id: hal-02640318
https://hal.sorbonne-universite.fr/hal-02640318
Submitted on 28 May 2020
HAL is a multi-disciplinary open access
archive for the deposit and dissemination of
sci-entific research documents, whether they are
pub-lished or not. The documents may come from
teaching and research institutions in France or
abroad, or from public or private research centers.
L’archive ouverte pluridisciplinaire HAL, est
destinée au dépôt et à la diffusion de documents
scientifiques de niveau recherche, publiés ou non,
émanant des établissements d’enseignement et de
recherche français ou étrangers, des laboratoires
publics ou privés.
Electrolyte on Non- Catalytically Active Surface
Iban Azcarate, Wei Yin, Christophe Méthivier, François Ribot, Christel
Laberty-Robert, Alexis Grimaud
To cite this version:
Iban Azcarate, Wei Yin, Christophe Méthivier, François Ribot, Christel Laberty-Robert, et al..
As-sessing the Oxidation Behavior of EC:DMC Based Electrolyte on Non- Catalytically Active
Sur-face. Journal of The Electrochemical Society, Electrochemical Society, 2020, 167 (8), pp.080530.
�10.1149/1945-7111/ab8f57�. �hal-02640318�
Journal of The Electrochemical
Society
OPEN ACCESS
Assessing the Oxidation Behavior of EC:DMC Based Electrolyte on
Non-Catalytically Active Surface
To cite this article: Iban Azcarate et al 2020 J. Electrochem. Soc. 167 080530
View the article online for updates and enhancements.
Assessing the Oxidation Behavior of EC:DMC Based Electrolyte
on Non-Catalytically Active Surface
Iban Azcarate,
1,2,3Wei Yin,
1,4Christophe Méthivier,
5François Ribot,
2Christel Laberty-Robert,
2,3,zand Alexis Grimaud
1,3,z1
Chimie du Solide et de l’Energie, UMR 8260, Collège de France, 75231 Paris Cedex 05, France
2Sorbonne Université, CNRS, Laboratoire de Chimie de la Matière Condensée de Paris, LCMCP, UMR 7574, F-75005 Paris, France
3Réseau sur le Stockage Electrochimique de l’Energie (RS2E), CNRS FR3459, 80039 Amiens, France 4
Sorbonne Université, 4 Place Jussieu, 75005, Paris, France
5Laboratoire de Réactivité de Surface, Sorbonne Université, UMR 7197, Sorbonne Université, Faculté de Science et d’Ingénierie, Campus Jussieu, F-75005 Paris, France
The race for developing Li-ion batteries positive electrodes with always greater energy density has recently renewed interest towards understanding the formation of the so-called cathode electrolyte interface (CEI) forming upon cycling at high potential. In this work, we used an approach combining electrochemical measurements with physical characterizations to study the different anodic events occurring for the state-of-the-art EC:DMC 1M LiPF6(LP30) electrolyte. Doing so, we couldfind that EC-related species arefirst oxidized before the oxidation of DMC-related species at greater potential which forms a film relatively rich in organic polycarbonates species. Using a soluble redox probe, we could then demonstrate that while this organic layer is partially passivating, it is unstable with time and cycling. In fact, only reaching a potential as high as 5.4 V vs Li+/Li for several hours leads to the formation of a perfectly stable and passivating CEI.
© 2020 The Author(s). Published on behalf of The Electrochemical Society by IOP Publishing Limited. This is an open access article distributed under the terms of the Creative Commons Attribution 4.0 License (CC BY,http://creativecommons.org/licenses/ by/4.0/), which permits unrestricted reuse of the work in any medium, provided the original work is properly cited. [DOI:10.1149/ 1945-7111/ab8f57]
Manuscript submitted March 23, 2020; revised manuscript received April 11, 2020. Published May 12, 2020. Supplementary material for this article is availableonline
The successful development of Li-ion batteries was made possible by the mastering of the solid electrolyte interphase (SEI) that forms on the surface of graphitic carbon negative electrodes when charged (reduced) in contact with an aprotic electrolyte composed of a blend of linear and cyclic carbonates in which a Li salt, such as LiPF6, is added.1,2 Indeed, owing to its insulating
nature, the SEI prevents further reduction of the electrolyte and allows cycling graphite at voltage below the stability window of carbonate-based electrolyte while its ionic conduction allows for Li ions to reversibly intercalate upon cycling.3–6Large body of work have thus been dedicated to understanding both the SEI formation mechanism and its stability. In brief, afirst inner inorganic layer is formed by both the complete reduction of EC,6,7which is preferen-tially solvating Li+,8as well as the hydrolysis of the PF6−anions
with trace water contained in the solvent.9,10 On top of this inner layer, an outer layer made of organic oligomers then forms by the partial reduction of carbonates.11–13
While the formation and the chemistry of the SEI was very early on investigated and recognized, the in-depth investigation of the CEI formation and chemistry attracted much attention only later on. It is now well accepted that a thin layer is also forming on the surface of transition metal oxides (TMO) used as positive intercalation electrodes,14–20this layer being poised as cathode electrolyte inter-face (CEI). Furthermore, both the stability window of organic solvents under anodic polarization as well as the nature of this CEI greatly depends on the electrode.13,21–25For instance, CO2was
observed for the decomposition of ethylene carbonate (EC):dimethyl carbonate (DMC) at potential as low as 4.2 V when using LiNiO2,
while no gas was observed for other electrodes.26Nevertheless, for Li-rich NMC materials as well as for Ni-rich NMC layered compounds, gas is undoubtedly generated at high voltage, first CO2 from the oxidation of EC starting at about 4.2 V before the
release of oxygen at potential above 4.5 V from the oxidation of lattice oxygen which redox participates to the charge balance for Li-rich materials.27–29 Furthermore, contradicting conclusions were
made regarding the onset forfilm formation, with electrochemical quartz crystal microbalance (EQCM) showing no gain of mass below 4.4 V,30 while FTIR revealed oxidation products forming starting at 4 V for EC:DMC 1 M LiPF6using metallic electrodes.30
Similarly, electrochemical studies suggested that the onset for oxidation of EC:DMC 1 M LiPF6is as high as 5.6 V when using
spinel LiMn2O4 electrode,31,32 while ex situ X-ray photoemission
spectroscopy (XPS) revealed films forming above 4.5 V on the surface of LiNi0.5Mn0.5O4 as the result of EC oxidation.33
Furthermore, recent studies showed that upon electrochemical cycling, the CEI components were found to break down upon cycling above 4.25 V on the surface of LiNi0.8Co0.15Al0.05O2
(NCA)34which induces transition metal dissolution, as observed for NCA35and Li-rich NMC.36,37
Driven by the recent push toward the development of high potential intercalation electrodes, the importance of understanding the CEI formation becomes always greater. More specifically, understanding first the electrochemical formation of this CEI as well as its passivating nature appears as critical in order to avoid dissolution of transition metal at high potential, as well as parasitic reactions and self-discharge phenomenon upon rest for positive electrodes operating outside of the electrolyte stability window. Towards that goal, we embarked into a systematic electrochemical study combined with physical characterizations such as XPS, liquid NMR and gas analysis to decipher the reactivity of EC:DMC 1M LiPF6 electrolyte at high potential using inert glassy carbon
electrodes. While the choice of inert glassy carbon electrode is made to avoid complications related to transition metal dissolution as well as CEI cracking as induced by repeated de-intercalation events occurring upon cycling, as previously discussed,34–37 we must acknowledge that results might be different from those obtained with classical intercalation electrodes, both in terms of chemistry as well as stability of carbon at high potential. Nevertheless, by coupling this study with the use of redox soluble probe,38–41 we could investigate using such inert electrode the passivating nature of the CEI pre-formed at different potentials for different time. Overall, our study confirms that, under our experi-mental conditions, a CEI is formed starting at 4.5 V. Furthermore,
we could show that the CEI becomes denser and insulating only above 4.8 V upon prolonged formation (several hours). Nevertheless, cycling this CEI at mild potential (between 3 and 4 V), we reveal that it is not stable and dissolves upon time.
Experimental
Chemicals.—LP30: Solution of lithium hexafluorophosphate in ethylene carbonate and dimethyl carbonate (1M LiPF6in EC/DMC=
1/1 (v/v), 99.9% under argon) was purchased from Solvionic. Lithium (99.9%), LiPF6 (99,99%), Ferrocene (98%), Dimethyl Carbonate
(anhydrous, 99%) and Ethylene Carbonate (anhydrous, 99%) were purchased from Sigma Aldrich. All chemicals were used without further purification and EC and DMC solvents were dried on molecular sieves and LiPF6dried overnight in a Büchi oven.
Cyclic voltammetry.—In the two-electrode setup, the working electrode was a 3 mm diameter glassy carbon disk (BioLogic Science Instruments) and the reference and counter-electrode was a clean lithium foil (10× 3 mm). The two electrodes were immersed in the same LP30 solution (1 compartment) or the Li foil was placed in a bridge tube with a ceramic junctionfilled with the electrolyte solution (2 compartments).
In the three electrodes setup, the working electrode was a 3 mm diameter glassy carbon disk, the counter electrode was a Pt wire, and the reference electrode was a Ag+/Ag non-aqueous electrode in acetonitrile solution with 0.1M tetrabutylammonium hexa fluoropho-sphate (TBAPF6). The potential of this reference electrode was
measured to be EAg+/Ag= 3.21 V vs Li+/Li. All experiments were
performed in an Argon filled glove box (H2O and O2 content
<1 ppm) and cyclic voltammograms were recorded at 100 mV s−1 (unless specified) using of a BioLogic VMP-3 instrument.
For both the two- and the three-electrodes setup, 1.5 ml of electrolyte was used, making a volume of ≈21 ml cm−2 of active glassy carbon surface. When compared to commercial battery format (18650 or pouch cells), this ratio is much greater which will certainly enhanced the dissolution rate as well as effects related to shuttling of dissolved species.
XPS.—Electrolyte oxidation for XPS analysis was performed in an Ar-filled glovebox. Glassy carbon plate (HTW, 10 × 5 mm) was used as working electrode and a clean lithium foil was used as reference and counter electrode. The two electrodes were immersed in LP30 solution. After the desired potential was applied for 15 h, the GC electrode was rinsed with DMC. Electrodes were stored in a vial containing DMC and kept under argon atmosphere to transfer from the glovebox to the XPS apparatus. The GC electrode was then quickly taken out of the vial (the DMC serves as protection against oxygen and water from the air) and transferred into an ultrahigh vacuum (UHV) chamber with a pressure of 5× 10⁻¹⁰mbar, where X-ray photoelectron spectroscopy (XPS) was carried out on a Scienta Omicron Argus X-ray photoelectron spectrometer photo-electron spectrometer. Analysis was conducted at 5× 10⁻¹⁰mbar using a monochromatic Al Kαsource (hν = 1486.7 eV). XP spectra were collected at pass energy of 100 eV for the survey scan and 20 eV for the high-resolution core level (F1s, O1s, C1s P2p, Li1s). Gas evolution.—Monitoring of the gas released was performed using a previously reported setup consisting in a two-electrode Swagelok cell equipped with a pressure sensor and a gas inlet/outlet.42The cells were assembled in an Ar-filled glove box. For the positive electrode, freshly polished and dried glassy carbon plates were used. For the negative electrode, lithium metal discs (8 mm diameter) pasted on stainless steel current collectors were used. The two electrodes were separated with 12.7 mm disk-like separators wetted with 450 ± 20μl of electrolyte. To study the effect of Li on gas released, experiments were also performed using LiFePO4. In this case, a standard two-electrode Swagelok cell was
assembled using LiFePO4positive electrode made of particles mixed
with carbon SP in a ratio LiFePO4/CSP= 9/1 and lithium metal discs
pasted on stainless steel current collectors as negative electrode. After a full charge/discharge cycle, the LiFePO4was fully charged
and then discharged to a state-of-charge of 90% to obtain a flat discharge/reduction plateau of approximately 3.38 V vs Li+/Li. The cell was transferred to the glovebox and the lithium disc was carefully removed and replaced by a glassy carbon plate. The gas monitoring setup was installed, and the cell was cycled using the GC plate as positive electrode and the charged LiFePO4(Li1−xFePO4) as
negative electrode.
NMR.—In an Ar-filled glovebox, glassy carbon plate and a clean lithium foil were placed in a conical glass cell and immersed in 1.5 ml of electrolyte. The desired potential was applied between the two electrodes for 15 h. For some experiments, a two-compartment cell was used. The Li was separated from the GC working electrode by being placed in a bridge tubefilled with the electrolyte solution and equipped with a ceramic junction. An aliquot of 200μl of electrolyte was then collected from the GC electrode compartment, mixed with 400μl of deuterated acetonitrile dried on molecular sieves, and transferred in a sealed NMR tube. The tube was then taken out of the glove-box and the19F,31P,1H and13C NMR spectra were recorded on a Bruker AVIII300 spectrometer (300.13, 282.40, 121.50 and 75.47 MHz for 1H, 19F, 31P and 13C, respectively) equipped with a BBFO z-gradient 5 mm probe.1H and13C chemical shifts are referenced using the acetonitrile related signals (1H: CHD2CN at 1.94 ppm and
13
C: CD3CN at 1.32 ppm).
4331
P shifts are referenced against external 85% H3PO4 (0 ppm) and
13
F chemical shifts against external CF3C6H5(−63.7 ppm).
Results
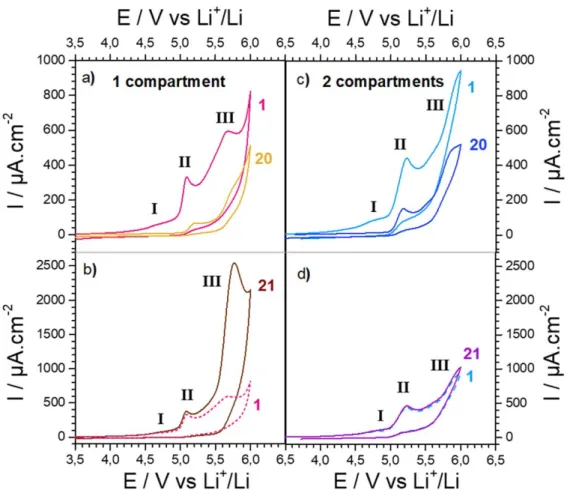
Electrochemical stability of LP30 on GC electrode.—The electrochemical response of LP30 electrolyte using inert glassy carbon electrode wasfirst investigated. A two-electrodes setup was used with a GC disc electrode as working electrode and Li foil as reference and counter electrode. On thefirst anodic scan (Fig.1a), three main features could be observed, all of them being irreversible. Thefirst one (wave I) is a broad wave of relatively low intensity and with an onset potential of approximately 4.2 V and a peak potential of 4.75 V. Thisfirst wave is followed by a sharp peak (wave II) of much higher intensity, whose onset potential stands around 4.95 V. The last feature (wave III) is a broad oxidation wave whose intensity is similar to peak II. Its onset potential is close to 5.3 V, and its peak potential is at 5.70 V. Finally, after this last wave, a steep increase of current is observed starting at 5.9 V corresponding to the electrolyte oxidation wall.
On the second scan, wave I partially disappeared, while waves II and III are still present although with a smaller current intensity (Fig.2a). This tendency is accentuated with the repeated scans and after 20 scans (Fig.1a), wave I has totally disappeared while wave II is still present but has lost close to 75% of its intensity and its peak potential is shifted by 100 mV toward more positive potentials. Furthermore, the shape of wave III has significantly changed, with a peak potential shifted by 100 mV, approximately, and a current intensity reduced of around 22%.
To understand the effect of surface passivation on these anodic features, the GC electrode was polished after 20 scans, sonicated in water and ethanol and carefully dried prior to record the following scan (e.g. scan 21). This cleaning step allows the recovery of waves I and II with their initial intensity and potential (Fig.1b), suggesting that the intensity decrease observed during the 20first cycles was due to the formation of a passivating layer on the surface of the GC electrode. When the upper potential limit is reduced from 6 V to 5.2 V below the onset potential for wave III, wave I disappears from the second scan on and the progressive current intensity decays for wave II (Fig.2b). Reducing the upper limit potential to 4.85 V below the onset potential for wave II also led to the total disappearance of wave I from the second scan on (Fig. 2c). Altogether, these Journal of The Electrochemical Society, 2020 167 080530
experiments suggest that the electrode passivation starts at a potential where wave I occurs, e.g. at 4.2 V.
However, the behavior of wave III is more complicated. Indeed, the cleaning step did not lead to the recovery of the wave intensity alike for waves I and II, but instead to a large current intensity increase and a 80 mV shift of the peak towards more positive potentials. Such observation evidences the formation of “soluble species” in the electrolyte that are irreversibly oxidized at approxi-mately 5.45 V. To clarify the origin of these “soluble species,” similar electrochemical experiments were repeated using a two compartments setup. For that, the Li foil was separated from the GC electrode and placed in a bridge tube with a ceramic junction. The initial electrochemical response obtained with this setup is very
similar to the one obtained with the one-compartment setup: the same three irreversible anodic features could be observed (Fig.1c). The only difference is the fuzzier aspect of wave III due to the greater ohmic drop of the two-compartments setup. Alike what we previously described for the single compartment setup, the repetitive cycling led to 1) the disappearing of wave I, 2) a large intensity decrease of wave II and 3) a relatively smaller decrease for the intensity of wave III. Again, cleaning the GC electrode after 20 scans allows for the complete recovery of wave I and II (Fig.1d). However, for the two-compartments setup, no large increase of the wave III intensity could be observed which remains unchanged (Fig.1d). Therefore, the large current increase observed at 5.45 V after several scans in the one-compartment setup can be
Figure 1. Cyclic voltammetry of LP30 on GC electrode at 100 mV s−1in (a) and (b) a one-compartment cell and (c) and (d) a two-compartments cell. 20 cycles are performed in a row (only cycle 1 and 20 are presented for clarity), then the GC electrode is polished and cleaned before cycle 21 is recorded.
Figure 2. Cyclic voltammetry of LP30 on GC electrode at 100 mV s−1in a one-compartment cell. 20 cycles are performed in a row: cycles 1 and 2 are highlighted in pink and brown respectively, while scans 3 to 20 are plotted in light grey. Cutoff potentials are: 6 V (a), 5.2 V (b) and 4.85 V (c).
unambiguously assigned to the oxidation of species previously generated at the Li counter electrode and that migrates to the GC electrode. Hence, placing the Li foil in a bridge tube thus strongly inhibits this migration and suppresses the large current increase.
To determine the origin of waves I and II and of the“soluble species” formed at the Li counter electrode, the electrochemical response of electrolytes composed of 1 M LiPF6dissolved in pure
EC and pure DMC was investigated (Fig.3). On GC electrode, the EC solution presents two anodic waves with peak potentials of 4.75 V and 5.67 V (Fig.3a). Rather, the DMC solution presents two anodic waves but with peak potentials of 5.08 V and 5.70 V (Fig.3c). Comparing these results with those obtained for LP30, it can reasonably be concluded that wave I in Figs.1and2corresponds to an EC-related oxidation (EC oxidation or EC-solvated salt oxidation) and that wave II corresponds to DMC-related oxidation (DMC oxidation or DMC-solvated salt oxidation). Bearing in mind that the second wave for both pure EC and pure DMC solution lies at approximately the same potential (∼5.7 V), the wave III in LP30 presumably arises from oxidation processes related to both solvents. The repetitive cycling of GC electrode in 1M LiPF6 EC
electrolyte led to an almost total electrode passivation (Fig. 3b). Cleaning the electrode allows the recovery of the first wave (corresponding to wave I in LP30), while the intensity for the second wave (corresponding to wave III in LP30) is slightly increased. On the other hand, after 20 scans in 1M LiPF6 DMC,
only the disappearance of thefirst wave (around 5.08 V) is observed, while the second seems to be slightly increased. After cleaning the electrode surface, thefirst wave (corresponding to wave II in LP30) recovers its original intensity, while the second wave (corresponding to wave III in LP30) dramatically increases in intensity. Hence, the large increase of wave III observed after polishing the electrode in LP30 is related to the release of“soluble species” created by the reduction of DMC or DMC-solvated salt at the Li counter electrode
into lithium alkyl carbonate or lithium carbonate, as previously discussed.44
From this series of measurements, a clearer vision of the electrochemical stability of LP30 is achieved, allowing the assign-ment of oxidation waves of LP30 on GC. In order to get further information concerning both the composition and the electroche-mical properties of the anodic degradation products of LP30, a combination of surface solution, gas and electrochemical analysis was then performed.
Surface composition/XPS analysis.—As discussed above, the anodic behavior for LP30 indicates the formation of a passivation layer on the GC electrode. In order to gather information on the composition of this layer, X-ray photoelectron spectroscopy (XPS) measurements were carried out on GC electrodes previously held in LP30 at a defined potential for 15 h and carefully rinsed with DMC in order to remove traces of LiPF6. After potentiostatic holding at
4.5 V (corresponding to the foot of wave I), the surface is mostly composed of C (85%) and O (8%) (Fig. 4a). The principal component for the C (1 s) spectrum is a large peak centered at 284.7 eV (grey peak) accounting for 73% of the carbon signal and typical of C–C bonds corresponding to the GC substrate. A smaller component centered at 286.4 eV (blue peak) corresponding to C–O bonds and accounting for 20% of the carbon signal can also be observed, indicating the partial oxidation of the GC substrate and the presence of ether or alcohol groups. Finally, peak at 289 eV (pink peak corresponding to 5% of C signal) and at around 291 eV (green peak corresponding to 1.8% of C signal) could be detected, most probably coming from adsorbed carbonates and to the reaction of the GC substrate with traces of HF formed by PF6− hydrolysis (see
discussion later). These observations clearly indicate that no organic or carbonate-basedfilms are deposited on the GC electrode at this potential. Increasing the potential to 4.8 V passed wave I and before
Figure 3. Cyclic voltammetry on GC electrode at 100 mV s−1for 1 M LiPF6in EC (a), (b) and in DMC (c), (d) compared to commercial LP30. 20 cycles are performed in a row (only cycle 1 and 20 are presented for clarity, then the GC electrode is polished and cleaned before cycle 21 is recorded.
wave II, the surface is again mostly composed of C (81%) and O (7%). The C–C component dropped to 65% of the carbon signal and the C–O component increased to 26%, while both O=C–O and C–F remained under the trace level of 5%. At 5.0 V (at the bottom of wave II), the total amount of C continued to decrease to 75% while the O increased to 16%. The C (1 s) signal is now composed of 63% of C–C, 26% of C–O, 9% of O=C–O and 2% of C–F. The decay of the C–C and the rise of the O=C–O components indicate that the GC substrate starts to be covered by carbonates groups originating from the decomposition of solvent molecules. Finally, at 5.4 V (after wave II and at the foot of wave III), the total amount of C continues to decrease (68%) while the oxygen amount reached 28%. This strong decay of C content is both due to a large increase of the O peak as well as to the decrease of the C–C component of C 1s spectrum whose contents dropped to 41% of the total C signal. Simultaneously, the C–O and O=C–O contents strongly increase to 41% and 15%, respectively, confirming the covering of the GC substrate by carbonates groups.
The trend previously described for C (1s) and O (1s) spectra was confirmed on several sets of carbon electrodes. Unfortunately, large scattering in the results was observed for Li (1s), F (1s) and P (2p) spectra. This poor reproducibility could arise from the solubility of the inorganic salts (LiPF6, LiF, LixPyFz) deposited on the GC
electrode, although special care has been taken to perform repro-ducible cleaning steps of the electrodes. Therefore, our analysis is limited to general trends and no quantitative analysis will be given for these species. Hence, at 4.5 V, the intensity recorded for the Li (1s) and F (1s) spectra is very limited (see Supplementary Fig. S1 available online at stacks.iop.org/JES/167/080530/mmedia). At 4.8 V and 5 V, both the Li (1s) and F (1s) spectra show an increase in intensity and the atomic percentage of both elements is obtained close to 5%. These results seem to indicate that traces of LiF deposit on the GC electrode starting at around 4.8 V.
Confronting these results with the electrochemical ones in Figs.1 and2, the growth of a passivationfilm as observed by XPS starting at around 4.8 V would correspond to wave II where DMC is oxidized. This oxidation leads to the formation of an organic-rich layer composed of polycarbonates, as seen by XPS. Regarding the growth of inorganic compounds, no conclusion can be drawn for
LiF. However, one can conclude that carbonate species originating from the solvent decomposition start forming above 4.5 V which suggests that thefirst oxidation event of EC (or EC-solvated salt) at 4.2 V does not lead to the formation of a significant CEI layer, contradicting the electrochemical results where passivation was inferred from the cycling behavior at potentials below 4.5 V.
Solution composition/NMR spectroscopy.—Having established that the deposition of carbonates and inorganic species start at potential >4.5 V (between 4.8 and 5 V), we then investigated the formation of soluble species in the electrolyte as a function of potential. For that,1H,13C,19F and31P NMR spectra were recorded
for solutions of LP30 electrolyzed at potentials of 4.0 V, 4.8 V and 5.4 V. The1H spectra of all the solutions was dominated by two
singlets at about 4.47 ppm and 3.69 ppm, attributed respectively to EC and DMC. The DMC/EC integration ratio of the two singlets was 5/4, close to 1.18 the expected value for a 1:1 v/v mixture of EC and DMC. Unfortunately, traces of degradation product could not be detected due to the large excess of solvent molecules. Similarly, no useful information could be extracted from the13C spectra for which
only the peaks for EC (CO:157.7 ppm; CH2: 66.5 ppm) and DMC
(CO:157.6 ppm; CH2: 55.7 ppm) were observed. Nevertheless,
unlike from 1H and 13C spectra, useful information could be
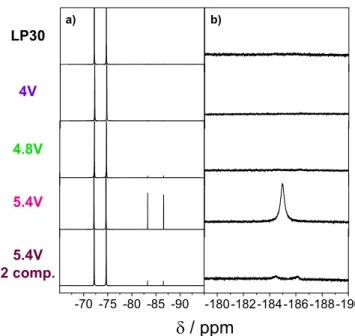
obtained from19F NMR (Fig.5and Fig. S2), for which the signal of
PF6−anions is simply a doublet centered at around−73 ppm (J =
700 Hz). For LP30 solutions kept at OCV (Fig. S3) or maintained at 4 V (Fig. 5), only the doublet associated to PF6− is observed. At
4.8 V (Fig. 5), an additional doublet, at −85.0 ppm, with a very weak intensity is seen. Further increasing the potential to 5.4 V leads to a large increase of this new doublet. Its chemical shift and its coupling constant (J = 935 Hz) are in good agreement with the presence of OPF2OH molecules in solution.45Besides this doublet, a
new broad singlet corresponding to HF appears around−184.9 ppm for solutions electrolyzed at 5.4 V, suggesting protons abstraction from the carbonates under these harsh electrolysis conditions.46,47
In order to establish if these degradation products originate from reactions occurring at the positive or the negative electrode, a similar experiment was repeated using a two-compartments cell where the Li counter electrode is separated from the GC working electrode
Figure 4. (a) C (1s) XPS spectra of GC electrodes immersed in LP30 solution and kept at 4.5, 4.8, 5, or 5.4 V vs. Li for 15 h. (b) Evolution of the various components as a function of the applied potential (lines are guide for the eye).
(Fig. 5, bottom). Doing so, we observe that removing the Li foil from the positive electrode compartment substantially reduces the amount of both OPF2(OH) and HF in the electrolyte. With a smaller
amount of HF, its19F NMR signal does not appear any more as a broad singlet, which is due to a fast association-dissociation of the proton, but as a doublet (J = 470 Hz). Furthermore, control experiments confirmed that the degradation of LP30 is not origi-nating from a simple aging process of the electrolyte in the sealed NMR tube stored outside the Ar-filled glovebox (Fig. S3). Finally, the deliberate addition of water in the LP30 solution was found to lead to the spontaneous formation of HF, to no surprise, although in
the absence of Li electrode, no OPF2(OH) is observed. Therefore, in
good agreement with previous report proposed by Nowak et al., the origin for both OPF2(OH) and HF in the electrolyte cycled at 5.4 V
is presumably the water-assisted reductive degradation of PF6−
anion occurring at the Li counter-electrode. This phenomenon corresponds to wave III as observed by cyclic voltammetry at 5.45 V in Figs.1and 2. Finally, from these NMR experiments, no soluble species coming from the anodic degradation of both the carbonates solvent and the inorganic salts could be detected.
Gas released/pressure cells.—Besides solid precipitates and solubilized species, gas products can also be generated during electrolyte oxidation. To monitor the formation of gaseous products at increasing potential, a two-electrode (GC plate and Li) cell equipped with a pressure transducer was thus used. After an initial resting period during which the pressure was stabilized before to start the electrochemical measurement, no pressure increase was measured up to 5.0 V (Fig.6a). Then, the pressure increases slightly above this potential. Furthermore, the pressure kept increasing at an almost similar rate even during the 10 hours rest period at the end of the anodic scan, suggesting that a chemical reaction, rather than an electrochemical one, is at the origin for the gas production. To probe the origin for this chemical reaction, lithium which is known to react spontaneously with carbonate electrolyte to generate gaseous products,1,48,49 was replaced by an LiFePO4 counter electrode.
Applying the same electrochemical procedure previously used for the Li cell, obvious differences could be observed (Fig.6b). Indeed, the onset for the pressure increase was found to be shifted to more positive potentials (⩾5.4 V) and the amount of gas generated was found smaller than when using Li as counter electrode. From these measurements, one can therefore conclude that the gas formed at around 5 V in the Li cell comes from the reductive degradation of the LP30 electrolyte on the Li electrode which, according to previous literature, formed either ethylene from the reduction of EC or some CO2.
7,50,51
Furthermore, these results indicate that the anodic degradation of LP30 generating gas only starts at a more positive potential close to 5.4 V, in agreement with previous report from Novak et al. who found no gas evolution for an EC:DMC electrolyte even above 5 V using carbon black electrodes.26
Figure 5. 19F NMR spectra of mix of CD3CN and pure LP30 or LP30 solutions electrolyzed with GC working electrode and Li counter and reference electrode at 4.0, 4.8 and 5.4 V vs Li for 15 h. (a) zoom of the PF6−region, (b) zoom of the HF region.
Figure 6.Pressure monitoring using a two-electrode pressure cell with a GC plate as working electrode and Li foil (a) or LFP (b) as reference+ counter electrode, with LP30 as electrolyte. Potential steps of 2 h followed by resting periods of 2 h are performed. Potential is progressively increased from 4 V to 5.4 V before to hold the cell at the OCV for 10 h.
Modification of the electrochemical properties of GC electrode/ Redox probe.—From the previous experiments, one can conclude that upon anodic polarization, afilm is deposited on the surface of GC electrode going along with the formation of soluble and gaseous species. However, these measurements do not provide direct information regarding the impact of such degradation on the electrochemical properties of positive electrodes. In order to study such impact, we revisited an approach previously developed to probe the electrochemical properties of the CEI formed at the negative electrode: the use of soluble redox molecules.38–41 This approach, which allowed for a precise quantification of the passivating properties of the CEI as well as its stability, has not been used yet in the context of the anodic degradation of carbonate-based electro-lytes at the positive electrode. Hence, 20 mM Ferrocene (Fc) was dissolved in LP30 solution and cyclic voltammograms recorded using a three-electrodes setup with a GC disc electrode as working electrode, a Pt wire as counter electrode, and a Ag+/Ag reference electrode. Prior to recording the electrochemical response of Fc, different pre-treatments consisting in potentiostatic holdings were
applied to the GC electrode in order to pre-form an eventual CEI layer. The cyclic voltammetry data are reported in Fig.7a and the Fc oxidation currents measured for the various experiments are plotted in Fig.7b. On a GC electrode kept 30 min at 4 V (Fig.7a, left panel), a“duck-shaped” CV is measured, with a standard potential of E1/2=
3.28 V, a peak separation ofΔE = 120 mV and anodic and cathodic currents of respectively i,a= 1880 and i,c = 1810 μA.cm−2. These values are typical of a reversible redox couple with a fast electron transfer and limited by the diffusion of the redox molecule toward the electrode surface. When performing several successive scans, no major change for both the potential and the current is observed, indicating very little modification of the electrode surface. For more positive potential applied during the pre-treatment for 30 min, a slight and progressive decay of the anodic current is observed during the 1st scan (Fig.7b left). Hence, for instance, after holding the GC electrode at 5.4 V, the anodic current decreased to 1170μA.cm−2, which represents a loss of roughly 35% of the current expected on a clean electrode. However, regardless of the potential applied during the pre-treatment step, the anodic current progressively increased
Figure 7. (a) Cyclic voltammetry for a solution made of 20 mM Fc in LP30 measured with a GC disc (d= 3 mm) working electrode, a Pt counter electrode and Ag+/Ag reference electrode. Scan rate is 100 mV s−1. The GC electrode underwent a pretreatment consisting in a potentiostatic holding step in LP30 solution at potentials ranging from 4.0 V to 5.4 V, with a Li foil counter and reference electrode, for 30 min, 1 h or 15 h. (b) Corresponding Fc oxidation current before and after potential holding step extracted for the experiments shown in panel a. Filled circles correspond to the current measured during thefirst scan, while empty circles correspond to the current measured during the 50th cycle.
during the successive scans to ultimately reach the value measured on a clean GC electrode. Two physical behaviors can explain this observation. First, it could indicate that the layer formed during the 30 min potential holding partially inhibits the electron transfer during the first scan but is not stable upon cycling and is quickly swept, at least partially, from the surface of the GC. Second, the CEI film can show some porosity into which Fc diffuses with time after dipping the electrode into the Fc solution. There, the lower current measured during the first scan may simply arise from a local “dilution effect” that quickly disappears during the successive scans. For the 1 h pretreatments experiments, similar trend is observed: the anodic current measured during the first scan decreases with more positive pretreatment potential. However, the magnitude for this decay is found much greater than after 30 min potentiostatic holding steps. Hence, after holding at 5.0 V, the intensity loss is around 50% and it reaches 85% for 5.4 V holding. Such drastic current loss cannot be attributed to a simple “dilution effect,” as discussed previously, and is certainly due to the passivation of the electrode by a blocking layer. Interestingly, for all the potentials, except for 5.4 V, the CVs kept the usual reversible“duck shape” indicating that despite slower kinetics, the electron transfer is still reversible. Nevertheless, after treatment at 5.4 V, the situation is different and the anodic wave is closer to a S-shaped plateau, indicating the irreversible oxidation of the Fc probe. Despite the relatively high current loss observed for the 1st scan, a progressive current increase is observed for all the experiments during the successive scans. Indeed, up to 5.2 V, expected anodic current on clean GC electrode is recovered after 50 scans, while for 5.4 V, it saturates and only 75% of the expected value is recovered (Fig.7b, middle panel). This observation again suggests that despite its blocking nature, the CEI layer formed on the GC electrode is not stable and progressively loses its physical properties with time, either due to partial dissolution or due to the formation of porosities. Finally, a long pretreatment step of 15 h was then applied at each potential (except for the 5.4 V step for which a step of only 6 h was applied as no oxidative current was measured after that time). For potentials below 4.8 V, this pretreatment has a similar effect than what was previously observed for 30 min and 1 h: a decrease in anodic current density was measured during thefirst scan where a duck shape is found which is progressively recovered during the successive scans tofinally reach the expected value (Fig.7a, bottom panels). For potentials more positive than 4.8 V, a different situation
is observed. Starting from 4.8 V, the 1st scan has no longer a reversible “duck shape,” and presents an anodic S-shaped wave, similar to our observations made after 1 hour holding at 5.4 V. Furthermore, the recovery of the anodic current intensity with cycling is dramatically slower than for other pretreatments. Hence, the current loss measured after thefirst scan is around 77% for 5.0 V and close to 98% for 5.2 V and 5.4 V (Fig.7b, right panel). Once again, the anodic current is found to evolve during the successive scans. At 4.8 V, current is completely recovered, while for 5.0 V and 5.2 V, the anodic current after 50 scans is close to 75% of the one expected for a clean GC electrode. Interestingly, below this threshold of 4.8 V, inorganic species were found to be formed, which can eventually dissolved with time, while above this threshold organic polycarbonate species were found to be formed, whose solubility is lower than that of inorganic species.
Strikingly, at 5.4 V, almost no current evolution is observed during 100 scans. These observations clearly indicate that while a CEIfilm is formed starting at 4.5 V, this film is only passivating for potentials above 4.8 V and gets more and more blocking as potential increases. However, thefilm, which at these potentials is predomi-nantly composed of polycarbonates formed by the decomposition of DMC, as found above, seems to have a poor stability even after 15 h of pre-treatment at potential as high as 5.2 V. Only applying a potential of 5.4 V corresponding to wave III in Figs.1–3allows the formation of a stable blockingfilm. Nevertheless, our NMR analysis (Fig.5) as well as electrochemical tests in two-compartments cells (Fig.1) show that wave III corresponds to the formation of soluble species. Therefore, the concomitant oxidation of EC- and DMC- that kicks at potential close to 5.5 V (Fig.3) must be responsible for the passivation of the GC electrode, while accelerated densification at these harsh potentials might also help the blocking behavior for the CEI.
Confronting these results with our previous observations by XPS, one can conclude that the initial oxidation of EC-related species which produces, starting at 4.2 V, small amount of inorganic compounds, presumably including LiF, does not passivate the surface of the positive electrode (Fig.8). Furthermore, these initial inorganic species are found very unstable upon cycling. Hence, cycling above 4.5 V at potentials at which DMC-related species are oxidized leads to the formation of organic polycarbonate species that passivate thefilm. Nevertheless, these species are not sufficient to fully stabilize the CEI and few cycles between 3 and 3.6 V are
Figure 8. Conclusive scheme, summarizing the variousfindings obtained by electrochemical experiments combined with ex situ techniques.
sufficient to at least partly dissolve the film which loses its passivation effect. Only when holding for several hours the potential at 5.4 V where EC- and related species as well as DMC-related soluble species produced at the negative electrode are oxidized, thefilm is fully passivating and stable upon cycling.
Conclusions
In conclusion, by conducting an approach combining electro-chemical measurements with physical characterizations, we could gain a better view of the oxidation behavior for 1M LiPF6EC:DMC
electrolyte on non-catalytically active surface. Hence, afirst oxida-tion is found starting at 4.2 V vs Li+/Li corresponding to the oxidation of EC-related species, followed by a second anodic event starting at 4.8 V vs Li+/Li corresponding to the oxidation of DMC-related species. Finally, starting at 5.4 V vs Li+/Li, a large anodic current is observed, which originates from the oxidation of EC- and DMC-related species as well as from the oxidation of soluble products formed during the reduction of DMC-related species at the Li counter electrode. Furthermore, we could show that while a very small amount of inorganic species such as LiF are formed starting at 4.2 V, the main deposition process occurs above 4.8 V and corresponds to the deposition of organic polycarbonates species. Finally, using soluble redox molecules as probes, the passivating effect of such CEI layer was assessed. We could therefore confirm that the initial CEI film mostly composed of inorganic species formed below 4.8 V is not passivating and very soluble with time. When cycling above 4.8 V, the CEIfilm which is more organic in nature becomes increasingly passivating but remains unstable and only a long potentiostatic holding at 5.4 V for several hours fully passivates and stabilizes this CEIfilm. Hence, for non-catalytically active surfaces, passivation should not be a concern when cycling LP30 electrolyte below 5.4 V. Finally, we believe that such methodology relying on the use of multiple compartments electro-chemical cells as well as redox soluble probe is crucial to reveal the role of the TMO positive electrode on the nature of the CEI, as well as understand the stabilization effect observed at high potential for concentrated organic electrolytes such as 5 M LiFSI in DMC.52,53
Acknowledgments
I.A, C.L-R. and A.G. acknowledge financial support from the French national network“Réseau sur le Stockage Electrochimique de l’Energie’ ”RS2E) FR CNRS 3459 and from Laboratory of Excellence program STORE-EX (ANR 10-LABX-0076).
ORCID
Iban Azcarate https://orcid.org/0000-0002-8559-4383 Wei Yin https://orcid.org/0000-0002-5496-4097 François Ribot https://orcid.org/0000-0001-5576-7725 Christel Laberty-Robert https://orcid.org/0000-0003-3230-3164 Alexis Grimaud https://orcid.org/0000-0002-9966-205X
References
1. K. Xu,Chem. Rev., 114, 15503 (2014).
2. M. Winter, B. Barnett, and K. Xu,Chem. Rev., 118, 11433 (2018). 3. M. Gauthier et al.,J. Phys. Chem. Letter, 6, 4653 (2015).
4. S. Menkin, D. Golodnitsky, and E. Peled,Electrochem. Comm., 11, 1789 (2009). 5. D. Aurbach, B. Markovsky, M. D. Levi, E. Levi, A. Schechter, M. Moshkovic, and
Y. Cohen,J. Power Sources, 81–82, 95 (1999).
6. K. Edström, M. Herstedt, and D. P. Abraham,J. Power Sources, 153, 380 (2006). 7. G. M. Hobold, A. Khurram, and B. M. Gallant,Chem. Mater., 32, 2341 (2020).
8. K. Xu,Chem. Rev., 104, 4303 (2004).
9. K. Kanamura, S. Toriyama, S. Shiraishi, M. Ohashi, and Z. Takehara,
J. Electroanal. Chem., 419, 77 (1996). 10. D. Strmcnik et al.,Nat. Catal., 1, 255 (2018).
11. E. Peled, D. Golodnitsky, and G. Ardel,J. Electrochem. Soc., 144, L208 (1997). 12. S. Malmgren, K. Ciosek, M. Hahlin, T. Gustafsson, M. Gorgoi, H. Rensmo, and
K. Edström,Electrochem. Acta, 97, 23 (2013). 13. D. Aurbach,J. Power Sources, 89, 206 (2000).
14. N. Dupré, J.-F. Martin, D. Guyomard, A. Yamada, and R. Kanno,J. Power Sources, 189, 557 (2009).
15. K. Edström, T. Gustafsson, and J. O. Thomas,Electrochem. Acta, 50, 397 (2004). 16. N. Yabuuchi, K. Yoshii, S. T. Myung, I. Sakai, and S. Komaba,J. Am. Chem. Soc.,
133, 4404 (2011).
17. R. Dedryvère, H. Martinez, S. Leroy, D. Lemordant, F. Bonhomme, P. Biensan, and D. Gonbeau,J. Power Sources, 174, 462 (2007).
18. T. Eriksson, A. M. Andersson, A. G. Bishop, C. Gejke, T. Gustafsson, and J. O. Thomas,J. Electrochem. Soc., 149, A69 (2002).
19. D. Lu, M. Xu, L. Zhou, A. Garsuch, and B. L. Lucht,J. Electrochem. Soc., 160, A3138 (2013).
20. T. Yoon, T. Lee, J. Soon, H. Jeong, S. Jurng, J. H. Ryu, and S. M. Oh,
J. Electrochem. Soc., 165, A1095 (2018).
21. D. Aurbach, K. Gamolsky, B. Markovsky, G. Salitra, Y. Gofer, U. Heider, R. Oesten, and M. Schmidt,J. Electrochem. Soc., 147, 1322 (2000).
22. D. Aurbach, B. Markovsky, G. Salitra, E. Markevich, Y. Talyossef, M. Koltypin, L. Nazar, B. Ellis, and D. Kovacheva,J. Power Sources, 165, 491 (2007). 23. K. Kanamura,J. Power Sources, 81, 123 (1999).
24. G. Eggert and J. Heitbaum,Electrochem. Acta, 32, 1443 (1986).
25. H. Duncan, Y. Abu-Lebdeh, and I. J. Davidson,J. Electrochem. Soc., 157, A528 (2010).
26. R. Imhof and P. Novak,J. Electrochem. Soc., 145, 1702 (1999).
27. R. Jung, M. Metzger, F. Maglia, C. Stinner, and H. A. Gasteiger,J. Phys. Chem. Lett., 8, 4820 (2017).
28. D. Streich, C. Erk, A. Gueguen, P. Müller, F.-F. Chesneau, and E. J. Berg,J. Phys. Chem. C, 121, 13481 (2017).
29. E. Castel, E. J. Berg, M. El Kazzi, P. Novak, and C. Villevieille,Chem. Mater., 26, 5051 (2014).
30. M. Moshkovich, M. Cojocaru, H. E. Gottlied, and D. Aurbach,J. Electroanal.
Chem., 497, 84 (2001).
31. J. Kasnatscheew, R. W. Schmidt, R. Wagner, M. Winter, and R. Schmitz,
J. Electrochem. Soc., 160, A1374 (2013).
32. J. Kasnatscheew, B. Streipert, S. Röser, R. Wagner, C. Laskovic, and M. Winter,
Phys. Chem. Chem. Phys., 19, 16078 (2017).
33. L. Yang, G. Ravdel, and B. L. Lucht,Electrochem. & Solid-State Lett., 13, A95 (2010).
34. Z. W. Lebens-Higgins et al.,Chem. Mater., 30, 956 (2018). 35. N. V. Faenza et al.,Langmuir, 33, 9333 (2017).
36. D. Leanza, C. A. F. Vaz, G. Melinte, X. Mu, P. Novak, and M. El Kazzi,ACS Appl. Mater. Interfaces, 11, 6054 (2019).
37. D. Leanza, M. Mirolo, C. A. F. Vaz, P. Novak, and M. E. Kazzi,Batteries and
Supercaps. Interfaces, 2, 482 (2019).
38. M. Tang and J. Newman,J. Electrochem. Soc., 158, A530 (2011). 39. M. Tang, S. Lu, and J. Newman,J. Electrochem. Soc., 159, A1775 (2012). 40. M. T. Dinh-Nguyen and C. Delacourt,J. Electrochem. Soc., 163, A706 (2016). 41. T. Kranz, S. Kranz, V. Miss, J. Schepp, and B. Roling,J. Electrochem. Soc., 164,
A3777 (2017).
42. F. Lepoivre, A. Grimaud, D. Larcher, and J.-M. Tarascon,J. Electrochem. Soc., 163, A923 (2016).
43. G. R. Fulmer, A. J. M. Miller, N. H. Sherden, H. E. Gottlieb, A. Nudelman, B. M. Stoltz, J. E. Bercaw, and K. I. Goldberg,Organometallics, 29, 2176 (2010). 44. S. J. An, C. Daniel, D. Mohanty, S. Nagpure, and D. L. Wood,Carbon, 105, 52
(2016).
45. S. Wiemers-Mer, M. Winter, and S. Nowak,Phys. Chem. Chem. Phys., 18, 26595
(2016).
46. Y. Zhang et al.,EES, 13, 183 (2020).
47. Y. Yu, P. Karayalali, Y. Katayama, L. Giordano, M. Gauthier, P Maglia, R. Jung, I. Lund, and Y. Shao-Horn,J. Phys. Chem. C, 122, 27368 (2018).
48. M. He, R. Guo, G. M. Hobold, H. Gao, and B. M. Gallant,PNAS, 117, 73 (2020). 49. A. N. Dey,Thin Solid Films, 43, 131 (1977).
50. J.-S. Shin, C.-H. Han, U.-H. Jung, S.-I. Lee, H.-J. Kim, and K. Kim,J. Power Sources, 109, 47 (2002).
51. K. Kumai, H. Miyashiro, Y. Kobayashi, K. Takei, and R. Ishikawa,J. Power
Sources, 81, 715 (1999).
52. M. Li, C. Wang, Z. Chen, K. Xu, and J. Lu, Chem. Rev. (2020).
53. Y. Yamada, J. Wang, S. Ko, E. Watanabe, and A. Yamada,Nat. Energy, 4, 269