HAL Id: hal-00534207
https://hal-mines-paristech.archives-ouvertes.fr/hal-00534207
Submitted on 4 May 2018
HAL is a multi-disciplinary open access
archive for the deposit and dissemination of
sci-entific research documents, whether they are
pub-lished or not. The documents may come from
teaching and research institutions in France or
abroad, or from public or private research centers.
L’archive ouverte pluridisciplinaire HAL, est
destinée au dépôt et à la diffusion de documents
scientifiques de niveau recherche, publiés ou non,
émanant des établissements d’enseignement et de
recherche français ou étrangers, des laboratoires
publics ou privés.
Load, Wind and Hydro Power Forecasting Functions of
the More-Care EMS System
Georges Kariniotakis, Didier Mayer, James Halliday, Geoff. Dutton, Andrew
D. Irving, Richard Brownsword, Petros Dokopoulos, Minas C. Alexiadis
To cite this version:
Georges Kariniotakis, Didier Mayer, James Halliday, Geoff. Dutton, Andrew D. Irving, et al.. Load,
Wind and Hydro Power Forecasting Functions of the More-Care EMS System. Med Power 2002, Nov
2002, Athènes, Greece. �hal-00534207�
Load, Wind and Hydro Power Forecasting Functions of the More-Care EMS System
G.N. Kariniotakis*, D. MayerEcole des Mines de Paris, Centre d’Energétique,
France
J.A. Halliday, A.G. Dutton, A.D. Irving, R.A. Brownsword Energy ResearchUnit,
CLRC Rutherford Appleton Laboratory,
UK
P.S. Dokopoulos, M.C. Alexiadis Dept. of Electrical Engineering, Aristotle Univ. of Thessaloniki,
Greece
(*) Tel.: +33-493957599, fax: +33-49395753, kariniotakis@cenerg.cma.fr
ABSTRACT: The objective of the MORE-CARE project has been to develop an advanced Energy management System (EM S) to assist the operators of a medium or a large isolated power system. MORE -CARE focuses on the case of systems including substantial amount of renewable energy sources and namely wind, and hydro power. The paper presents the functions developed in the frame of this project for the prediction of the wind production, the hydro reservoirs inflows and the total power system load. The man-machine interface characteristics related to these forecasting functions are presented together with preliminary results on their on-line performance.
Keywords: Wind forecasting, water inflows prediction, load forecasting, numerical weather predictions, SCADA, EMS.
I. INTRODUCTION
The general scope of the More -Care Energy Management System (EMS) is to contribute in the achievement of an optimal utilization of multi-renewable energy systems, in a wide variety of medium and large size isolated systems with diverse structures and operating conditions. Such power systems may be characterized by:
•
Several conventional fossil-fuelled generation plants;•
Multiple renewable sources (photovoltaic, wind, hydrounits with or without storage facilities, geothermal, etc.)
•
Privately owned plants. Consideration of thisnon-dispatchable power changes substantially the control conditions of the network, namely the dispatching algorithms and controllable variables.
The More-Care system aims to assist the operators of such systems by proposing optimal operating scenarios for the various power units, as well as the various actions needed to avoid dangerous situations, which might result from a poor prediction of load or weather or pre-selected disturbances.
The optimal operation scenarios for the conventional and renewable units are generated by a unit commitment (UC) and an economic dispatch (ED) modules. A dynamic security assessment (DSA) module supervis es the operation of the UC and ED modules with the objective of producing schedules for the power units that respect security constraints.
The above functions require, as input, forecasts for:
•
the total load of the power system,•
the load at the level of bus-bars,•
the production of the wind parks,•
and finally of the water inflows at the reservoirs of the hydro installations.The ED and UC functions operate in two cycles:
•
a fast one, covering a short -term horizon up to 4-8 hours ahead with a “basic” time-step of 10-20 minutes. This cycle is performed with a frequency equal to the basic time-step. The aim is to update operation schedules according to most recent on-line information especially about renewable sources. This cycle is critical for the optimal operation of fast units like gas turbines and diesel engines and for taking preventive measures when penetration is high.•
Secondly, More-Care operates with a slow cycle, covering a horizon up to 48 hours ahead with hourly time-steps. This cycle is performed every hour. A long-term UC function is then performed to schedule slow units like steam turbines or storage.The different temporal characteristics of the above two cycles involve development of appropriate forecasting functions for each cycle. Functions developed for the fast cycle will be mentioned hereafter as “short-term”, while forecasting for the slow cycle will be referred to as “long-term”.
The paper presents the methodologies applied to provide solutions to each prediction problem and the basic characteristics of the developed on-line modules. The implementation of these modules and their integration within the More-Care platform is also described. The software has been installed for on-line operation at the islands of Crete (Greece) and Madeira (Portugal). A third application concerns Ireland, where More-Care has been configured to operate as a stand-alone wind forecasting platform for the prediction of the output of 11 wind farms. Figure 1 shows the global modular architecture of the More-Care system with the integrated forecasting modules.
Paper accepted for presentation at the 3rd Mediterranean Conference and Exhibition on Power Generation, Transmission, Distribution and Energy Conversion MED POWER 2002, jointly organized by National Technical University of Athens, IEE Hellas, Israel and Cyprus, Athens, Greece, November 4-6, 2002
II. IMPLEMENTATION OF ON-LINE MODULES. Due to the diverse needs of targeted medium and large-scale systems, the software developed is highly modular, allowing integration of the options that are best suited to the particularities of each system. The developed functions are characterized by a “plug-and-play” functionality. To achieve this, it was necessary to develop a relational database for accessing on-line data, handling historical data and input/output of the models. Plug-and-play and modular properties are useful in the implementation of management and forecasting functions in the case of distributed generation, where the disperse nature of the resources requires a transparent methodology for handling information.
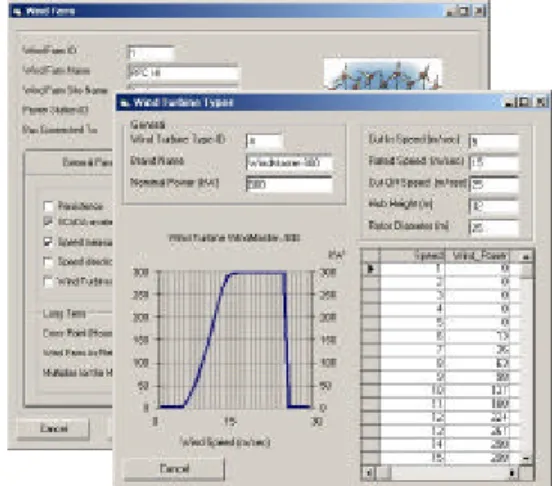
example of the user interface for the static wind farm data is given in Figure 3. The ensemble of static parameters consists indeed a “model” of the power system.
•
On-line data of recent information from the SCADA such as total load, wind parks production, wind speed etc. A connection to the SCADA database permits the transfer of measurements to MORE-CARE.•
Numerical weather forecasts. They are introduced in the database through ftp or internet connection to a site hosting the relevant national meteorological model.•
The output of the various modules.•
Information on scheduled maintenance of the power units.•
History on the performance of each activated model.SCHEDULER
SCHEDULER MMIMMI
DATABASE DATABASE MODULE m MODULE m ODBC SCADA WindFarm WindSpeed W i n d D i r e c t i o n WindPower U p d a t e P a s t W in d D a t a
STWFMOD_Wind_OutputTurbinesSpeedPowerT i m eF a r mCluster W F _ M E T E OT i m e WindFarm WindSpeed W i n d D i r e c t i o n SKIRON W i n d S p e e d WindDirection ConvertSkironData PAST_Wind Time_Index F a r m I d P o w e r WindSpeed WindDirection C o m b i n e M a inData C o m b i n e M a inData SCADA HILARM WindSpeed W i n d D i r e c t i o n ConvertH i l a r mData WindFarm Availability WindFarmCluster Turbines WhenOff WhenOn Wind Farm AvailHorizon Time_Index WindFarmCluster TurbineNumber Calculate Avaliability on Horizon S t a t i c _WindFarm S t a t i c _WindFarm Insert Data For Short Term Linked Windfarms ST_LinkToWF PAST_Wind Time_Index F a r m I d P o w e r WindSpeed WindDirection I n s e r t d a t a F o r Long Term WindFarms LT_LinkToWF L T W F _ M E T E OTimeWindFarm WindSpeed WindDirection LTWFMOD_Wind_OutputT i m eFarmClusterTurbinesSpeedPower Start
Online_W i n d F a r m sWindFarmWindSpeed WindDirectionWindPower ReadScada STWF_Wind_OutputTimeFarmC l u s t e r T u r b i n e s SpeedP o w e r STWF_Wind_OutputTimeFarmC l u s t e r T u r b i n e s SpeedP o w e r L T W F _ M E T E OTimeWindFarm WindSpeed WindDirection GetLongTermHorizonForecasts
LTWF_Wind_OutputTurbinesT i m eFarmCluster SpeedPower LTWF_Wind_OutputTurbinesT i m eFarmCluster SpeedPower S e t u p_WF_M1a_Armines S e t u p_WF_M1a_Armines S e t u p_WF_M1b_Armines S e t u p_WF_M1b_Armines S e t u p_WF_M1c_Armines S e t u p_WF_M1c_Armines W F module M A I N _Params M A I N _Params S t a t i c _PowerSystemTable S t a t i c _PowerSystemTable S t a t i c _WindFarmClusters S t a t i c _WindFarmClusters S t a t i c _WTurbineBrands S t a t i c _WTurbineBrands S t a t i c _WTurbineCurves Brand, Speed, Power S t a t i c _WTurbineCurves Brand, Speed, Power
FORECASTING MODEL (F- NN) NUMERICAL WEATHER PREDICTIONS O N- LINE WIND FARM DATA
01 22 4364 8 Power output Hours Hours ODBC METEO FORECASTS FTP, Internet SCADA OPERATOR OPERATOR MORE-CARE MORE-CARE
Figure 1: Architecture of the MORE-CARE system.
The database is developed so as to be as generic as possible. This permits easy maintenance and updating when modifications are required, e.g. addition of a new wind farm.
Emphasis is given in modeling wind farms. Due to the high number of wind turbines that can be present in a system, a wind farm is modeled by clusters of wind turbines, each one composed by identical machines.
Forecasts are provided per cluster of identical turbines. This is necessary for UC and ED to produce schedules for the number of wind turbines that are going to operate during each time step of the forecast horizon without recalling information from the database on the characteristics of the wind farms. When MORE-CARE operates as a Modularity has permitted the implementation of alternative
mathematic models for the same function, ranging from simple and robust to more sophisticated ones. This permitted to evaluate the on-line performance of different approaches on a specific problem, i.e. on load forecasting.
A. Data management
In order to achieve modularity of the implemented models it was necessary to develop an appropriate transparent data structure for interfacing the various modules. The choice of a relational database was made for this purpose. The modules read and write directly to that database input and output data using ODBC functionality and SQL queries. Modules are called to run by the global scheduler of the application.
The database includes all information on:
•
parameters of the application like forecasting horizons, time-steps, activated models etc.•
Information on the types of available on-line data by SCADA or meteorological system.•
Static parameters for the description of the power stations and the units. E.g a detailed representation of the wind farms, the characteristics of the site, the types of wind turbines and the characteristics of each type are given. Anstand-alone wind forecasting platform (i.e. in Ireland) forecasts of the total windfarm power are generally sufficient. The database permits information given at regional level (e.g. meteorological forecasts) to be related to the wind farms of that region. By this way wind upscaling forecasting functionalities can be developed - Figure 2.
Forecasts projection per region SHORT- TERM
Wind speed/power
forecasts generati on f orecasts generation
Long-term (meteo ) Model for site A1
Short-term model for site A1
Short-term model for site B1
Data-base function
Power for site A1 LONG -TERM
Wind speed/power
Power for site Ak
Power for site B1
Power for site Bk
Region A
Region B
Figure 2: Procedure for the generation of wind power forecasts for each
B. The Man-Machine Interface
An ergonomic man-machine interface (MMI) has been developed for the communication with the operators. It communicates directly with the database and aims to assist the maintenance of the various power system and application parameters described in the previous Paragraph. The MMI gives the possibility to display on-line SCADA data in various alternative ways enabling an ergonomic monitoring of the power stations and especially the renewable plants. The MMI gives various possibilities for displaying forecasting results to the operators, i.e. in forms of confidence intervals, which are regularly updated when new forecasts are available.
Figure 3: Example of user interface for wind farm description.
Figure 4: More-Care MMI with display of load and renewables forecasts.
III. LOAD FORECASTING
The aim of the load forecasting function is to predict the total power system load for a horizon up to 48 hours ahead. Predictions are required in the form of spot values as well as confidence intervals. A particularity of the More-Care application is that regular updates (i.e. every 20 minutes) of the forecasts are required for a continuous optimization of the power units scheduling due to the high variability of the renewables production. Frequent updates of load predictions
Figure 5: MMI functions for displaying wind park forecasts.
are needed due to the sensitivity of load to external variations like weather changes. Although in an interconnected system, such changes would have only a local effect, in an autonomous system they may have a global effect. The influence of weather on power demand can be further accentuated in autonomous systems with an important tourism sector.
In the classical load-forecasting problem, forecasts are performed once or twice per day at a specific time origin (i.e. at 06:00). In that case, a forecasting model needs to update a typical daily load pattern taking into account temperature predictions, type of day etc. When load forecasts are produced with a sliding-window scheme, the forecasting task itself becomes more challenging since it corresponds to a fully dynamic problem.
Another difficulty in the case of autonomous systems concerns the quality of input. Data are often affected by events like power cuts or even blackouts and problems in data transmission. Being unpredictable, such events, when present in the data, affect the performance of the models.
A. Load preprocessing module.
The robustness of a prediction model on corrupted input varies according to the type of model. It is expected that in any case, the quality of the results be affected. A preprocessing or load correction (LC) module has been developed to restore problems in the data and prepare the input for the load forecasting functions. Data restoring covers cases of erroneous and missing data values due to SCADA and communication problems (i.e. interruption of links to power stations) and also major power cuts and blackouts. Normal variability of the load or minor power cuts are not considered. The LC-module also reconstructs historic input when this is not available (i.e. for several days); this enables the software to be operational after a period of stoppage, or when load data are missing for long periods.
The LC-module integrates several generic rules for on-line error detection. It then restores problematic data based on a number of correction rules. Thresholds for these rules are controllable from the database. This type of preprocessing was found to considerably improve the on-line performance of the load forecasting models.
B. Implemented models.
Several methods have been developed and integrated in the LF-module of More-Care for on-line operation:
{LF-1} “Robust” forecasting (EMP/Armines).
A simple algorithm is implemented based on the load value from the same time of the previous day or the same day of previous week, scaled by a factor depending on the load variation between the two days or weeks. This is a robust approach that is used as a base-line one.
{LF-2} Fuzzy neural network model (EMP/Armines).
A adaptive fuzzy-neural network model with Gaussian fuzzy sets in the premises and ARX functions in the consequent part of the rules is developed. The model receives past load values to produce short and long-term forecasts. The model parameters are auto-adapted as new data arrive. By this way, the model compensates for the lack of information that affects load, but is not available on-line (i.e. temperature)
{LF-3} ARMA model (RAL).
The ARMA forecast uses a second order linear autoregressive model with one moving average parameter. Past load data is used to detrend the load time series used for each forecast by removing the weekly mean and diurnal variation before applying the ARMA model.
C. Evaluation.
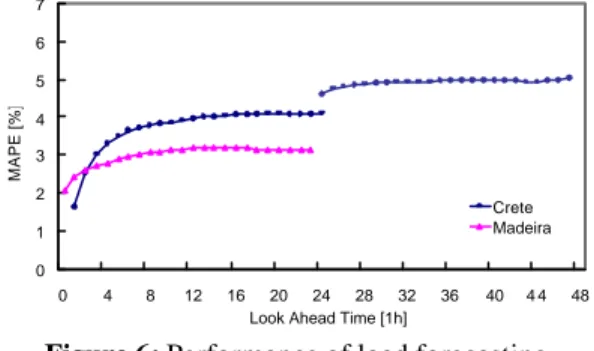
The parameters of the above models have been estimated for the cases of Crete and Madeira using historical data of several years. The performance was then evaluated on an independent set of data. Figure 6 shows the performance for the case of Crete using the LF-2 model. The performance for Crete is between 1.6-4.1 % (average: 3.72%) for 1-24 steps ahead and 4.6-5.0 % (average: 4.91%) for 25-48 steps ahead. For the case of Madeira the error is 2.0-3.1% (average: 2.9%) for 1-24 hours ahead. Currently, the operation of the modules is evaluated on-line. 0 1 2 3 4 5 6 7 0 4 8 12 16 20 24 28 32 36 40 4 4 48
Look Ahead Time [1h]
MAPE [%]
Crete Madeira
Figure 6: Performance of load forecasting.
D. Load Forecasts per bus-bar – “Load-Distribution” module. ARMINES developed an on-line module for generating forecasts of the load at each bus-bar based on the forecasts of the total power system load. The algorithm accounts for the characteristics of each bus-bar and the recent history of load distribution in the power system. Such forecasts are used within MORE-CARE by an Optimal Power Flow function of the ED module.
IV. HYDRO FORECASTING.
The hydrological forecasting aspects of this project were to develop accurate, robust and consistent forecasting procedures that can be applied under general stream-flow and meteorological conditions. Unfortunately most hydrological processes take place predominantly underground and can neither be seen nor measured. In addition the physical properties of the ground vary considerably and depend in a highly non-linear and time dependent way on the prevailing environmental processes.
As such, the modeling and forecasting of hydrological processes is, in general, very difficult. Two complimentary approaches to hydrological forecasting were adopted, one being hydrograph fitting and the other time series analysis - with both traditional and novel approaches being used. The accuracy, stability and robustness of the forecasting methods was assessed through a series of comprehensive trials. Each trial involving an out-of-sample forecast of measured field data from Madeira. These trials not only established the accuracy of the current forecasting procedures but also indicated appropriate ways to improve the instrumentation, calibration and operational procedures for the measured variables to improve the forecast quality.
The program of work within MORE-CARE project had four types of output. Firstly, the forecasting methods of this project shall be available to the community so that they can quickly and accurately forecast river-flow rates. Secondly, novel non-linear time series analysis methods offer the potential of an improvement in forecasting performance. Thirdly, investigations undertaken during the project have improved our understanding of aspects of the dynamic, non-linear, time dependent behavior between river-flow and rainfall. Finally, the investigations into the soil-moisture dependence of river-flow rate identified that the experimental design for measuring hydrological processes can be improved significantly.
The main achievements of the hydrological forecasting aspects of this project are:
1. A hydrograph forecasting methodology, based on the Nash hydrograph, has been developed and implemented in the MORE-CARE system to provide an out-of-sample forecast for two weeks into the future. The Figure 7 shows the accuracy of the Nash hydrograph forecasting approach using Madeira river-flow data.
2. A vector linear auto-regressive analysis and forecasting method has been developed and implemented in the MORE-CARE system to provide an out-of-sample forecast for twelve hours into the future.
3. In addition to the modest amount of high frequency (hourly) data from Madeira provided by the collaboration, appropriate data for the validation and verification of the hydrology forecasting methods have been obtained from UK and US sources.
4. A novel vector linear transfer function analysis and forecasting method, based on the moment hierarchy approach to time series analysis, is in the final stages of
development and is soon to be implemented in the MORE -CARE system.
5. Recognizing the non-linear and time-dependent nature of the river-flow/rain-fall problem, a novel non-linear transfer function method is implemented and tested during the latter stages of this project with the findings being included in the final project report. Two theoretical studies have been undertaken, both based on the Volterra functional expansion, one on the classical representation of the non-linear response and the other on the functional dependence of the response functions to external factors (such as soil moisture).
Rabacal forecast comparative difference probability distribution α=100.0 * (yforecast(t+τ)-y(t+τ)) / (ypersistence(t+τ)-y(t+τ))
α % -175 -150 -125 -100 -75 -50 -25 0 25 50 75
probability integrated over delay No.
0.00 0.05 0.10 0.15 0.20 α=100 α>0 α =0 α<0
perfect Nash+dynamic persistence persistence is better is better
Figure 7 A summary statistic for the multiple Nash peak and dynamic
forecasting procedure: Integrated (over delay) probability for the Nash forecasts compared to persistence forecast values with the mean improvement being approximately 25%.
V. WIND POWER FORECASTING.
The purpose of the Wind Power Forecasting (WPF) module is to provide forecasts for the total power output of each wind farm connected to the power system as well as the corresponding confidence intervals . The main state-of-the art approaches for WPF are based either on statistical or on physical modeling. Here, the statistical, or time-series approach is followed to develop short and long-term models.
“Short-term” is given a slightly different meaning in wind forecasting. It is associated with models aiming to predict wind power based only on past measured d ata available from the SCADA system. The aim of such models is to capture temporal correlations and use them to predict the future. Such models are found to outperform persistence and often several long-term models up to 6 hours. However, if one extends to longer horizons, then history is not sufficient to predict the future. One has to consider Numerical Weather Predictions (NWP) as input to the model. The models developed in this project were configured to operate with input from two NWP systems: SKIRON for the case of Crete and HIRLAM for Ireland. Forecasts from SKIRON were given for a grid of 15x15 km around 5 wind farms in Crete at 10 m. Forecasts from HIRLAM were given for 11 wind farms in Ireland at the wind farm site and for 4 model Levels.
Following the production of forecasts by short and long-term models, a combination of the two types of forecasts is performed to obtain an optimal performance over the whole horizon of 48 hours.
A. Implemented methods.
The following methods have been developed b y the partners:
{WF-1} Persistence/Naives/Direct (EMP/ARMINES).
Persistence or Naïve predictors use the most recent value or moving averages of wind power as forecast for the entire planning horizon. “Direct” prediction is a simple robust approach that converts NWPs from 10 m to the hub height. These methods were implemented in a base-line module taking into account future availability of the machines.
{WF-2} Wind Power Forec. Module A (EMP/ARMINES).
ARMINES has developed a wind power forecasting module integrating short and long-term models.
Short-term: adaptive fuzzy neural networks (F-NN) were found to outperform other types of models like ARMA, neural networks, wavelet networks etc. A short-term module was developed based on F-NNs with wind power as input and/or wind speed or direction. F-NN models were found to outperform persistence up to 20% for the first 6 hours.
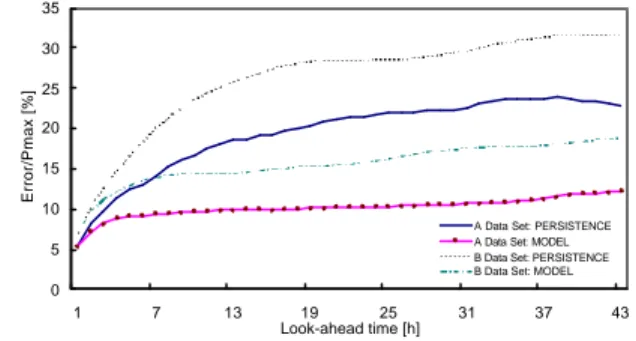
Long-term: An adaptive F-NN was developed for this task. Adaptivity permits on-line compensation for changes in the environment like addition of wind turbines etc. The artificial intelligence model permits the easy use of various types of explanatory input to optimize results. The model converts directly input to wind park power without intermediate steps. It receives both SCADA data and generic Numerical Weather Predictions as input. The model was configured to operate with the HIRLAM and SKIRON meteorological systems for the cases of Crete and Ireland respectively. The long-term module was found to outperform persistence up to 60% for 48 hours ahead. Figure 8 shows representative results for a wind farm in Ireland for two data sets of 3 months each covering the period 11/2001-03/2002.
0 5 10 15 20 25 30 35 1 7 13 19 25 31 37 43 Look-ahead time [h] Error/Pmax [%]
A Data Set: PERSISTENCE A Data Set: MODEL B Data Set: PERSISTENCE B Data Set: MODEL
Figure 8: Performance of WF-2 model for a wind farm in Ireland.
{WF-3} Wind Power Forecasting Module B (RAL).
The RAL Meteo software module has been designed to operate either as part of the MORE-CARE software suite or in stand-alone mode (for which purpose a user-friendly man-machine interface has been developed). Wind power forecasts are produced on both fast (e.g. 15 minute intervals up to 8 hours ahead) and slow (e.g. 1 hour intervals up to 48 or 72 hours ahead) cycles. The slow forecast is based on input meteorological wind speed forecast, downloaded over the Internet from a Met Office forecast. This is error-checked, scaled appropriately to hub-height, then converted to wind
power by applying a filter initially based on the manufacturer's power curve. At the same time, wind power production data is collected from the wind farm via the wind farm's own Scada system and used to assess the errors in the wind power forecasts. Once sufficient operational data has been obtained, much improved wind power predictions can be obtained by deriving a new filter based on the historic forecast wind speed and measured wind power data. More sophisticated filters are being developed for the case where wind speed and direction are also measured at the wind farm.
{WF-4} Wind Power Forecasting C (AUTh).
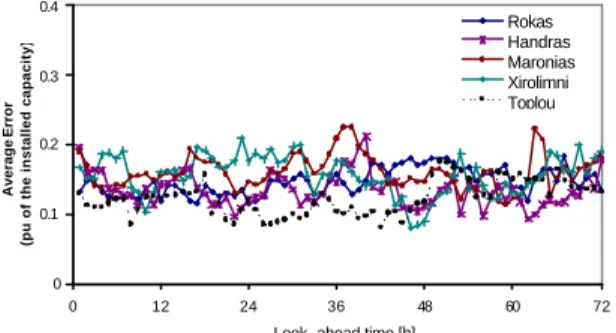
Short-term module: AUTh tested various Artificial Neural Network Models that used as inputs the most recent values of wind speed or/and wind power. Since, power values are mostly correlated to the forecasted output, wind speed inputs may be omitted without affecting the model efficiency. Forecasts are as good as persistent or slightly better. Since the power series are not stationary, the removal of moving average is suggested as a safe method to bypass rogue errors, shorten the training procedure and improve forecasts. Long-Term Module (up to 72 hours ahead). AUTh developed neural network models based on meteo. information i.e. from the SKIRON system. These models can also utilize various numerical values as input, eg. forecasting time lag, binary codes for special cases etc. The error of the model does not significantly grow with time lag, as persistent error does.
0 0.1 0.2 0.3 0.4 0 12 24 36 48 60 72
Look- ahead time [h]
Average Error
(pu of the installed capacity)
Rokas Handras Maronias Xirolimni Toplou
Figure 9: Performance of neural networks for 5 wind farms in Crete.
VI. CONCLUSIONS
The More-Care project [5] permitted to explore different approaches for load, hydro, and wind power forecasting. The most efficient ones were implemented in on-line modules and integrated into the More -Care EMS software. The software is installed and is under on-line evaluation at the islands of Crete and Madeira, while a stand-alone wind forecasting application is running in Ireland.
REFERENCES
[1] “Load and Wind Power Forecasting Methods for the Optimal Management of Isolated Power Systems with High Wind Penetration”, A.G. Dutton, G. Kariniotakis, J.A. Halliday, E. Nogaret, Wind Engineering, Vol. 23, No 2, 2000.
[2] The ‘CARE’ System Overview: Advanced Control Advice for Power Systems with Large -scale Integration of Renewable Energy Sources”, N. Hatziargyriou et al, Wind Engineering, Vol. 23, No 2, 2000.
[3] “Wind power forecasting using advanced neural network models”, Kariniotakis G., Stavrakakis G.S. Nogaret E.F., IEEE Trans. on
Energy Conversion, Vol. 11, No. 4, December 1996, pp. 762-767. [4] Kariniotakis G., Nogaret E., Dutton A., Halliday J. Androutsos A.,
"Evaluation of advanced wind power and load forecasting methods for the optimal management of isolated power systems.” European Wind Energy Conference EWEC'99, Nice, France, March 1999. [5] http://www-cenerg.cma.fr/more-care
ACKNOWLEDGEMENT
This work has been performed in the frame of the MORE-CARE project (ERK5-CT1999-00019) supported by the European Union.
BIOGRAPHIES
George N. Kariniotakis was born in Athens, Greece in 1967. He received his degree in
production and management engineering and MSc degree in electronic & computer engineering from the Technical University of Crete, Greece, in 1990 and 1992 respectively. He received his PhD degree (with mention “félicitations du jury”) from Ecole des Mines de Paris in 1996. Currently he is with the Center of Energy Studies of Ecole des Mines de Paris as a scientific project manager. He is a member of IEEE.
Didier Mayer is Professor at Ecole des Mines de Paris. He is Deputy Director of the
Centre d’Energetique of Ecole des Mines de Paris, Head of the Sophia Antipolis laboratory. He is coordinator of the research activities in Renewable Energies field: Expert in the IEA PVPS Programme (PV Systems) Task II on Operational Performance of PV systems. He is EUREC Agency Bureau Member, in charge of the Integration of RE in networks.
James A. Halliday was born in Devon, England in 1956. He graduated with B.Sc. (Hons)
degree in Environmental Sciences from the University of East Anglia in 1977. He joined the Energy Research Unit (ERU) of the CLRC Rutherford Appleton Laboratory in 1980, and became its Head in 1992. He was awarded a PhD by the University of Strathclyde in 1988. He is a past Chairman of the British Wind Energy Assoc., a long-standing Board member of the EUREC agency, serves on the editorial board of the journal ‘Wind Engineering’, and has published over 70 papers.
Geoff Dutton was born in Stockport, UK in 1961. He received a B.Sc. degree in
Engineering Science from the University of Durham in 1984 and a Ph.D. degree from the University of Liverpool in 1989. He has worked in the Energy Research Unit (ERU) of CLRC Rutherford Appleton Laboratory, UK since 1989 as a research scientist, including as research manager of the ERU Test Site since 1993.
Andrew D. Irving was born in Birkenhead, England, in 1951. He received the B.Sc. (Hons)
in Physics and the Ph.D. degree in nuclear physics from the University of Liverpool in 1976 and 1980 respectively. He worked in the Dept. of Physics at Liverpool until 1982 when he was employed by the CLRC Rutherford Appleton Laboratory to investigate renewable energy phenomena. Since 1982 he has been involved with many research projects in renewable energy and non-linear time series analysis and has worked as a consultant to the financial institution Robert Flemming Co. Ltd.
Richard Brownsword studied natural science at the University of Oxford, UK, receiving
his B.A. and D.Phil degrees in 1989 and 1993. He has since worked on modeling of chemical reaction systems at the Universities of Birmingham (UK) and Heidelberg (Germany). In 1998 he joined the Energy Research Unit at the CLRC Rutherford Appleton Laboratory (UK) working on sustainable use of energy and renewable energy system modeling.
Petros Dokopoulos (M’ 77) was born in Athens, Greece, in 1939. He received the Dipl.
Eng. degree from the Technical University of Athens in 1962 and the Ph.D. degree from the University of Brunswick, Germany, in 1967. He was with the Laboratory for High Voltage and Transmission at the University of Brunswick, Germany (‘62-‘67), with the Nuclear Research Center at Julich, Germany (‘67-‘74), and with the Joint European Torus (‘74 –‘78). Since 1978 he has been full professor at the Dept. of Electrical Engineering at the Aristotle Univ. of Thessaloniki, Greece. He has worked as consultant to several companies and organizations.
Minas C. Alexiadis was born in Thessaloniki in July 1969. He received the Dipl. Eng.
Degree from the Department of Electrical Engineering at the Aristotle University of Thessaloniki, Greece in 1994. He is now a Ph.D. student with the same University. His research fields are renewable energy sources and artificial intelligence applications in power systems