The vacuum UV photoabsorption spectroscopy of vinyl fluoride (C
2H
3F):
The vibrational fine structure and its analysis
R. Locht a, B. Leyh a, D. Dehareng b, H.W. Jochims c, H. Baumgärtel c
a
Laboratoire de Dynamique Moléculaire, Département de Chimie, Institut de Chimie, Bât.B6c, Université de Liège, Sart-Tilman par B-4000 Liège 1, Belgium
b
Centre d'Ingéniérie des Protéines, Institut de Chimie, Bât.B6a, Université de Liège, Sart-Tilman par B-4000 Liège 1, Belgium c
Institut für Physikalische und Theoretische Chemie, Freie Universität Berlin, Takustraβe 3, D-14195 Berlin, Germany
Abstract
The vacuum UV photoabsorption spectrum of C2H3F has been examined in detail between 6 eV and 25
eV photon energy by using synchrotron radiation. The analysis of the data is supported by ab initio quantum mechanical calculations applied to valence and Rydberg excited states of C2H3F. At 7.6 eV the π → π* and the
2a" → 3s transitions are observed. An analysis is proposed and applied to the mixed fine structure belonging to these transitions. For the π → π* transition one single long vibrational progression is observed with hcω
e = 95 ±
7 meV (766 ± 56 cm-1) and its adiabatic excitation energy is 6.892 eV (55 588 cm-1). The 2a" → 3s transition is
characterized by a single short progression with hcωe = 167 ± 10 meV (1350 ± 80 cm-1) starting at 6.974 eV (56
249 cm-1). From the present ab initio calculations these two wavenumbers best correspond to the vibrational
modes υ9 (CH2 rock in-plane, FCC-bend) and υ6 (CH2 rock in-plane, CF stretch) calculated at 615 cm-1 in the π*
state and 1315 cm-1
in the (2A")3s Rydberg state respectively. The C=C stretching could not be excluded. The dense structured spectrum observed between 8.0 eV and 10.5 eV has been analyzed in terms of vibronic transitions to Rydberg states all converging to the C2H3F+(XA") ionic ground state. An analysis of the associated
complex fine structure of the individual Rydberg states has been attempted providing average values of the wavenumbers, e.g., for the (2A")3p Rydberg state hcω
9 = 60 ± 1 meV (or 484 ± 8 cm-1), hcω7 = 151 ± 7 meV (or
1218 ± 60 cm-1), hcω
4 = 191 ± 3 meV (or 1540 ± 24 cm-1). The assignment of hcω = 105 ± 5 meV (or 823 ± 40
cm-1) is discussed. These experimental values are in good agreement with the theoretical predictions for C 2H3F+
[R. Locht, B. Leyh, D. Dehareng, K. Hottmann, H. Baumgärtel, Chem. Phys. (in press)]. Above 10.5 eV and up to 25 eV several broad and strong bands are tentatively assigned to transitions to valence (V-V) and/or Rydberg (V-R) states converging to excited ionic states of C2H3F.
Keywords : VUV photoabsorption ; synchrotron radiation ; ab initio calculations ; Rydberg states ; valence excited states ; vibrational analysis
1. Introduction
In previous investigations the combined use of vacuum UV photoabsorption (VUV-PAS), He(I) (PES), threshold (TPES), constant ion state (CIS) photoelectron spectroscopies, photoionization mass spectrometry (PIMS) and photoion translational energy spectroscopy allowed us to get a deeper insight into the various aspects of the dissociation dynamics of molecular ions. Parallel to these experimental techniques ab initio quantum mechanical calculations were applied. In the recent past, we thoroughly investigated several molecular systems, e.g. the monohalogenated derivatives of methane CH3F [1-5], CH3Cl [6-8] and CH3Br [9-11].
The energy and structure of the neutral as well as the ionic ground and excited states of ethylene and its halogenated derivatives are of considerable interest for understanding the photochemistry of this extremely important class of compounds involved in many fields of chemistry. Furthermore, another and more fundamental motivation of this work is the systematic investigation of the influence of the position and nature of the substituent on the dynamics of the molecular ions. The systematic study of ethylene and of several of its halogen substituted derivatives has been initiated, e.g. for C2H3Cl [12,13], C2H3Br [14-16] and 1,1-C2H2F2 [17,18], or is
in progress using the same array of techniques. The vacuum UV spectroscopic data reported on vinyl fluoride are very scarce. To the best of our knowledge the latest detailed work devoted to this molecule has been reported by Bélanger and Sandorfy [19]. These authors analyzed the vacuum UV spectrum of the six fluoroethylenes in the 50 000-82 000 cm-1 (6.2-10.2 eV) spectral region using a 1 m normal incidence (1 m-NIM) monochromator
equipped with a 1200 l/mm grating. The observed features were classified and assigned to valence → valence (π → π*) and valence → Rydberg transitions. A vibrational analysis of the 2a" → 3p Rydberg transition was also
presented.
The valence-shell electron energy-loss spectroscopy (VSEELS) technique is closely related to vacuum UV photoabsorption spectroscopy. Sze et al. [20] reported the results obtained for the mono-halogenated ethylenes between 6 and 22 eV electron energy-loss and with about 35 meV energy resolution. Rydberg series and their vibrational analysis have been reported.
Recently, ab initio quantum mechanical calculations have been carried out on C2H3F to investigate the
excited state energy surfaces [21]. The vertical spectrum at planar geometry including 3s and 3p Rydberg states has been calculated. The existence of several conical intersections has been demonstrated for different geometries.
The aim of this paper is to report the vacuum UV photoabsorption spectrum of vinyl fluoride (i) for the first time in the 10-25 eV photon energy range at low resolution and (ii) in the 6-11 eV spectral region at high resolution. The fine structure observed in this latter region will be analyzed in detail, with the help of high level quantum chemistry calculations.
2. Experimental 2.1. Experimental setup
The experimental setup used in this work has already been described in detail elsewhere [15]. Only the most salient features will be reported here. Furthermore, two monochromators were available at the BESSY synchrotron radiation facilities.
Synchrotron radiation available from the BESSY I facility (Berlin, Germany) was dispersed with a modified vacuum UV normal incidence 225 McPherson monochromator with a focal length of 1.5 m, instead of 1 m in the commercial version (1 m-NIM-2 beamline). A laminar Zeiss grating is used for the efficient reduction of the 2nd spectral order. It is gold coated with 1200 l/mm and its transmission breaks down above 26 eV (210 000 cm-1 or 48 nm). The width of the entrance and exit slits of 100 µm ensures a 0.1 nm wavelength resolution
corresponding to a resolving power of about 1200 at 10 eV. This monochromator has been used for the recording of low-resolution absolute photoabsorption spectra in the 5-25 eV photon energy range.
The 3 m-NIM-2 beamline at the BESSY II facility (Berlin, Germany) has been described by Reichardt et al. [22]. This 3 m-NIM monochromator is positioned at a bending magnet frontend. It is equipped with two spherical gratings, i.e., an Al/MgF2-grating of 600 l/mm and a Pt-grating of 2400 l/mm allowing to cover the
5-55 eV photon energy range. The latter grating has its optimal transmission between 10 and 40 eV (124-31 nm). The entrance and exit slits were adjusted between 10 and 40 µm leading to a resolving power of about 25 000 to 13 000 at 10 eV (124 nm) photon energy. This monochromator was used for recording high resolution spectra. Most of the spectra discussed in the present work were measured with 40 µm entrance and 10 µm exit slits and using the 600 l/mm Al/MgF2-grating.
In all above described setups, the light has to pass, at the exit slit of the monochromator, through a 1 mm thick stainless steel microchannel plate necessary to maintain a differential pressure of 1:1000 before entering a 30 cm long stainless steel absorption cell. Most spectra are recorded without filter on the light path. However, in some cases, a LiF filter (cutoff at 11.8 eV or 95 000 cm-1 or 105 nm) is used, which can be inserted
in the light beam without vacuum breakdown. The vapor pressure in the cell is measured by a Balzers capacitor manometer. The light is detected by a sodium salicylate sensitized photomultiplier located at the end of the absorption cell and in front of the absorption cell entrance slit. Output pulses are recorded by a 100 MHz counter. The recording of an absorption spectrum requires one scan with gas in the absorption cell and one with the evacuated cell. The stability of the synchrotron radiation and of the pressure in the cell ensured reliable absorption data. If necessary, the spectra presented in the following sections are corrected for any pressure drift. The sample pressure has been maintained at 25-30 µbar to avoid saturation. The commercially available C2H3F,
purchased from Fluochem Ltd and of 99.5% purity, was used without further purification. 2.2. Data handling and error estimation
superimposed on a strong continuum. To make the characterization of these features easier a continuum subtraction procedure has been applied. This method has already been used successfully in previous spectral analyses [5,23]. For this purpose, the experimental curve is severely smoothed to simulate the underlying continuum which is then subtracted from the original photoabsorption spectrum. The smoothing procedure consists in filtering the experimental curve by fast Fourier transform (FFT). The weak features emerge from a remaining strongly attenuated background. The resulting diagram will be called ∆-plot in the forthcoming sections.
The wavelength calibration of the 1.5 m-NIM monochromator has been performed by using the Ar+
absorption spectrum between the 2P
3/2 and the 2P1/2ionic states. The accuracy of this calibration is better than 2
meV In the measurements between l0eV and 25 eV photon energy, the photoabsorption spectrum has been recorded with an energy interval of about 4 meV. The error on the energy position of a feature is estimated to be 6 meV. In the photoabsorption spectra between 6 eV and 11 eV, an energy increment of 1 meV has been adopted. The error on the energy position of a feature is estimated to be of the order of 2 meV. This evaluation is confirmed by the reproducibility of energy positions measured in different spectra recorded over several years. 3. Experimental results
The good control of the experimental parameters allows us to display the spectra in terms of the molecular extinction coefficient εhv as a function of the photon energy (eV). (i) Fig. 1a displays the
low-resolution PAS measured with 4 meV increments between 10 eV and 25 eV photon energy. Above 22 eV the transmission of the grating rapidly decreases resulting in a rapid degradation of the signal-to-noise ratio. Fig. 1b shows the ∆-plot used to enhance the weak structures present in the original spectrum. It is obtained by the subtraction procedure described in Section 2.2.
The most salient features are marked by vertical bars and their position in energy are listed in Table 1. It has to be emphasized that the high-energy features observed between 10 eV and 20 eV in this PAS are by far stronger than in the PAS of C2H3Br [14]. Fig. lb shows that several bands are superimposed by a fine
structure, e.g. in the 10.476-14.185 eV energy range.
(ii) Fig. 2a displays the high-resolution photoabsorption spectrum as observed between 6.0 eV and 10.5 eV and recorded with 1 meV photon energy increments. Fig. 2b shows the ∆-plot obtained by the subtraction procedure. Numerous sharp structures are thus obtained superimposed on a strongly weakened background. The vibrationless transitions corresponding to the Rydberg excitations are marked by vertical bars. The energy positions of the Rydberg transitions are listed in Table 2 together with their quantum defects and convergence limits.
Beside these transitions, numerous weaker peaks are observed. Their interpretation and assignment will be discussed in the next section.
4. Ab initio calculations methods and results 4.1. Computational tools
The basis set is aug-cc-pVTZ [25,26], i.e., a valence triple zeta basis set with polarization and diffuse functions. All the calculations were performed at two levels. The first level is CASSCF [27-29] with eight active orbitals, i.e., 5a', 6a', 7a', 2a", 8a', 9a', 10a', 3a" and eight electrons, noted CAS(8,8). The molecular orbitals are averaged over all the considered excited states (state-average option). The second level is a CIS [30] calculation, i.e., configuration interaction involving single electronic excitations. These methods are very different and they both only provide qualitative results for excited state properties. The calculations of the wavenumbers associated with the vibrational normal modes were carried out with the GAUSSIAN 03 program [31].
4.2. Results of the calculations
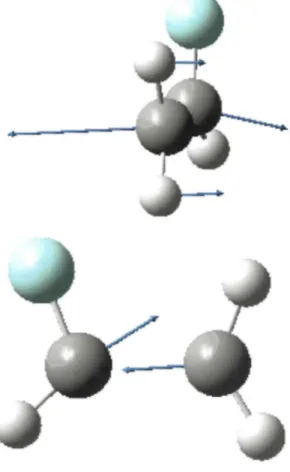
For all the excited states calculated at the ground state geometry, the force components on the nuclei in the Franck-Condon region are very similar and illustrated in Fig. 3. They are confirmed by the geometry changes listed in Table 3 and corresponding essentially to the C=C bond lengthening and the C-F bond shortening. No hydrogen atom motion is involved. On the basis of the scheme of the vibrational normal modes determined for
all the excited states this particular motion does not correspond to any nor- mal mode since most of these involve the motion of the hydrogen atoms. Therefore, the motion resulting from these forces must be a combination of several normal modes.
Fig. 1. The VUV photoabsorption spectrum of C2H3F between 10 eV and 25 eV photon energy: (a) the molecular
extinction coefficient εhv and (b) the ∆-plot as a function of the photon energy (eV). Vertical bars indicate critical
energy positions and shaded area show the successive ionization energies of C2H3F.
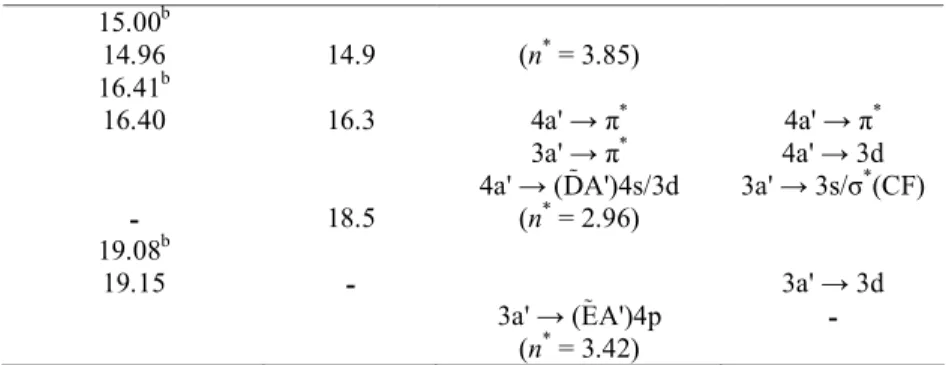
Table 1. The energy position (eV) and assignments of the most salient features in The photoabsorption spectrum of C2H3F in the 6 eV to 25 eV photon energy range. Comparison is made with the literature [20].
Energy position (eV) Assignments
This work Ref. [20]a This work Ref. [20]
7.60b 7.6 2a" → π* 2a" → π*
2a" → (XA")3s 2a" → 3s (n* = 2.004) 9.02b Rydb. 9.84b 11.00b 7a' → σ* 7a' → π* 10.94 10.9 7a' → π* 7a' → (ÃA')3s (n* = 2.19) 11.33 11.4 6a' → π* 7a' → 3p
6a' → (BA')3s 6a' → 3s/σ*(CF)
(n* = 2.05) 12.65b
12.49 12.5 7a' → (ÃA')3p 7a' → 4s
(n* = 2.58) 5a' → 3s/σ*(CF)
12.91 12.9 5a',1a" → σ* 6a' → 3d
5a',1a" → (B2A')3d 1a" → 3s/σ*(CF)
(n* = 2.88)
13.63b
- 5a',1a" → π* -
15.00b
14.96 14.9 (n* = 3.85)
16.41b
16.40 16.3 4a' → π* 4a' → π*
3a' → π* 4a' → 3d
4a' → (DA')4s/3d 3a' → 3s/σ*(CF)
- 18.5 (n* = 2.96)
19.08b
19.15 - 3a' → 3d
3a' → (EA')4p -
(n* = 3.42)
Fig. 2. The VUV photoabsorption spectrum of C2H3F between 6 eV and 10.5 eV photon energy: (a) the
molecular extinction coefficient εhv and (b) the ∆-plot as a function of the photon energy (eV). Vertical bars show
Table 2. Energy position (eV/cm-1) and effective quantum number characterizing the (0-0) transitions to Rydberg states as observed in the photoabsorption spectrum of C2H3F and comparison with literature experimental data.
Conversion factor 1 eV = 8065.545 cm-1 [24].
This work Ref. [19] Ref. [20]
Energy Energy Energy
eV cm-1
n* cm-1 eV
1. 2a" → ns Rydberg transitions
6.974 56 249 2.004 56 290 6.998 8.838 71 283 2.987 71 398 8.854 4s/3d 9.502 76 639 3.975 76 746 9.509 4d 9.815 79 163 5.001 79 114 9.822 5p 9.987 80 551 6.015 80 451 9.993 6s/5d 10.084 81 333 6.983 81 301 10.151 81 873 8.011 81 853 - - - 82 237 10.180 7a' → 3s (10.224)a 82 462 9.893 (10.248)a 82 656 10.877 [10.268]b 82 817 11.967
2. 2a" → np Rydberg transitions
8.079 65 162 2.441 65 253 8.090 9.219 74 356 3.448 74 477 9.353 9.674 78 026 4.443 78 309 9.822 9.898/9.912 79 833/79 946 5.409/5.492 80 064 9.822 10.026 80 865 6.354 80 064 - [10.115]b 81 583 7.256 81 037 - 10.170 82 027 8.396 10.180 7a' → 3s 10.208 82 333 9.369 10.238 82 575 10.433 [10.255]b 82 712 11.224 10.275 82 873 12.434 10.289 82 986 13.559 10.299 83 067 14.580 10.306 83 123 15.450 10.314 83 188 16.663
3. 2a" → nd Rydberg transitions
8.756 70 622 2.910 69 266 8.776 9.481 76 469 3.927 76 628 9.509 9.796 79 010 4.898 79 114 9.979 80 486 5.952 80 451 9.993 10.075 81 260 6.873 81 301 [10.148]b 81 849 7.955 [10.191]b 82 196 8.894 (10.224)a 82 462 9.893 (10.248)a 82 656 10.877 10.265 82 793 11.782 10.281 82 922 12.881 10.291 83 003 13.746 10.302 83 091 14.935 10.309 83 148 15.873 a
Values with several possible assignments. b
Values corresponding to shoulders.
The results of the calculations of the wavenumbers characterizing each vibrational normal mode in the excited states have been performed at both the CIS and the CAS levels and are presented in Table 4. Even though the results are qualitatively similar, the two methods provide fairly large differences for the high and the low wavenumbers related to both the a' and a" motions. This points out the qualitative character of the two calculation methods. As shown in Table 4, at the CAS(8,8) level, the 3p-Rydberg state should be a transition
state evolving toward a non-planar geometry. Similarly the π* state in the C
s point group is not a minimum. The
order of the stationary point as obtained by the two calculation methods is not the same. However, in both cases this state must evolve toward a non-planar geometry minimum. As already pointed out by Barbati et al. [21], it was not possible to obtain a non-planar equilibrium geometry minimum: this state is nonadia-batically coupled with the ground state through the torsion mode (υ12)· Owing to this coupling the optimization process is
continuously oscillating along the torsion angle φ.
Since the excited π* state minimum is so low in energy compared to the ground state it has to cross the
first excited 3s-Rydberg state. Several attempts to localize the conical intersection between the π* and the 3s
states were unsuccessful but the two coordinates that induce the transition (illustrated in Fig. 4) can explain the vibrational evolution to be experienced by the two states. The first coordinate distorts the geometry of the molecule from its planar structure. This is usually the case for conical intersections where symmetry breaking is the rule in order to allow mixing of two coupled electronic states. The second coordinate that induces the transition is the C=C stretching mode. Consequently, all the vibrational normal modes containing an important component on the C=C stretching coordinate are expected to induce the depopulation of the π* and 3s states.
5. Discussion of the experimental data
We remind that the molecular orbital configuration of C2H3F is described in the Cs symmetry group by
The a" orbitals have a π character. The 2a" is a C=C bonding orbital whereas the 1a" is a C-F bonding orbital. All na' orbitals have a σ character.
A few experimental works reported the HeI- and HeII-photo-electron (PES) spectroscopy of C2H3F
[20,32-35]. We measured recently the high resolution HeI- and threshold photoelectron spectra of the same system [36] and the results will be reported in a forthcoming paper. The first adiabatic ionization energy IEad(XA") is equal to 10.363 ± 0.004 eV. The corresponding vertical value IEvert (XA") is equal to 10.558 ±
0.004 eV. These values are in very good agreement with earlier determinations at 10.37 eV and 10.58 eV [33,34] and 10.57 eV [20].
At higher energies several bands are observed and are characterized by their maxima at 13.79 eV, 14.53 eV, 16.73 eV, 17.95 eV and 20.27 eV successively [36]. In the TPES measured between 10 eV and 30 eV several maxima are observed at energies above the 21.21 eV limit [36]. Lake and Thompson [32] reported maxima at 13.79 eV, 14.51 eV, 16.77 eV and 17.97 eV respectively. In their HeII-PES Bieri et al. [34] measured band maxima at 20.2 eV and 24.5 eV.
Fig. 3. Illustration of the forces undergone by the nuclei in the excited states at the geometry of the ground state as considered in this work.
Several theoretical calculations were applied to C2H3F and its molecular ion [33-35,37] and the above
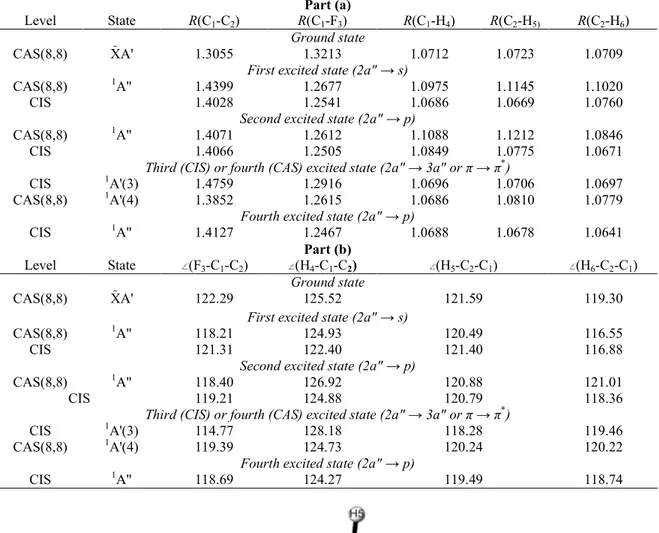
Table 3. Optimized geometries of the ground and excited states of C2H3F at two calculation levels: (a)
internuclear distances (A) and (b) bond angles (°).
Part (a)
Level State R(C1-C2) R(C1-F3) R(C1-H4) R(C2-H5) R(C2-H6)
Ground state
CAS(8,8) XA' 1.3055 1.3213 1.0712 1.0723 1.0709
First excited state (2a" → s)
CAS(8,8) 1A" 1.4399 1.2677 1.0975 1.1145 1.1020
CIS 1.4028 1.2541 1.0686 1.0669 1.0760
Second excited state (2a" → p)
CAS(8,8) 1A" 1.4071 1.2612 1.1088 1.1212 1.0846
CIS 1.4066 1.2505 1.0849 1.0775 1.0671
Third (CIS) or fourth (CAS) excited state (2a" → 3a" or π → π*)
CIS 1A'(3) 1.4759 1.2916 1.0696 1.0706 1.0697
CAS(8,8) 1A'(4) 1.3852 1.2615 1.0686 1.0810 1.0779
Fourth excited state (2a" → p)
CIS 1A" 1.4127 1.2467 1.0688 1.0678 1.0641
Part (b)
Level State (F3-C1-C2) (H4-C1-C2) (H5-C2-C1) (H6-C2-C1)
Ground state
CAS(8,8) XA' 122.29 125.52 121.59 119.30
First excited state (2a" → s)
CAS(8,8) 1A" 118.21 124.93 120.49 116.55
CIS 121.31 122.40 121.40 116.88
Second excited state (2a" → p)
CAS(8,8) 1A" 118.40 126.92 120.88 121.01
CIS 119.21 124.88 120.79 118.36
Third (CIS) or fourth (CAS) excited state (2a" → 3a" or π → π*)
CIS 1A'(3) 114.77 128.18 118.28 119.46
CAS(8,8) 1A'(4) 119.39 124.73 120.24 120.22
Fourth excited state (2a" → p)
CIS 1A" 118.69 124.27 119.49 118.74
Table 4. Vibrational wavenumbers (cm-1 ) of the s, p and π* excited states of C2H3F calculated at the CAS(8,8)
and CIS levels. The line in bold italic corresponds to the normal mode that looks most alike the forces in the Franck-Condon region.
2a" → s 2a" → p 2a" → 3a" or π → π*
Modea
CAS CIS CAS CIS CAS CIS
υ1 3304 3452 3305 3455 3381b 3457 υ2 3292 3383 2956 3172 3397b 3403 υ3 3113 3221 2818 3120 3267 3324 v4 1655 1722 1677 1681 1775 1544 υ5 1514 1560 1506 1570 1605 1480 υ6 1389 1428 1365 1410 1469 1327 υ7 1252 1326 1219 1276 1376 1161 υ8 1021 1046 1055 1059 1131 940 υ9 483 491 547 518 615 457 υ10 1108 1107 1167 2379 1031b 679 υ11 923 964 1137 1122 1087b i570
υ12 476 443 i764 549 i1057 i1045
a
Classification of normal modes by symmetry a' and a" and by wavenumbers in decreasing order. b
Fig. 4. The two coordinates involved in the transition to the conical intersection. For explanation, see text.
5.1. The valence-to-valence transitions
The overall appearance of the PAS of C2H3F shows the superposition of an abundant series of narrow
structures (FWHM ≈ 40 meV or 10 meV) (highlighted in Figs. 1b and 2b) on several comparatively very broad bands (FWHM ≈ 1 eV). To determine the maxima of the broad structures in a less arbitrary way, a strong FFT smoothing has been applied to the signal shown in Figs, 1a and 2a. This procedure leads to a spectrum displaying several continua with maxima at 7.60 eV, 9.02 eV, 9.84 eV, 11.0 eV, 12.65 eV and 13.63 eV (see Table 1). At higher energies the maxima of the smoothed and original spectra nearly coincide, i.e., with maxima at 15.0 eV, 16.4 eV and 19.1 eV successively.
A very unusual discrepancy is observed for the relative intensities as observed by photoabsorption and electron energy-loss. The intensity ratio R between the maxima at 16.4 eV and 7.6 eV is about 0.7 as measured by the latter technique (see Fig. 4 in Ref. [20]). In the present photoabsorption work the same ratio is R = 1.7. The origin of this discrepancy could hardly be analyzed owing to the lack of more data for C2H3F. However,
comparing the VSEELS spectra of C2H3C1 and C2H3Br reported in the same work [20] to the photoabsorption
spectra of C2H3C1 [38] and C2H3Br [15] the same trend is observed: an overestimate of the intensity in the low
electron energy-loss range.
In any case, the usually invoked "saturation effect" ascribed to the logarithmic form of the Beer-Lambert's law could not be invoked as acting in the reverse sense. More likely, the origin of this systematic discrepancy might be the evaluation of the transmission function of the electron energy-loss analyzer.
Concerning the relative intensities in the low-energy part of the C2H3F PAS the best agreement is found
9.0 eV band is about 1.5 in the present work and R' = 2 in the PAS reported in Ref. [19]. Also in the present case a large discrepancy has to be mentioned with the VSEELS technique [20] which leads to R' ≈ 4.
Similarly to C2H4 [39] the PAS of C2H3F shows a first strong and broad band centered on a maximum at
7.6 eV (61 300 cm-1 or 163.1 nm) in good agreement with the earlier determination of Bélanger and Sandorfy
[19] at 166.5 nm (7.45 eV or 60 060 cm-1) and of Sze et al. [20] at about 7.5 eV (60 570 cm-1 or 165.1 nm). This
band is unanimously assigned to the 2a" → π* (also called π → π*) transition. As clearly shown in Fig. 5, two
distinct structures are superimposed in this band: (i) fairly strong broad peaks (FWHM ≈ 40 meV) and (ii) a sequence of weaker and broad structures. This mixture of structures is also observed in the PAS of C2H4 where a
mixing of Rydberg and valence transitions has been recognized and investigated by ab initio calculations [40]. This similarity could be helpful to disentangle the vibrational fine structure belonging to both transitions. We further assume that the equilibrium geometry of the Rydberg state is close (or nearly identical) to that of the ionic state to which it converges. To make the comparison easier the ∆-plot of the appropriate PAS energy range will be compared to the HeI-PES of the C2H3F+(XA") state as measured in our laboratory [36]. The
result is shown in Fig. 5b.
Barbatti et al. [21] calculated the energy surfaces of excited states of C2H3F but considered only the
vertical excitation region. From the present calculations (see Section 4) it was concluded that the 1A' state
resulting from the π → π* transition should be depopulated along the coordinates involving the C=C bond
stretching.
Valence(V)-Rydberg(R) mixing is expected between the π* and the 3s states. The narrowest of the
structures are already much broader (~40 meV) than the other Rydberg transitions observed in this paper (~4 meV). This observation is an argument in favour of V/R mixing. However, the two types of structures showing up in Fig. 5 differ clearly by their respective widths and intensities. We, therefore, argue that V/R mixing is in this case limited enough not to preclude a usual vibrational analysis. In other words, the expansions of the mixed states on the basis of the pure V and R states are each dominated by a leading term so that it is reasonable to speak about a "Rydberg-like" and a "Valence π*-like" state.
Therefore, we suggest on the basis of Fig. 5b that the most intense and sharpest features behave as expected for a Rydberg state. The weakest peaks look more diffuse and are tentatively assigned, at least partially, to vibrational excitation accompanying the 2a" → π* transition. Their energy positions as measured in the ∆-plot
spectrum (Fig. 5b) are listed in Table 5. This excitation seems to extend over 10 vibrational quanta for which an average hcωe = 95 ± 7 meV (766 ± 56 cm-1) is obtained. Furthermore, an adiabatic excitation value Ead(2a" →
π*) = 6.892 eV (55 588 cm-1) could be proposed. These numbers could not be compared with any previous
measurement. The present wavenumber at 766 cm-1 is qualitatively comparable with ω
9 = 615 cm-1 or with ω10
= 679 cm-1, calculated at CAS and CIS level respectively, υ9 and υ10 involving essentially CH2 rocking and CF
bending or H out-of-plane deformation but no C=C stretching. However, the υ10 vibration is of a" symmetry and
should only be allowed through vibronic coupling. The relative weakness of this progression would be a further argument for this assignment.
Above 8.0 eV photon energy several broad continua underlying sharp Rydberg series are observed. They dominate the photoabsorption spectrum particularly above 10 eV and the positions of their maxima are listed in Table 1. Furthermore, an irregular fine structure is superimposed on these continua between 11.0 eV and 14.1 eV.
Such broad bands are mostly assigned to valence-to-valence (V-V) transitions [19,20]. To support the interpretation, the vertical ionization energies of the successive valence orbitals of C2H3F as measured by
HeI-PES [36] have been displayed in an energy level diagram (Fig. 6), including also the valence excitations π → π*
at 7.6 eV and the π → σ*(C-F) assumed to be in the 6.8-7.0 eV range [20]. Between the highest occupied 2a'
orbital and the 3a" (π*) virtual orbital only a' or σ-type virtual orbitals are considered. The 1a" orbital is a
π(C-F)-type orbital.
Between 7.6 eV and 10.0 eV two maxima are observed at 9.02 eV and 9.84 eV. These bands are of low intensity. From Fig. 6 the most likely assignment of the latter maximum at 9.84 eV should be a 7a' → σ*(C-F)
transition which is expected to be at about 9.8 eV in good agreement with the observed excitation energy. Above 11.0 eV the first two maxima are measured at 11.0 eV and 12.65 eV and look both as consisting of two overlapping bands: the first pair is measured at 10.94 eV and 11.3 eV whereas the second doublet is
observed at 12.5 eV and 12.9 eV.
Fig. 5. The VUV photoabsorption spectrum (a) and the corresponding ∆-plot (b) of C2H3F on an expanded
photon energy scale between 6.9 eV and 8.0 eV and related to the 2a" → π*/3s transitions. Vertical bars locate the positions of the vibrational structures. For comparison the first band of the HeI photoelectron spectrum (HeI-PES) of C2H3F [36] is inserted.
Table 5. Energy position (eV) and tentative assignments for fine structures superimposed on the valence-to-valence transitions in the vacuum UV photoabsorption spectrum of C2H3F.
Band maximum Position
eV cm-1 Transit. type eV cm-1 Assign
6.892 55 589 v= 0 (6.99) (56 379) (υ = 1) 7.090 57 186 ν = 2 7.190 57 993 ν = 3 7.285 58 759 ν = 4 7.380 59 525 ν = 5 7.474 60 283 ν = 6 7.563 61 001 ν = 7 7.663 61 807 ν = 8 (7.74) (62 429) (υ = 9) 7.60 61 300 2a" → π* 7.841 63 243 ν = 10
Two alternative assignments could be proposed for these bands, i.e., transitions to (i) Rydberg states converging to electronic excited states of the C2H3F+ cation and/or (ii) highly excited valence states of C2H3F.
(13.77-14.54) eV. If the bands at (10.94-11.3) eV and at (12.5-12.9) eV belong to Rydberg series converging to the C2H3F+ "doublet" at 13.77-14.54 eV then their effective quantum numbers would be n* = 2.19-2.05 and
2.58-2.88 respectively. This would indicate that these bands would be 3s, 3p and 3d members of Rydberg series converging to the ÃA' and BA' states of C2H3F+ (Eq. (1) reminded in the next section is used). Alternatively,
considering the energy level diagram in Fig. 6, V-V transitions of 7a" → π* and 6a' → π* are expected at 10.8 eV
and 11.6 eV whereas a 5a' (1a") → σ*(C-F) should be observed at 12.9 eV. As already mentioned for the π → π*
and the π → 3s transitions, a Rydberg/Valence character mixing is also suspected to take place here and could possibly explain the characteristics of the observed vibrational structure (Fig. 1b). Fine structures are superimposed on the broad bands at 11.0 eV and 12.65 eV. A few of them are sharp but most are weak and diffuse making their classification difficult. However, it has to be mentioned that the ÃA' and the BA' bands in the PES of C2H3F exhibit a diffuse fine structure [36].
Fig. 6. Energy level diagram of the orbital energies - ε (eV) in C2H3F as determined by PES and the transition
energies for the electronic (V-V) transitions to the π* and the σ* states.
5.2. The Rydberg transitions
The 6-25 eV photon energy range covered in the present work is clearly divided in two parts: (i) the high-energy range spread from 10.5 eV to 25 eV made of fairly strong and broad bands with additional more or less regular fine structure (see Fig. 1) and (ii) the low-energy range extending from 6 eV to 10.5 eV consisting of an abundant strong to weak very sharp fine structure (Fig. 2).
For the assignment of some of these features the Rydberg formula (1) has been fitted to their position in energy ERyd
where the R is the Rydberg constant R = 13.60569 eV [24], δ is the quantum defect, n*
is the effective quantum number and IE is the convergence limit or ionization energy of the considered Rydberg series. The successive ionization energies IE to be used in this work have been defined earlier in this section and are inserted in Figs. 1 and 2. The residual fine structure mostly observed in the low-energy part of the spectrum will be assigned to vibrational excitation.
5.2.1. Electronic analysis
The vibrationless Rydberg transitions observed for C2H3F between 6.0 eV and 10.5 eV are shown in
Fig. 2a. Their positions in energy and their assignments are listed in Table 2 together with their quantum defects. In the same table two previous data sets are included for comparison [19,20]. Energies in parentheses correspond to features with several possible assignments. Energy values in square brackets are less accurate and correspond to peak shoulders in the spectrum. This table also contains the assignments as reported in these works. As mentioned earlier (see Section 2.2) the estimated error on the measurements in the present spectrum is about 2 meV or 16 cm-1. No error estimation being provided by Bélanger and Sandorfy [19] a critical comparison is
made difficult. However, the deviations ranging from 20 cm-1 to 110 cm-1 are randomly distributed. Sze et al.
[20] mentioned an uncertainty of 16meV (130 cm-1) and the present measurements agree within these error
limits. Nevertheless, in most cases the correspondence between the three measurements is unequivocal. For the assignments reported in the present work the adiabatic value IEad(C2H3F, XA") = (10.363 ± 0.004) eV [36] has
been used.
Concerning the 2a" → ns Rydberg series (corresponding to the nR series in [19]) an average quantum defect δ = 1.03 ± 0.05 has been determined for a series of transitions up to n = 13. Bélanger and Sandorfy [19] reported δ = 0.90, using IEad = 10.37 eV [41] and observing the series up to n = 10. Sze et al. [20] used the
vertical ionization energy IEvert = 10.57 eV determined in their work as convergence limit of the series. Very
likely this choice led these authors to propose several possible assignments as shown in Table 2, column 3. A second and long Rydberg series, made of sharp features (FWHM 10 meV), is characterized by an average quantum defect δ = 0.55 ± 0.07 and is observed up to n = 17. This δ value is ascribed to 2a" → np transitions. A nR' series has been observed up to n = 7 in the work of Bélanger and Sandorfy [19] and a δ = 0.40 was obtained. In this series only the energy position of the first three members agree with those measured in the present work. Possibly the features assigned by these authors to vibrationless transitions correspond to vibrational excitations of Rydberg states.
A last long Rydberg series characterized by an average quantum defect δ = 0.11 ± 0.05 is observed up to n = 16. Most of the features belonging to this series are very sharp (FWHM ≈ 4-5 meV). The low value of δ is typical for a 2a" → nd type transition. The present measurements are in fairly good agreement with the five terms of the nR" series of the previous photoabsorption work [19] for which a value δ = 0.03 was determined. 5.2.2. Vibrational analysis
Beside the vibrationless electronic transitions a rich fine structure is observed in the photoabsorption spectrum of C2H3F. It corresponds to the vibrational excitation of the successive electronic excited states. Only
the 3R'(υ) (i.e., the 2a"→3p(υ)) transition has been analyzed in some detail by Bélanger and Sandorfy [19]. Sze et al. [20] assigned also the fine structure to vibrational excitation associated with the 2a" → 3s, 3p and 3d transitions. The π → π* and the π → 3s transitions are not differentiated [20].
As mentioned earlier, all Rydberg series observed in the 6.0-10.5 eV photon energy range converge to the first ionization energy limit. As a consequence the equilibrium geometries of these Rydberg states are expected to be close to that of the ground ionic state. The vibrational frequencies and intensity distributions will therefore converge to those observed in the HeI- or threshold photoelectron spectrum of the molecule. The observed fine structure will be analyzed in detail on the basis of these hypotheses.
For the assignment of the vibrational structure in the PAS of C2H3F we shall refer to the first band
C2H3F+(XA") of the HeI-PES and to its assignments [36]. Examples of such a comparison are represented in
Figs. 5b and 7 for the 2a" → 3s and 2a" → 3p Rydberg transitions respectively. The photon energy scale corresponds to the PAS and the HeI-PES scale has been downshifted to fit this scale.
The detailed fine structure corresponding to the 2a" → 3s Rydberg transition is reproduced in Fig. 5. As already mentioned and discussed in Section 5.1 from Fig. 5b the HeI-PES of C2H3F+ and the PAS of C2H3F
appear poorly correlated. The intensity distribution is rather different and only one major vibrational progression seems to be excited. Contrarily, the HeI-PES [36] has to be interpreted by a complex combination of vibrational motions. These findings do not fit at all into the starting hypotheses for Rydberg series fine structure analyses.
As shown in Fig. 5a and b beside the vibrational excitation accompanying the 2a" → π*
to υ = 5 with an average energy hcωe = 167 ± 10 meV (1 350 ± 80 cm-1). The energy positions are listed in Table
6. Within the resolution obtained in this work it looks as the only regular structure to be measured. This vibrational energy is close to the υ6 (C-F stretching) normal mode for which a wavenumber of 1327 cm-1 and of
1389 cm-1 (at CAS level) or 1428 cm-1 (at CIS level) has been calculated for the ion [36] and the excited neutral
molecule (see this work Table 4) respectively.
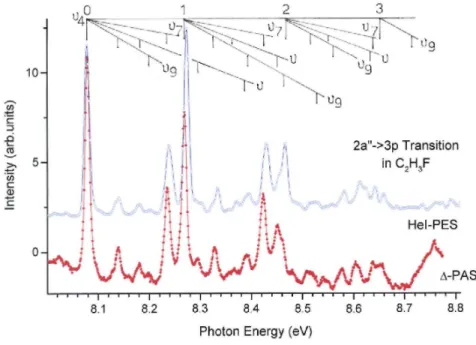
Fig. 7. ∆-Plot of the VUV photoabsorption spectrum on an expanded photon energy scale between 8.0 eV and 8.8 eV related to the 2a" → 3p transition. The first band of the HeI-PES of C2H3F is inserted for comparison.
The vertical bars locate the different vibrational energy transitions. Combinations are not represented to avoid the overcrowding of the figure.
An alternative picture for the analysis of this band is to consider the observed weak structures as being part of the same Rydberg state. Both the lifetime broadening and the π*/Rydberg coupling do not allow us to
resolve and identify the weaker structures. However, the theoretical results presented in Section 4 tend to show that the Rydberg-Valence nonadiabatic coupling involves the C=C stretching motion. From a dynamical point of view, this means that the vibrational wave packet motion along this coordinate will lead to a depopulation of the initial state and thus to a shortening of the lifetime, resulting in a broadening of the vibrational structures in the energy spectrum. In this picture the wavenumber at 1350 cm-1 as determined in this work could alternatively be
assigned to the motion involving a strongly weakened C=C bond instead of the C-F bond. This weakening would result from the transition from the bonding 2a"(π) orbital to the anti-bonding 3a"(π*) orbital.
A last noteworthy observation pointing in this direction is the broadness of the peaks for which a FWHM = 40 meV is measured. Several reports claimed the similarities between the 7.6 eV band shape in the vacuum UV PAS of C2H4 and of C2H3F [19,21]. For a better evaluation of this property, we recorded the vacuum
UV PAS of C2H4 in this photon energy range and under the same experimental conditions. The result is shown in
Fig. 8a and the comparison with the HeI-PES of C2H4 is displayed in Fig. 8b.
Obviously, the most remarkable difference between both spectra is the FWHM characterizing the transitions. No broadening is observed in the C2H4 spectrum whereas in that of C2H3F the FWHM is about four
times larger than the FWHM characterizing the 2a" → 3p Rydberg transitions. This could very likely be related to the strong lifetime shortening of the (2A")3s(υ) vibronic states. This phenomenon could be ascribed to π*
/3s-Rydberg state nonadia-batic coupling suggested by Barbatti et al. [21]. In addition, from the present calculations the X1A' ground state and the excited 1A' (2a" → π*) state are also nonadiabatically coupled through the torsion
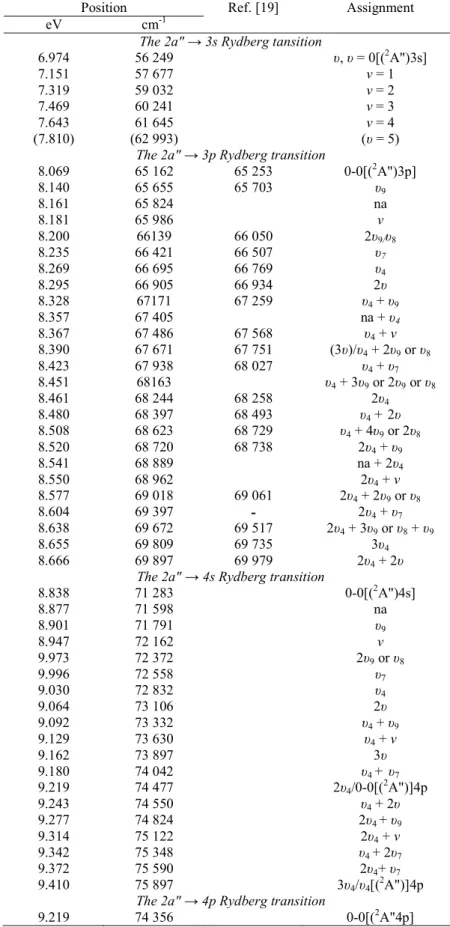
Table 6. Energy positions (eV and cm-1) and tentative assignments for the fine structures associated with the Rydberg transitions observed in the vacuum UV spectrum of C2H3F. Comparison is made with the experimental
results of Ref. [19].
Position Ref. [19] Assignment
eV cm-1
The 2a" → 3s Rydberg tansition
6.974 56 249 υ, υ = 0[(2A")3s] 7.151 57 677 v = 1 7.319 59 032 v = 2 7.469 60 241 v = 3 7.643 61 645 v = 4 (7.810) (62 993) (υ = 5)
The 2a" → 3p Rydberg transition
8.069 65 162 65 253 0-0[(2A")3p] 8.140 65 655 65 703 υ9 8.161 65 824 na 8.181 65 986 v 8.200 66139 66 050 2υ9/υ8 8.235 66 421 66 507 υ7 8.269 66 695 66 769 υ4 8.295 66 905 66 934 2υ 8.328 67171 67 259 υ4 + υ9 8.357 67 405 na + υ4 8.367 67 486 67 568 υ4 + v 8.390 67 671 67 751 (3υ)/υ4 + 2υ9 or υ8 8.423 67 938 68 027 υ4 + υ7 8.451 68163 υ4 + 3υ9 or 2υ9 or υ8 8.461 68 244 68 258 2υ4 8.480 68 397 68 493 υ4 + 2υ 8.508 68 623 68 729 υ4 + 4υ9 or 2υ8 8.520 68 720 68 738 2υ4 + υ9 8.541 68 889 na + 2υ4 8.550 68 962 2υ4 + v 8.577 69 018 69 061 2υ4 + 2υ9 or υ8 8.604 69 397 - 2υ4 + υ7 8.638 69 672 69 517 2υ4 + 3υ9 or υ8 + υ9 8.655 69 809 69 735 3υ4 8.666 69 897 69 979 2υ4 + 2υ
The 2a" → 4s Rydberg transition
8.838 71 283 0-0[(2A")4s] 8.877 71 598 na 8.901 71 791 υ9 8.947 72 162 v 9.973 72 372 2υ9 or υ8 9.996 72 558 υ7 9.030 72 832 υ4 9.064 73 106 2υ 9.092 73 332 υ4 + υ9 9.129 73 630 υ4 + v 9.162 73 897 3υ 9.180 74 042 υ4 + υ7 9.219 74 477 2υ4/0-0[(2A")]4p 9.243 74 550 υ4 + 2υ 9.277 74 824 2υ4 + υ9 9.314 75 122 2υ4 + v 9.342 75 348 υ4 + 2υ7 9.372 75 590 2υ4+ υ7 9.410 75 897 3υ4/υ4[(2A")]4p
The 2a" → 4p Rydberg transition
9.244 74 558 na 9.277 74 824 υ9 9.314 75 122 na 9.329 75 243 v 9.342 75 348 2υ9 or υ8 9.372 75 590 υ7 9.410 75 897 υ4 9.446 76 187 2υ 9.470 76 381 υ4 + υ9 9.481 76 469 0-0[(2A")4d] 9.493 76 566 υ7 + 2υ9 or υ8 9.502 76 639 0-0[(2A")5s] 9.524 76 816 υ4, + v 9.543 76 969 3υ(4p)υ9(4d) 9.561 77 115 υ4 + υ7(4p) 9.592 77 365 υ(4d) 9.603 77 453 2υ9 or υ8(4d)
The 2a' → 4d, 5s, 5p, 5d and 6s Rydberg transitions
9.481 76 469 0-0[(2A")4d] 9.493 76 566 υ7 + 2υ9 or υ8(4p) 9.502 76 639 0-0[(2A")5s] 9.525 76 824 υ4 + υ (4p) 9.543 76 969 3υ(4p)/υ9(4d) 9.560 77 107 υ4 + υ7(4p) 9.594 77 381 υ(4d) 9.603 77 453 2υ4(4p)/2υ9(4d) 9.620 77 590 2υ9 (5s) 9.635 77 711 υ7(4d) 9.643 77 776 na 9.662 77 929 υ7(5s) 0-0[(2A")5p] 9.674 78 026 υ4(4d) 9.694 78 187 υ4(5s) 9.713 78 341 2υ(5s) υ4 + 3υ9(4d) 9.750 78 639 υ4 + υ9(5s) 9.768 78 784 υ4 + υ (4d) 3υ(4d) (5s) 9.788 78 946 υ4 + υ(5s) 0-0[(2A")5d] υ4 + 3υ(5s) 9.796 79 010 υ4 + υ(5s) 9.804 79 075 na 0-0[(2A")6s] 9.815 79 163 3υ(5s) 9.824 79 236 υ4 + υ7(4d) 9.834 79 317 υ4 + υ7(5s)
The 2a" → 3p Rydberg transition is characterized by an adiabatic excitation energy of 8.079 eV (65 126 cm-1) and is made of a long series of sharp (FWHM ≈ 10meV) and strong to weak features extending over about
0.8 eV photon energy. In Fig. 7 the ∆-plot of the PAS of C2H3F in this photon energy region is compared to the
HeI-PES of C2H3F+ [36]. The correlation between both experimental results is obvious and it allows us to
propose an assignment for most of the observed features. Their energy position are listed in Table 6 together with the assignments proposed in the present work and the results obtained in the photoabsorption work of Bélanger and Sandorfy [19].
These latter authors [19] classified the fine structures and assigned them to υs (C=C stretching) with ωs
≈ 1490-1516 cm-1 and to υ
R(rocking) with ωR ≈ 300-450 cm-1. A third vibrational mode, i.e., the antisymmetric
the similarity with the observations in ethylene (E) [19]. However, the authors mention that "this result is very different from what is found for E where the twisting frequency is greatly reduced upon excitation". Contrarily to this citation, our theoretical predictions [36] for this specific vibrational mode (υ12) are 732 cm-1 and 390 cm-1 in
the neutral molecule and the cation respectively, as expected. From these results 2ωT = 780 cm-1 which is far
from the reported value of 1254-1258 cm-1 [19].
Fig. 8. (a) Comparison between the VUV photoabsorption spectra of C2H3F and C2H4 between 6.8 eV and 8.2
eV photon energy and recorded under the same experimental conditions and (b) the corresponding ∆-plots.
A detailed reexamination of the spectrum is therefore necessary and from Table 6 at least four wavenumbers emerge from the spectrum, i.e., hcω9 = 60 ± 1 meV (484 ± 8 cm-1), hcω = 102 ± 5meV (823 ± 40
cm-1), hcω
7 = 151 ± 7 meV (1218 ± 60 cm-1) and hcω4 = 191 ± 3 meV (1540 ± 24 cm-1) successively. These
energies correspond to the excitation of the CH2 rock in-plane and F-C-C bending (υ9), of the C=C stretch and
H-C=C bending (υ7) and of the C=C and C-F stretch and H-C=C bending (υ4). The corresponding wavenumbers
were calculated for the C2H3F+ molecular ion in its 2A" ground state [36] to be 489 cm-1, 1246 cm-1 and 1567 cm -1 respectively. These values become 547 (518) cm-1, 1 219 (1276) cm-1 and 1677 (1681) cm-1 as calculated for
the 3p Rydberg state at CAS (CIS) level.
Contrary to the three wavenumbers ω9, ω7 and ω4 whose experimental values agree well with the
theoretical predictions for the ionic ground state of the molecular ion [36], the fourth wavenumber at 823 ± 40 cm-1 observed by its overtones and combination with υ
4 disagrees with the calculated value. Its assignment is
therefore less obvious. From the ab initio calculations of the 3p Rydberg state (see Table 4) the closest predicted value is 1055 cm-1 (CAS) or 1059 cm-1 (CIS) and is associated with the υ
8 vibrational normal mode. For the
corresponding motion in the cation [36] this value becomes 984 cm-1. This closer agreement would argue for this
assignment. However, in the cation a wavenumber ω11 = 873 cm-1 has been calculated [36] and must also be
considered even if it is not totally symmetric: its excitation requires an intensity borrowing process via vibronic coupling. The limited precision of the theoretical calculations makes the choice between υ8 and υ11 difficult.
It must also be noted that the wavenumber characterizing υ9 is about 490 cm-1 and its second overtone is
expected at about 980 cm-1 and measured at 977 cm-1. This quantity, however, is close to the above-mentioned
wavenumber predicted at 1055 cm-1 (by CAS) or 1059 cm-1 (by CIS) for the v8 motion in the (2A")3p excited
close agreement between the experimental result and the theoretical prediction, the assignment remains therefore ambiguous.
The 2a" → 4s Rydberg transition has its adiabatic excitation energy at 8.838 eV (71 291 cm-1) and has been analyzed by the same procedure as described above.
A first noteworthy observation is the FWHM observed for these Rydberg transitions, i.e., FWHM ≈ 10 meV and fully compatible with the FWHM observed for Rydberg transitions and four times narrower than the 2a" → 3s Rydberg transitions.
For the vibrational structure associated with this transition, its overlap with the 2a" → 4p transition has to be considered above 9.219 eV. In spite of this difficulty, a reasonable assignment for the fine structure could be proposed. The intensity ratios are nearly identical to those observed for the 2a" → 3p transition (see Fig. 7). The energy position of the fine structures and the proposed assignments are tabulated in Table 6.
The same vibrational modes as in the (2A")3p Rydberg state are excited and their harmonics and
combinations as well, i.e., υ9, υ8 (or υ11), υ7 and υ4. The associated wavenumbers as determined for this state are
ω9 = 500 ± 16 cm-1 (62 ± 2 meV), ω8 (or ω11) = 876 ± 40 cm-1 (107 ± 5 meV), ω7 = 1 250 ± 8 cm-1 (155 ± 2
meV) and ω4 = 1 516 ± 24 cm-1 (188 ± 3 meV) respectively. These figures are in good agreement with those
characterizing the (2A")3p Rydberg state. Also the υ8 (or υ11) vibrational mode is still represented and its
wavenumber is close to that determined in the (2A")3p Rydberg state.
The 2a" → 4p Rydberg transition has its adiabatic excitation transition at 9.219 eV (74 356 cm-1). Its vibrational fine structure is overlapping the 2a" → 4d and the 2a" → 5s vibronic transitions characterized by 9.481 eV (76 469 cm-1) and 9.502 eV (76 632 cm-1) adiabatic excitation energy respectively. However, a
disentangling of the detailed fine structure has been performed using the procedure described above.
The energy position of the vibrational structures is listed in Table 6. In the 9.219-9.470 eV energy range the details could unambiguously be assigned to the vibrational excitation of the (2A")4p Rydberg state of C
2H3F
and the proposed assignments are listed in Table 6. As shown in this table the υ9, υ8 (or υ11), υ7 and υ4 vibrational
modes are identified as well as some of their overtones and/ or combinations: ω9 = 468 cm -1
(58 meV), ω8 (or
ω11) = 887 cm-1 (110 meV), ω7 = 1234 cm-1 (153 meV) and ω4 = 1540cm-1 (191 meV) successively.
At 9.481 eV (76 469 cm-1) and at 9.502 eV (76 639 cm-1) the peaks are characterized by about equal
intensities and comparable to that of the structure at 9.219 eV. Their FWHM are of about 4-5 meV which is twice as narrow as the 2a" → 3p transition at 8.839 eV. These are unambiguously assigned to the 2a" → 4d and the 2a" → 5s transitions.
At higher energies the peaks at 9.796 eV (79 010 cm-1) and 9.815 eV (79 195 cm-1) have been attributed
to the 2a" → 5d and 2a" → 6s transitions based on the same intensity and FWHM criteria.
Concerning the interpretation of the fine structures above these energies the overlap of Rydberg states becomes too important preventing their unambiguous assignment. However, a few possibilities are proposed and listed in Table 6.
As a final general remark it has to be pointed out that for all vibrationally analyzed Rydberg states the adiabatic and vertical excitation energies coincide. Conversely, for the XA" ionic state these energies differ by one vibrational quantum hcω4.
6. Conclusions
The investigation of the VUV photoabsorption spectrum of vinyl fluoride at low and medium resolution by using synchrotron radiation enabled us to extend its photoabsorption data above the 10.5 eV photon energy limit, i.e., from 10.5 eV to 25 eV. A tentative assignment of the broad and strong bands observed in this energy range is presented: Valence-Valence as well as Valence-Rydberg transitions would be involved.
The low energy spectrum between 6 eV and 10.5 eV measured at medium resolution has been reexamined in detail. The lowest energy broad band centered at 7.6 eV is made of several fine structures. It has been assigned to the superposition of 2a" → π* and 2a" → 3s transitions which are characterized by different fine
presented to support the proposed assignments.
Above 8.0 eV the abundant fine structure has been assigned to vibronic Rydberg transitions, i.e., 2a" → ns (n = 3-13), np (n = 3-17) and nd (n = 3-16) have been identified. All involved Rydberg states converge to the C2H3F+(XA') ground ionic state. The vibrational fine structure associated with these transitions has been
analyzed based on the first band of the C2H3F HeI-PES and ab initio calculations. This procedure allowed us to
assign the observed structure to three vibrational modes (and their harmonics and combination) υ4 (CC and CF
stretch, H-CC bending), υ7 (CC stretch, H-CC bending) and υ9 (CH2 rock in-plane, F-CC bending). The
assignment to υ8 and/or υ11 is discussed but remains uncertain.
Acknowledgments
We are indebted to the University of Liège, the Fonds de la Recherche Fondamentale Collective (FRFC), the Freie Universität Berlin and the Bundesministerium fur Forschung und Technologie for financial support. R.L. and B.L. gratefully acknowledge the European Community for its support through its TMR (Contract EU-HPRI-1999CT-00028) and 13 (Contract R II 3 CT-2004-506008). H.B. acknowledges the Fonds der Chemischen Industrie for financial support. The important financial support of the Direction de la Recherche Scientifique de la Communauté Française de Belgique through an Action de Recherche Concertée (A.R.C.) is greatfully acknowledged. D.D.'s contribution was supported by the Belgian program on Poles of Attraction of the Belgian Science policy (IAP No. P6/19).
References
[1] R. Locht, J. Momigny, Int. J. Mass Spectrom. Ion Phys. 71 (1986) 141.
[2] J. Momigny, R. Locht, G. Caprace, Int. J. Mass Spectrom. Ion Phys. 71 (1986) 159. [3] R. Locht, J. Momigny, E. Rühl, H. Baumgärtel, Chem. Phys. 117 (1987) 305.
[4] K.M. Weitzel, F. Güthe, J. Manhert, R Locht, H. Baumgärtel, Chem. Phys. 201 (1995) 287.
[5] R. Locht, B. Leyh, A. Hoxha, D. Dehareng, H.W. Jochims, H. Baumgärtel, Chem. Phys. 257 (2000) 283. [6] R. Locht, B. Leyh, A. Hoxha, H.W. Jochims, H. Baumgärtel, Chem. Phys. 272 (2001) 259.
[7] R. Locht, B. Leyh, A. Hoxha, D. Dehareng, H.W. Jochims, H. Baumgärtel, Chem. Phys. 272 (2001) 277.
[8] R. Locht, B. Leyh, A. Hoxha, D. Dehareng, K. Hottmann, H.W. Jochims, H. Baumgärtel, Chem. Phys. 272 (2001) 293. [9] R. Locht, B. Leyh, H.W. Jochims, H. Baumgärtel, Chem. Phys. 317 (2005) 73.
[10] R. Locht, B. Leyh, D. Dehareng, H.W. Jochims, H. Baumgärtel, Chem. Phys. 317 (2005) 87.
[11] R. Locht, B. Leyh, D. Dehareng, H.W. Jochims, K. Hottmann, H. Baumgärtel, Chem. Phys. 323 (2006) 458. [12] R. Locht, B. Leyh, K. Hottmann, H. Baumgärtel, Chem. Phys. 220 (1997) 207.
[13] R. Locht, B. Leyh, K. Hottmann, H. Baumgärtel, Chem. Phys. 220 (1997) 217.
[14] A. Hoxha, R Locht, B. Leyh, D. Dehareng, H.W. Jochims, H. Baumgärtel, Chem. Phys. 256 (2000) 239.
[15] A. Hoxha, R. Locht, B. Leyh, D. Dehareng, K. Hottmann, H.W. Jochims, H. Baumgärtel, Chem. Phys. 260 (2000) 237. [16] A. Hoxha, R. Locht, AJ. Lorquet, J.C. Lorquet, B. Leyh, J. Chem. Phys. 1ll (1999) 9259.
[17] F. Güthe, R. Locht, B. Leyh, H. Baumgärtel, K.M. Weitzel, J. Phys. Chem. A 103 (1999) 8404.
[18] E. Gridelet, D. Dehareng, R. Locht, AJ. Lorquet, J.C. Lorquet, B. Leyh, J. Phys. Chem. A 109 (2005) 8225. [19] G. Bélanger, C. Sandorfy, J. Chem. Phys. 55 (1971) 2055.
[21] M. Barbatti, A.J.A. Aquino, H. Lischka, J. Phys. Chem. A 109 (2005) 5168.
[22] G. Reichardt, T. Noll, I. Packr, P. Rotter, J.-S. Schmidt, W. Gudat, Nucl. Instr. And Meth. A 467-468 (2001) 458. [23] R. Locht, B. Leyh, W. Denzer, G. Hagenow, H. Baumgärtel, Chem. Phys. 155 (1991) 407.
[24] P.J. Mohr, B.N. Taylor, J. Phys. Chem. Ref. Data 28 (1999) 1713. [25] T.H. Dunning Jr., J. Chem. Phys. 90 (1989) 1007.
[26] D.E. Woon, T.H. Dunning Jr., J. Chem. Phys. 98 (1993) 1358. [27] D. Hegarty, MA Robb, Mol. Phys. 38 (1979) 1795.
[28] R.H.E. Eade, M.A. Robb, Chem. Phys. Lett. 83 (1981) 362.
[29] F. Bernardi, A Bottini, J.J.W. McDougall, M.A. Robb, H.B. Schlegel, Faraday Symp. Chem. Soc. 19 (1984) 137. [30] J.B. Foresman, M. Head-Gordon, J.A. Pople, M.J. Frisch.J. Phys. Chem. 96 (1992) 135.
[31 ] M.J. Frisch, G.W. Trucks, H.B. Schlegel, G.E. Scuseria, M.A. Robb, J.R. Cheeseman, J.A. Montgomery Jr., T. Vreven, K.N. Kudin, J.C. Burant, J.M. Millam, S.S. Iyengar, J. Tomasi, V. Barone, B. Mennucci, M. Cossi, G. Scalmani, N. Rega, G.A. Peterson, H. Nakatsuji, M. Hada, M. Ehara, K. Toyota, R. Fukuda, J. Hasegawa, M. Ishida, T. Nakajima, Y. Honda, O. Kitao, H. Nakai, M. Klene, X. Li, J.E. Knox, H.P. Hratchian, J.B. Cross, C. Adamo, J. Jaramillo, R. Gomperts, RE. Stratmann, O. Yazyev, AJ. Austin, R. Cammi, C. Pomelli, J.W. Ochterski, P.Y. Ayala, K. Morokuma, G.A Voth, P. Salvador, J.J. Dannenberg, V.G. Zakrzewski, S. Dapprich, A.D. Daniels, M.C. Strain, O. Farkas, D.K. Malick, A.D. Rabuck, K. Raghavachari, J.B. Foresman, J.V. Ortiz, Q.. Cui, A.G. Baboul, S. Clifford, J. Ciolowski, B.B. Stefanov, G. Liu, A. Liashenko, P. Piskorz, I. Komaromi, R.L. Martin, D.J. Fox, T. Keith, M.A. Al-Laham, C.Y. Peng, A. Nanayakkara, M. Challacombe, P.M.W. Gill, B. Johnson, W. Chen, M.W. Wong, C. Gonzalez, J.A. Pople, GAUSSIAN 03, Revision B.04, Gaussian Inc., Pittsburgh, PA, 2003.
[32] RF. Lake, H. Thompson, Proc. Roy. Soc. Lond. A 315 (1970) 323.
[33] D. Reincke, H. Baumgärtel, T. Cvitas, L. Klasinc, H. Güsten, Ber. Bunsen Gesell. Phys. Chem. 78 (1974) 1145. [34] G. Bieri, W. Von Niessen, L Asbrink, A. Svensson, Chem. Phys. 60 (1981) 61.
[35] A.W. Potts, J.M. Benson, I. Novak, W.A. Svensson, Chem. Phys. 115 (1987) 253.
[36] R Locht, B. Leyh, D. Dehareng, K. Hottmann, H. Baumgärtel, Chem. Phys., submitted for publication. [37] K. Takeshita, Theor. Chem. Ace. 101 (1999) 343.
[38] R Locht, in: H. Keller-Rudek, G.K. Moortgat (Eds.), MPI-Mainz-UV-VIS Spectral Atlas of Gazeous Molecules, <http://www.atmosphere.mpg.de/spectral-atlas-mainz>.
[39] D.M.P. Holland, D.A. Shaw, M.A. Hayes, L.G. Shpinkova, E.E. Rennie, L. Karlsson, P. Baltzer, B. Wannberg, Chem. Phys. 219 (1997) 91.
[40] K.B. Wiberg, CM. Haddad, J.B. Foresman, W.A. Chupka, J. Phys. Chem. 96 (1992) 10756. [41] R Bralsford, P.V. Harris, W.C. Price, Proc. Roy. Soc. (Lond.) A258 (1960) 459.