https://doi.org/10.1051/0004-6361/201936959 c ESO 2019
Astronomy
&
Astrophysics
L
ETTER TO THEE
DITOR2I/Borisov: A C
2
-depleted interstellar comet
Cyrielle Opitom
1,2, Alan Fitzsimmons
3, Emmanuel Jehin
4, Youssef Moulane
1,4,5, Olivier Hainaut
6, Karen J. Meech
7,
Bin Yang
1, Colin Snodgrass
2, Marco Micheli
8,9, Jacqueline V. Keane
7, Zouhair Benkhaldoun
5, and Jan T. Kleyna
71 European Southern Observatory, Alonso de Cordova 3107, Vitacura, Santiago, Chile
e-mail: [email protected]
2 Institute for Astronomy, University of Edinburgh, Royal Observatory, Edinburgh EH9 3HJ, UK 3 Astrophysics Research Centre, Queen’s University Belfast, Belfast BT7 1NN, UK
4 STAR Institute, Université de Liège, Allée du 6 Aout, 19C, 4000 Liège, Belgium 5 Oukaimeden Observatory, Cadi Ayyad University, Marrakech, Morocco
6 European Southern Observatory, Karl-Schwarzschild-Strasse 2, 85748 Garching bei München, Germany 7 Institute for Astronomy, 2680 Woodlawn Drive, Honolulu, HI 96822, USA
8 ESA NEO Coordination Centre, Largo Galileo Galilei 1, 00044 Frascati, RM, Italy
9 INAF – Osservatorio Astronomico di Roma, Via Frascati 33, 00040 Monte Porzio Catone, RM, Italy
Received 20 October 2019/ Accepted 22 October 2019
ABSTRACT
Aims.The discovery of the first active interstellar object 2I/Borisov provides an unprecedented opportunity to study planetary
forma-tion processes in another planetary system. In particular, spectroscopic observaforma-tions of 2I allow us to constrain the composiforma-tion of its nuclear ices.
Methods. We obtained optical spectra of 2I with the 4.2 m William Herschel and 2.5 m Isaac Newton telescopes between 2019 September 30 and October 13, when the comet was between 2.5 au and 2.4 au from the Sun. We also imaged the comet with broad-band filters on 15 nights from September 11 to October 17, as well as with a CN narrow-broad-band filter on October 18 and 20, with the TRAPPIST-North telescope.
Results.Broadband imaging confirms that the dust coma colours (B − V= 0.82 ± 0.02, V − R = 0.46 ± 0.03, R − I = 0.44 ± 0.03, B−R= 1.28±0.03) are the same as for Solar System comets. We detect CN emission in all spectra and in the TRAPPIST narrow-band images with production rates between 1.6 × 1024and 2.1 × 1024molec/s. No other species are detected. We determine three-sigma
upper limits for C2, C3, and OH production rates of 6 × 10²³molec/s, 2 × 10²³molec/s and 2 × 1027molec/s, respectively, on October
02. There is no significant increase of the CN production rate or A(0)fρ during our observing period. Finally, we place a three-sigma upper limit on the Q(C2)/Q(CN) ratio of 0.3 (on October 13). From this, we conclude that 2I is highly depleted in C2, and may have a
composition similar to Solar System carbon-chain depleted comets.
Key words. comets: general – comets: individual: 2I/Borisov
1. Introduction
Ejected planetesimals are expected as a result of giant planet migration in planetary systems (Levison et al. 2010;Dones et al. 2004). Consequently, it has been foreseen for decades that inter-stellar objects (ISOs) should cross the Solar System or even be captured, providing opportunities to study planetary forma-tion processes in other systems (Engelhardt et al. 2017). The first ISO, 1I/2017 U1 (‘Oumuamua), was discovered on 2017 Octo-ber 17 at 1.12 au from the Sun, post-perihelion (Meech et al. 2017). Even though non-gravitational acceleration of its motion suggested 1I was active (Micheli et al. 2018), no gas or dust coma was detected (Meech et al. 2017;Fitzsimmons et al. 2018; Ye et al. 2017;Trilling et al. 2018). The lack of coma detection around 1I unfortunately prevented any detailed study of the com-position of the first ISO.
On 2019 August 30, comet C/2019 Q4 (Borisov) was dis-covered by amateur astronomer Gennady Borisov. The comet was quickly found to have a hyperbolic orbit, with an eccen-tricity >3, and was officially renamed 2I/Borisov (hereafter 2I)
on September 24. Contrary to 1I, 2I was observed to be active at the time of discovery at 2.985 au from the Sun. Initial spectro-scopic observations byde León et al.(2019) revealed a feature-less spectrum. Optical dust colours were found to be consistent with those of active Solar System comets (Fitzsimmons et al. 2019; Guzik et al. 2019; Jewitt & Luu 2019). The radius of the nucleus was estimated to be between 0.7 km and 3.3 km by Fitzsimmons et al. (2019), consistent with the upper limit of 3.8 km set by Jewitt & Luu (2019). Observations of 2I by Fitzsimmons et al. (2019) allowed the first detection of gas around an ISO. From the detection of the CN (0−0) band at 388 nm, the CN production rate of 2I was estimated to be of 3.7 × 1024molec/s on September 20 at 2.66 au. Recently, Kareta et al.(2019) claimed a detection of C2with a production rate of 2.5 × 1024molec/s.
In this Letter, we present spectroscopic and photometric observations of 2I aimed at constraining its composition, com-plemented with broadband imaging to monitor the comet activity and dust colours.
A&A 631, L8 (2019)
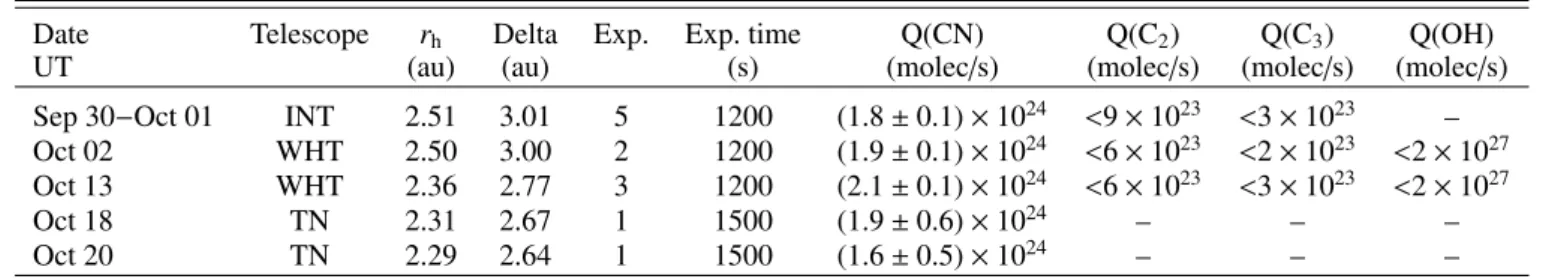
Table 1. Log of observations and production rates of 2I/Borisov with the WHT, INT, and TRAPPIST-North.
Date Telescope rh Delta Exp. Exp. time Q(CN) Q(C2) Q(C3) Q(OH)
UT (au) (au) (s) (molec/s) (molec/s) (molec/s) (molec/s)
Sep 30−Oct 01 INT 2.51 3.01 5 1200 (1.8 ± 0.1) × 1024 <9 × 10²³ <3 × 10²³ – Oct 02 WHT 2.50 3.00 2 1200 (1.9 ± 0.1) × 1024 <6 × 10²³ <2 × 10²³ <2 × 1027 Oct 13 WHT 2.36 2.77 3 1200 (2.1 ± 0.1) × 1024 <6 × 10²³ <3 × 10²³ <2 × 1027
Oct 18 TN 2.31 2.67 1 1500 (1.9 ± 0.6) × 1024 – – –
Oct 20 TN 2.29 2.64 1 1500 (1.6 ± 0.5) × 1024 – – –
2. Observations and data reduction 2.1. William Herschel Telescope
2I/Borisov was observed with the 4.2 m William Herschel Tele-scope (WHT) and the ISIS spectrograph on La Palma on 2019 October 02.2 UT and 13.2 UT. The observational circumstances are given in Table1. The spectrograph and detector configura-tion was as described inFitzsimmons et al.(2019), except that the centre of the observed spectral range was moved to 406.6 nm. This allowed observation of wavelengths from the atmospheric cut-off at 300 nm up to 580 nm within the unvignetted field of the spectrograph camera, covering many prominent molec-ular emission bands observed in normal comets. On both nights we obtained three consecutive 1200 s exposures, but on Octo-ber 02.2 UT the last one was unusable due to bright twilight sky. On both dates the comet exposures were immediately fol-lowed by exposures of the spectrophotometric standard G191-B2B (Bohlin et al. 1995) using a 1000-wide slit to enable flux calibration, and the solar analogue HD 28099 (Hardorp 1980) using the same 200-wide slit as used for the comet to enable removal of the contribution of the dust-reflected continuum. The comet spectra were extracted over an aperture of 800 centred on the comet.
2.2. Isaac Newton Telescope
Observations of 2I were also performed with the 2.54 m Isaac Newton Telescope combined with the IDS spectrograph on La Palma on 2019 September 30.2 UT and October 01.2 UT. The IDS is a low-resolution spectrograph with an unvignetted slit length of 3.30. We used the blue-sensitive EEV10 detec-tor and the IDS R400B grating providing a dispersion of 0.141 nm pixel−1at 390 nm, combined with a 200-wide slit. We obtained three 1200 s exposures on the first night and four 1200 s exposures on the second night. However, the last exposure of each night was affected by strong background of the morning twilight. As such, we decided to discard those exposures. The spectra were bias subtracted, flat fielded, and wavelength cali-brated using a CuAr+NeAr lamp. The spectrophotometric stan-dard star HILT600 was observed immediately before 2I on each night and was used to flux calibrate the spectra. The spectra were extracted over the same 800 aperture as for the WHT, and all five spectra were then co-added to increase the signal-to-noise ratio. Finally, the contribution of the dust-reflected continuum was removed using the scaled and reddened spectrum of a solar analogue.
2.3. TRAPPIST
The interstellar comet 2I was also observed with the 60 cm TRAPPIST-North telescope (TN) located at Oukaimeden
observatory, Morocco (Jehin et al. 2011). TN is equipped with a 2k × 2k CCD camera with a field of view of 220× 220. We binned the pixels 2 by 2 and obtained a resulting plate scale of 1.200pixel−1. We observed 2I with broadband BVRI filters (Bessell 1990) on 15 nights from 2019 September 11, when the comet was at 2.80 au from the Sun, to October 17 (rh= 2.31 au). On each night, three images were obtained in the B, V, and I filters and about six images were taken in the R filter, all with an exposure time of 180 s. On October 18 and 20, we also obtained an exposure with the CN narrow-band filter (Farnham et al. 2000), with an exposure time of 1500 s. Data reduction followed standard procedures using frequently updated master bias, flat, and dark frames. The sky contamination was subtracted and the flux calibration was performed using regularly updated zero points based on observations of photometric standard stars, as described in previous papers (Opitom et al. 2016;Moulane et al. 2018).
3. Analysis 3.1. The gas coma
In all reduced spectra, the CN (0−0) emission at 388 nm is clearly detected, as can be seen in Fig. 1 where the three spectra of 2I are compared to the spectra of two Solar Sys-tem comets observed at a similar heliocentric distance. The flux was measured by approximating the band shape with two free-fitted Gaussians. We used the fluorescence scattering e ffi-ciency from Schleicher (2010) to compute the total number of CN molecules within the extraction aperture. We then used a Haser model (Haser 1957) to compute the CN production rates for all our observing dates, with an outflow velocity of 0.85/√rh' 0.5 km s−1(Cochran & Schleicher 1993) and e ffec-tive scale lengths fromA’Hearn et al.(1995). In order to derive the CN production rate from TRAPPIST narrow-band images, we derived median radial brightness profiles for the CN and R images and used the continuum filter to remove the dust con-tamination. We then converted the flux to column density and fitted the profile with a Haser model at 10 000 km from the nucleus, using the same parameters as for the spectra. In the last spectrum, we also marginally detect the CN (0−1) band around 420 nm (see Fig. 1). The flux ratio was measured as (0−1)/(0−0) = 0.05 ± 0.01, slightly smaller than the expected value of 0.08 from the respective g-factors.
We carefully searched for the C2 (0−0) emission band around 516.7 nm, which is usually the second species detected in the optical spectrum of comets, but without success. No emission from OH at 308 nm or C3 around 405 nm could be detected either. There is some suggestion of excess emission near the wavelengths of the C3 band, but it does not match the expected profiles of either C3, CO+, or CO+2. Measuring the rms uncertainty around the wavelengths of OH, C2, and C3, we
Fig. 1.Flux calibrated and continuum subtracted spectra of 2I/Borisov obtained with the INT and WHT through a 200
× 800
aperture centred on the comet. The spike around 435 nm in the October 13 spectrum is a noise feature. The bottom plot shows spectra of two comets observed at similar heliocentric distances as 2I: 67P/Churyumov-Gerasimenko (fromOpitom et al. 2017, rh= 2.36 au), a Jupiter Family comet with a CN production
rate similar as 2I and for which C2was not detected at that distance, and C/2013 US10 (Catalina) (fromOpitom 2016, rh= 2.30 au), a typical very
active long-period comet, for which both C2and C3were detected. Those spectra have both been arbitrarily scaled on the y-axis.
485 490 495 500 505 510 515 520 Wavelength (nm) -4.0e-17 -2.0e-17 0.0e+00 2.0e-17 4.0e-17 6.0e-17 8.0e-17 1.0e-16 Flu x ( er gs /s/ cm 2/)
Fig. 2.Black data: continuum-subtracted spectrum of 2I/Borisov on
2019 October 13.2 UT in the region of the C2 (0−0) emission band.
Blue theoretical spectrum: C2 emission flux through our aperture for
a production rate of Q(C2)= 2.5 × 1024molec/s at a spectral
resolu-tion of ∆λ = 1 nm. Red theoretical spectrum: as above for Q(C2)=
6 × 10²³molec/s.
computed three-sigma upper limits for the production rates of those species using a Haser model and the same parameters as mentioned above. Scattering g-factors for OH (0−0) were taken fromSchleicher & A’Hearn(1988). To support these upper lim-its for the C2 (0−0) band, we calculated theoretical emission spectra for a cometary atmosphere at the same observa-tional geometry as 2I using the Planetary Spectrum Genera-tor (Villanueva et al. 2018). In Fig.2we overlay our data with these theoretical spectra convolved to our spectral resolution of ∼1 nm for production rates of Q(C2)= 2.5 × 1024molec/s as reported by Kareta et al.(2019), and for our upper limit of Q(C2)= 6 × 10²³molec/s.
The CN production rates and the upper limits for C2, C3, and OH are given in Table 1. The CN production rates we derive from the WHT and INT observations are in good agreement with TRAPPIST data within the error bars. We do not see a significant increase of the CN production rate over the three weeks between the first and last observations. The CN produc-tion rates we measure are about a factor of two lower than the one reported by Fitzsimmons et al. (2019). However, we con-sider them to be consistent with that measurement concon-sidering the large uncertainty due to the high airmass and thin clouds reported byFitzsimmons et al.(2019). The upper limit we derive for the C2 production rate is significantly more constraining than the one fromFitzsimmons et al.(2019) (4 × 1024molec/s). Our CN production rates are more than a factor of two lower than the CN production rate measured byKareta et al.(2019). Kareta et al.(2019) reported the detection of C2with a produc-tion rate of 2.5 × 1024molec/s, while we do not detect any C
2in our observations and place a much lower upper limit on the C2 production rate of 6×10²³molec/s. Given that our more stringent upper limit was obtained at a similar time to that ofKareta et al. (2019), and that we see no evidence for significant variation in production rates between spectra, we argue that their value should also be regarded as an upper limit; careful inspection of their spectrum (Fig. 2 ofKareta et al. 2019) does not reveal any strong evidence for a detection. Indeed, a personal communica-tion by T. Kareta on Oct. 24, 2019 confirms that the claimed C2 detection in that submitted manuscript is more likely an upper limit.
3.2. The dust coma
We measured the magnitude of 2I in the B, V, R, and I fil-ters within an aperture radius of 4.200 corresponding to about
A&A 631, L8 (2019)
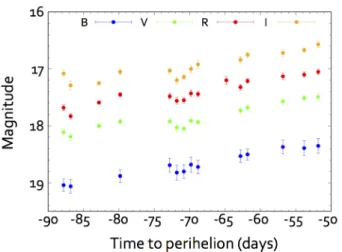
Fig. 3.Evolution of the BVRI magnitude of 2I/Borisov as a function of
time to perihelion.
Table 2. Colours of 2I/Borisov compared to those of 1I/‘Oumuamua, JFCs, and LPCs.
Object Colours Ref.
B − V V − R R − I B − R 2I/Borisov 0.82 ± 0.02 0.46 ± 0.03 0.44 ± 0.03 1.28 ± 0.03 (1) 0.80 ± 0.05 0.47 ± 0.03 0.49 ± 0.05 1.27 ± 0.04 (2) 1I/‘Oumuamua 0.70 ± 0.06 0.45 ± 0.05 – 1.15± 0.05 (3) Active LPCs 0.78 ± 0.02 0.47 ± 0.02 0.42 ± 0.03 1.24 ± 0.02 (4) Active JFCs 0.75 ± 0.02 0.47 ± 0.02 0.44 ± 0.02 1.22 ± 0.02 (5) Sun 0.64 ± 0.02 0.35 ± 0.01 0.33 ± 0.01 0.99 ± 0.02 (6)
References. (1) This work; (2) Jewitt & Luu(2019); (3) Jewitt et al.
(2017); (4)Jewitt(2015); (5)Solontoi et al.(2012); (6)Holmberg et al.
(2006).
9000 km at the distance of the comet. The brightness of 2I increased regularly but slowly in all filters, with a total increase of about 0.7 mag over one month. Figure3shows the evolution of the magnitudes as a function of time to perihelion. The aver-age colours of the coma (dominated by the dust-reflected con-tinuum) over the whole observing period are given in Table2 and compared to those of 1I and to typical Jupiter Family Comets (JFCs) and Long-Period Comets (LPCs). The colours do not appear to vary with time. They are redder than the Sun and 1I, and similar to those measured for active JFCs and LPCs. They are in agreement with previous measurements by Fitzsimmons et al.(2019),Jewitt & Luu(2019).
We computed the Afρ parameter at 10 000 km from the nucleus and corrected it for the phase angle effect accord-ing to the phase function normalised at θ= 0◦ derived by D. Schleicher1. We do not see a significant increase of the A(0)fρ
with time or heliocentric distance and compute a mean value of A(0)fρ= 132.4 ± 4.7 cm in the R filter for our data set. Using an average CN production rate of 1.9 × 1024molec/s, we derive a dust-gas ratio of log[A(0)fρ/Q(CN)] = −22.16.
4. Discussion
The sensitive upper limits on the C2 production rate of 2I that we derive allowed us to compute an upper limit of the Q(C2)/Q(CN) ratio in the coma of 2I of 0.3 (for October 13). With such a low Q(C2)/Q(CN) ratio, 2I would be classified as
1 http://asteroid.lowell.edu/comet/dustphase.html
a carbon-chain depleted comet in our Solar System (defined by log[Q(C2)/Q(CN)] < −0.18 according toA’Hearn et al. 1995).
Numerous studies of Solar System comets have focused on the composition of the coma, including among others the C2, C3, and CN radicals. A’Hearn et al. (1995) showed that two main classes of comets can be distinguished based on the relative abundance of radicals observed at visible wavelengths: typical comets, and comet depleted in carbon-chain species, like C2 and C3. Later studies byFink(2009),Langland-Shula & Smith (2011),Cochran et al.(2012),Schleicher(2008) confirmed the existence of a class of comets depleted in carbon-chain species. A’Hearn et al.(1995) also showed that the fraction of depleted comets is higher among JFCs (with a source in the Kuiper Belt region) than among LPCs from the Oort cloud. This conclu-sion was supported byCochran et al.(2012), who observed that 18.5% of the LPCs in their sample were depleted, while the pro-portion of carbon-chain depleted JFCs was 37%.
The definition of carbon-chain depleted comets varies among studies. Some authors define them as being depleted in both C2 and C3 (Cochran et al. 2012) while others only consider the C2 abundance (A’Hearn et al. 1995;Fink 2009). Consequently, the proportion of depleted comets varies among studies, even though they are similar if only C2 is considered. Within the restricted data set ofA’Hearn et al.(1995), 29% of the comets are depleted in C2 and 28% according toFink(2009).Cochran et al.(2012) have 9% of comets in their restricted data set depleted in both C2 and C3, while 25% are depleted only in C2. Carbon-chain-depleted comets therefore make up about 30% of observed Solar System comets, with the majority of those being JFCs.
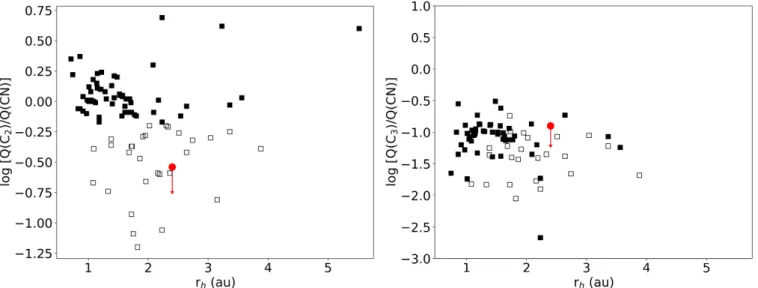
Using the same scale lengths as those used here to com-pute gas production rates,A’Hearn et al.(1995) defined carbon-chain depleted comets as comets with log[Q(C2)/Q(CN)] < −0.18. According to this definition, 2I is indeed depleted with log[(Q(C2)/Q(CN)] < −0.54. In Fig.4, we compare the composi-tion of 2I to the comets in the database ofOsip et al.(2003) (an online version of the database ofA’Hearn et al. 1995). On the left side we see that the upper limit of the Q(C2)/Q(CN) measured for 2I is lower than most of the comets in that database, including the majority of carbon-chain depleted comets, and places 2I among the highly depleted comets. On the right side of Fig.4, we show a similar plot for the Q(C3)/Q(CN) ratio. Our upper limit on the C3 production rate only indicates that the C3 abundance in the coma of 2I is not enhanced with respect to CN, as compared to the bulk of comets.
Studies have shown that the ratio between C2and CN abun-dances changes with the heliocentric distance of the comet, and tends to decrease with increasing heliocentric distances above 1 au (Langland-Shula & Smith 2011). However, even when com-pared to typical comets observed at similar heliocentric dis-tances, 2I appears severely depleted in C2, as shown in Fig.4.
Even though the origin of the carbon-chain depletion in Solar System comets is still debated, evidence suggest that it is intrinsic rather than evolutionary. Indeed, short-period comets observed at successive perihelion passages do not show signif-icant changes in composition (A’Hearn et al. 1995). Moreover, observations of the split comet 73P/Schwassmann-Wachmann 3 in 2003 did not show any composition difference among the frag-ments, nor after the outburst, compared to previous passages of the comet (Schleicher & Bair 2011). If primordial, the compo-sition difference between typical and depleted comets points to different formation regions for these comets. The C2 depletion of 2I might then indicate formation conditions similar to the carbon-chain depleted Solar System comets. On the other hand, the apparent very slow rise of 2I gas activity so far is reminiscent
Fig. 4.Panel a: comparison between the upper limit for 2I (red data point) and Q(C2)/Q(CN) from theOsip et al.(2003) database for a variety
of comets with different Q(CN). Full symbols represent typical comets and open symbols represent carbon-chain depleted comets as defined in
A’Hearn et al.(1995). Error bars are omitted for clarity. Panel b: same as panel a but for Q(C3)/Q(CN).
of the behaviour of dynamically new comets approaching the Sun for the first time (A’Hearn et al. 1995). Longer-term moni-toring of the activity of 2I and actual detection of species other than CN, allowing abundance ratios to be computed, are neces-sary to determine the likeness of 2I to the various families of Solar System comets. This is likely to be achieved in the com-ing weeks, while the comet becomes brighter and more easily observable to numerous telescopes.
Finally, our non-detections of OH give log[Q(OH))/ Q(CN)] < 3.0. This upper limit is consistent with the abundance ratio of these species in both typical and depleted comets in A’Hearn et al.(1995). Therefore, assuming OH derives as usual from the photodissociation of H2O, the present data are consis-tent with a normal CN/OH ratio and there is no evidence for an abnormal water abundance in 2I.
5. Conclusions
In this Letter, we present spectroscopic observations of the first active interstellar object 2I/Borisov with the WHT and INT telescopes in la Palma, complemented by broadband and narrow-band imaging with the TRAPPIST-North telescope. We deter-mine an upper limit of the C2 production rate and abundance relative to CN. We conclude that 2I is strongly depleted in C2, and would be classified as a carbon-chain depleted comet in our Solar System. Future spectroscopic observations should allow us to better constrain the extent of the C2 depletion in 2I and to further characterise the composition of its nuclear ices.
Acknowledgements. We thank Ovidiu Vaduvescu, Lilian Dominguez and Ian Skillen of the Isaac Newton Group for performing observations for us under ser-vice programme SW2019b04. The WHT and INT are operated on the island of La Palma by the Isaac Newton Group of Telescopes in the Spanish Observa-torio del Roque de los Muchachos of the Instituto de Astrofísica de Canarias. TRAPPIST is a project funded by the Belgian Fonds (National) de la Recherche Scientifique (F.R.S.-FNRS) under grant FRFC 2.5.594.09.F. TRAPPIST-North is a project funded by the University of Liege, in collaboration with Cadi Ayyad University of Marrakech (Morocco). E.J. is F.R.S.-FNRS Senior Research Asso-ciate. AF and CS acknowledge support for this work from UK STFC grants ST/P000304/1 and ST/L004569/1. KJM, JTK, and JVK acknowledge support through awards from NASA 80NSSC18K0853.
References
A’Hearn, M. F., Millis, R. C., Schleicher, D. O., Osip, D. J., & Birch, P. V. 1995,
Icarus, 118, 223
Bessell, M. S. 1990,PASP, 102, 1181
Bohlin, R. C., Colina, L., & Finley, D. S. 1995,AJ, 110, 1316
Cochran, A. L., & Schleicher, D. G. 1993,Icarus, 105, 235
Cochran, A. L., Barker, E. S., & Gray, C. L. 2012,Icarus, 218, 144
de León, J., Licandro, J., Serra-Ricart, M., et al. 2019,Res. Notes Am. Astron. Soc., 3, 131
Dones, L., Weissman, P. R., Levison, H. F., & Duncan, M. J. 2004, inOort Cloud Formation and Dynamics, eds. M. C. Festou, H. U. Keller, & H. A. Weaver, 153
Engelhardt, T., Jedicke, R., Vereš, P., et al. 2017,AJ, 153, 133
Farnham, T. L., Schleicher, D. G., & A’Hearn, M. F. 2000,Icarus, 147, 180
Fink, U. 2009,Icarus, 201, 311
Fitzsimmons, A., Snodgrass, C., Rozitis, B., et al. 2018,Nat. Astron., 2, 133
Fitzsimmons, A., Hainaut, O., Meech, K., et al. 2019, ApJL, in press, [arXiv:1909.12144]
Guzik, P., Drahus, M., Rusek, K., et al. 2019, Nat. Astron., in press [arXiv:1909.05851]
Hardorp, J. 1980,A&A, 91, 221
Haser, L. 1957,Bull. Soc. R. Sci. Liege, 43, 740
Holmberg, J., Flynn, C., & Portinari, L. 2006,MNRAS, 367, 449
Jehin, E., Gillon, M., Queloz, D., et al. 2011,The Messenger, 145, 2
Jewitt, D. 2015,AJ, 150, 201
Jewitt, D., & Luu, J. 2019, ArXiv e-prints [arXiv:1910.02547] Jewitt, D., Luu, J., Rajagopal, J., et al. 2017,ApJ, 850, L36
Kareta, T., Andrews, J., Noonan, J. W., et al. 2019, ApJL, submitted [arXiv:1910.03222]
Langland-Shula, L. E., & Smith, G. H. 2011,Icarus, 213, 280
Levison, H. F., Duncan, M. J., Brasser, R., & Kaufmann, D. E. 2010,Science, 329, 187
Meech, K. J., Weryk, R., Micheli, M., et al. 2017,Nature, 552, 378
Micheli, M., Farnocchia, D., Meech, K. J., et al. 2018,Nature, 559, 223
Moulane, Y., Jehin, E., Opitom, C., et al. 2018,A&A, 619, A156
Opitom, C. 2016, PhD Thesis, Université de Liège, Belgium
Opitom, C., Guilbert-Lepoutre, A., Jehin, E., et al. 2016,A&A, 589, A8
Opitom, C., Snodgrass, C., Fitzsimmons, A., et al. 2017,MNRAS, 469, S222
Osip, D. J., A’Hearn, M., & Raugh, A. 2003,NASA Planetary Data System, EAR-C-PHOT-5-RDR-LOWELL-COMET-DB-PR-V1.0
Schleicher, D. G. 2008,AJ, 136, 2204
Schleicher, D. G. 2010,AJ, 140, 973
Schleicher, D. G., & A’Hearn, M. F. 1988,ApJ, 331, 1058
Schleicher, D. G., & Bair, A. N. 2011,AJ, 141, 177
Solontoi, M., Ivezi´c, Ž., Juri´c, M., et al. 2012,Icarus, 218, 571
Trilling, D. E., Mommert, M., Hora, J. L., et al. 2018,AJ, 156, 261
Villanueva, G. L., Smith, M. D., Protopapa, S., Faggi, S., & Mandell, A. M. 2018,J. Quant. Spectr. Rad. Transf., 217, 86