EUROPEAN SCHOOL FOR ADVANCED STUDIES IN REDUCTION OF SEISMIC RISK
ROSESCHOOL
ANALYSIS OF CODE PROCEDURES FOR SEISMIC
ASSESSMENT OF EXISTING BUILDINGS:
ITALIAN SEISMIC CODE, EC8, ATC-40, FEMA356, FEMA440
An Individual Study Submitted in Partial Fulfillment of the Requirements for the PhD Degree in
EARTHQUAKE ENGINEERING
By
BOYAN MAHAYLOV
Supervisor: Dr. LORENZA PETRINI
The Individual Study entitled, “Analysis of Code Procedures for Assessment of Existing Buildings: Italian Seismic Code, EC8, ATC-40, FEMA356, FEMA440”, by Boyan Mihaylov, has been approved in partial fulfillment of the requirements for the Doctor of Philosophy Degree in Earthquake Engineering.
Lorenza Petrini______________________
ABSTRACT
It is widely recognized that ground shaking may induce unacceptable levels of damage in existing buildings located in seismic regions. This vulnerability has been attributed to several reasons, such as insufficient strength and stiffness, poor detailing, irregularities in plan and elevation, domination of brittle failure modes over ductile ones, etc. On account of that, seismic assessment of existing buildings is adopted as a problem which needs specific treatment in building codes.
The present study analyzes five codes for assessment of existing buildings: the Italian seismic code, EC8, FEMA356, ATC-40 and FEMA440. The analysis of each code is performed within a common theoretical frame. The code assumptions and simplifications are pointed out together with their possible inconsistencies and weaknesses. Comparisons between the different procedures are performed as well. The most important outcomes stress insufficiencies in the analysis procedures as well as in the criteria for choice of model dimension and analysis type, consideration of dynamic P-∆ effects, in non-linear modeling, shear resistance evaluation, and application of force-based procedures.
ACKNOWLEDGEMENTS
I would like to thank Dr. Lorenza Petrini for her kind assistance and precious advices during all the stages of this work.
TABLE OF CONTENTS
ABSTRACT ...I ACKNOWLEDGEMENTS... II TABLE OF CONTENTS... III LIST OF FIGURES ... V LIST OF TABLES... VII
1. INTRODUCTION ...1
2. PERFORMANCE LEVELS AND PERFORMANCE OBJECTIVES ... 2
2.1 Building performance levels... 2
2.2 Rehabilitation objectives ... 4
3. KNOWLEDGE LEVELS ... 6
4. STRUCTURAL MODELING AND ANALYSIS PROCEDURES... 8
4.1 Analysis procedures... 8
4.1.1 Displacement-based analysis procedures ... 8
4.1.1.1 Linear static procedure ... 8
4.1.1.2 Linear dynamic procedure... 10
4.1.1.3 Nonlinear dynamic procedure ... 11
4.1.2 Force-based linear procedures- Italian seismic code and EC8 ...11
4.2 2D versus 3D models... 11
4.3 Choice of analysis procedure... 14
4.4 P-∆ effects...16
4.5 Horizontal torsion ... 18
4.6 Multidirectional effects... 20
4.7 Summary...22
5. NON-LINEAR STATIC PROCEDURE ... 25
5.1 Non-linear modeling... 25
5.3 Solution of SDOF systems... 34
5.4 Solution of MDOF systems ... 48
6. ACCEPTANCE CRITERIA... 53
6.1 Primary and secondary components ... 53
6.2 Deformation-controlled and force-controlled actions... 54
6.3 Deformation limits and force capacities values... 55
6.4 Displacement-based analysis procedures... 55
6.4.1 Linear analysis procedures ... 55
6.4.2 Non-linear analysis procedures ... 62
6.5 Force-based linear procedures- Italian seismic code and EC8 ...63
7. CONCLUSION...64
LIST OF FIGURES
Figure 4.1. Criteria for regular distribution of mass and stiffness in plan acc. to EC8: a)
Interpretation of e0x to rx ratio; b) Limits on eox/rx and ls/rx ratios ...13
Figure 4.2. Static and dynamic P-∆ effects...16
Figure 4.3. Amplification of the torsional effects due to strength irregularity ...19
Figure 5.1. Typical plastic hinge M-θ relationships: a) beams; b) columns...26
Figure 5.2. Plastic zone length: a) beams; b) columns ...27
Figure 5.3. Shear force, carried through concrete mechanisms: a) beams (ACI-318); b) columns...29
Figure 5.4. Typical joint V-γ relationships: a) interior; b) other ...31
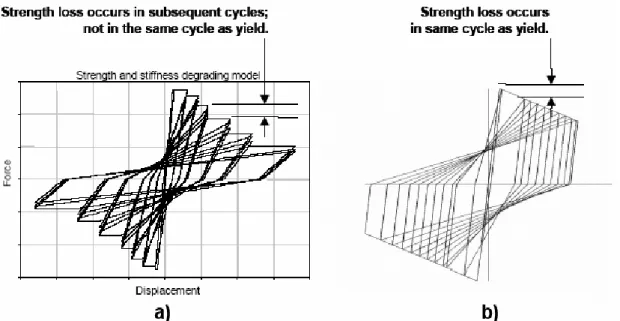
Figure 5.5. Types of strength degradation: a) Cyclic strength degradation; b) In-cycle strength degradation...31
Figure 5.6. Capacity curve: a) bi-linear idealization; b) hysteretic model...34
Figure 5.7. Displacement Modification Technique: a) δmax=Sd(T0); b) δmax=Sd(T0)C1; c) δmax=Sd(T0)C1C2; d) δt=Sd(T0)C1C2C3...36
Figure 5.8. Non-linear static procedures: a) DCM acc. to FEMA356; b) CSM acc. to ATC-40; c) CSM acc. to FEMA440 ...38
Figure 5.9. ATC-40- degradation effects: a) Influence of the quality of the seismic resistance system; b) Influence of the post-yield stiffness ratio αmax...40
Figure 5.10. CSM- Solution in ADRS coordinate system...41
Figure 5.11. Types of hysteretic behaviour, used for evaluation of FEMA356 DCM and ATC-40 CSM ...42
Figure 5.13. Dynamic stability: a) maximum strength ratio; b) in-cycle degradation stiffness
ratio ...44
Figure 5.14. Types of hysteretic behaviour, considered by the improved CSM ...45
Figure 5.15. Improved CSM- Solution in ADRS coordinate system ...46
Figure 5.16. Maximum strength ratio according to FEMA356 and FEMA440 ...48
Figure 5.17. C3 coefficient according to FEMA356 and FEMA440 ...48
Figure 5.18. Imposed displacements analysis and push-over analysis ...50
Figure 5.19. Equivalent SDOF system (ESDOF) ...50
Figure 6.1. Component force versus deformation curves ...54
Figure 6.2. Definition of chord rotation: a) beams; b) columns ...57
Figure 6.3. Limiting chord rotations ...57
Figure 6.4. Beam under monotonic loading...59
Figure 6.5. Beam under cyclic loading ...59
Figure 6.6. Simplified calculation of the chord rotations: a) general; b) beams; c) columns...60
Figure 6.7. Joints strength verification ...61
LIST OF TABLES
Table 2.1 Target building performance levels and ranges...2
Table 2.2 Common target building performance levels...3
Table 3.1 Knowledge factors acc. to FEMA356...6
Table 3.2 Confidence factors acc. to Italian seismic code...7
Table 3.3 Partial safety factors acc. to EC8 ...7
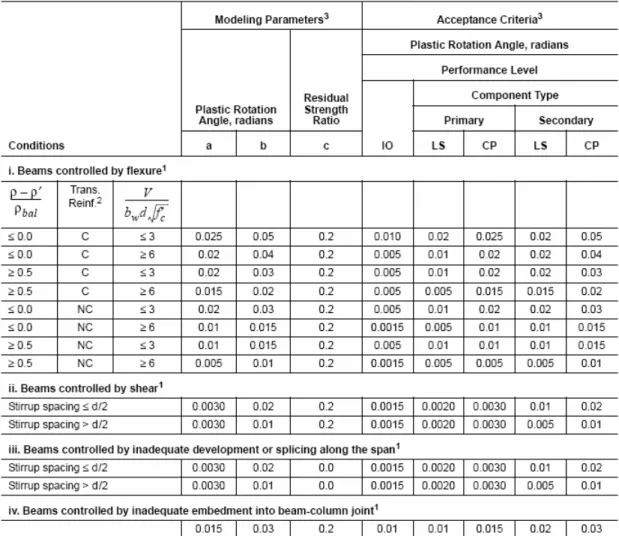
Table 5.1 Plastic rotations- beams ...29
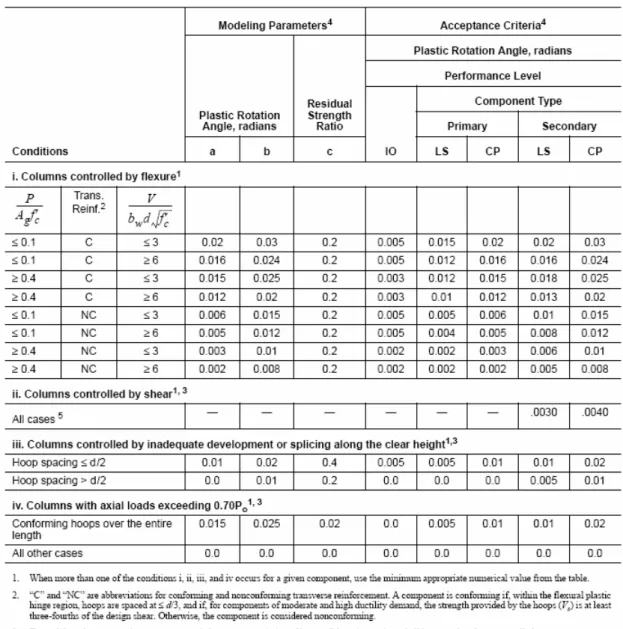
Table 5.2 Plastic rotations- columns...30
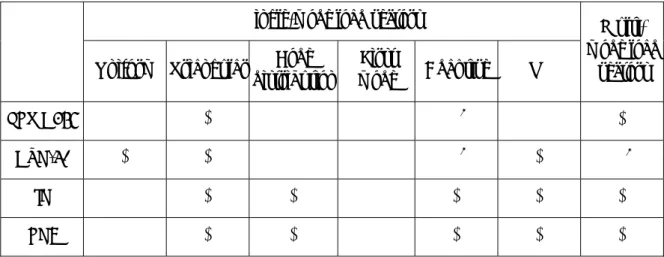
Table 5.3 Load vectors...33
1. INTRODUCTION
It is widely recognized that ground shaking may induce unacceptable levels of damage in existing buildings located in seismic regions. This vulnerability has been attributed to several reasons, such as insufficient strength and stiffness, poor detailing, irregularities in plan and elevation, domination of brittle failure modes over ductile ones, etc. On account of that, seismic assessment of existing buildings is adopted as a problem which needs specific treatment in building codes. Such codes are applied in several countries with high levels of seismic hazard- Japan, New Zealand, USA, etc. In Europe, recommendations are given in Eurocode 8 – Part 3. Code procedures for assessment and strengthening of existing buildings have been recently developed also in Italy.
The objective of the current work is to summarize, interpret, and compare the procedures for seismic assessment of existing buildings according to the Italian Seismic Code, EC8, ATC-40, FEMA 356, and FEMA 440. This work is focused on the problems of performance levels and performance objectives; knowledge levels; analysis procedures; 2D versus 3D modeling; P-∆ effects; horizontal torsion; multidirectional effects; and acceptance criteria. Each of these issues is discussed in the following manner. First, the problem is defined and analyzed with no reference to any particular code. The controlling factors are identified and their effect is presented qualitatively or in terms of general expressions. Second, the code procedures are exposed and interpreted within the above general frame. Last, the procedures are compared and possible critical points are pointed out.
Among the different analysis procedures, emphasis is put on the non-linear static procedure, considered to be a reasonable compromise between the simplistic linear procedures and the most realistic and complex non-linear dynamic procedures. In terms of material and structural types, the work is mainly focused on reinforced concrete frame structures.
2. PERFORMANCE LEVELS AND PERFORMANCE
OBJECTIVES
2.1 Building performance levels
Building performance levels or ultimate states are chosen discrete levels of building damage under earthquake excitation.
• FEMA356
FEMA356 defines five structural (S-1 to S-5) and four non-structural (N-A to N-D) performance levels (see the first row and first column of Table 2.1), describing qualitatively and quantitatively the damage, associated with each of them. The structural performance levels concern the damage of the vertical and horizontal lateral-force-resisting elements, while the non-structural levels are related to architectural, mechanical and electrical components.
One of the criteria for damage characterization of the vertical lateral-force-resisting elements is the interstorey drift, with the following approximate values for concrete frames:
- Collapse Prevention Structural Performance level (CP SPL)- 4% transient or permanent drift;
- Life Safety SPL- 2% transient and 1% permanent;
- Immediate Occupancy SPL- 1% transient and negligible permanent interstorey drifts.
Any combination of structural and non-structural performance level defines a building performance level (see Table 2.1). Four common building performance levels, named Operational (1-A), Immediate Occupancy (1-B), Life Safety (3-C) and Collapse Prevention (5-E), are described in Table 2.2. They, together with the levels denoted as 2-B, 1-C, etc in Table 2.1, represent the range of possible retrofit goals (target building performance levels). “Not recommended” are the combinations, which involve high structural and low non-structural damage or vice versa.
Table 2.2 Common target building performance levels
• Italian seismic code
The Italian seismic code defines three limit states, related to structural and non-structural damage:
- Collapse Limit State (CO). The structure is heavily damaged. The residual resistance is sufficient to carry gravity loads only. The majority of the non-structural elements are destroyed. The building has significant tilting and cannot sustain further seismic excitations.
- Severe Damage (DS). The structure has undergone significant damaged and resistance reduction. The non-structural elements are damaged, although the partition walls are not collapsed. The structure shows permanent deformations and generally is uneconomic to repair.
- Limited Damage (DL). The structure is only slightly damaged with insignificant plastic deformations. Repair of structural components is not necessary, since their resistance and stiffness are not compromised. The non-structural elements have cracks, but they can be economically repaired. The residual deformations are negligible.
• EC8
EC8 defines limit states of Near Collapse (NC), Significant Damage (SD) and Damage Limitation (DL), essentially corresponding to CO, DS, and DL limit states in the Italian seismic code.
• Comparisons and comments
The limit states of Collapse (CO), Severe Damage (DS) and Limited Damage (DL) in the Italian seismic code, can be assumed as approximately equivalent to the FEMA356 common building performance levels of Collapse Prevention (CP), Life Safety (LS) and Immediate Occupancy (IO) respectively.
2.2 Rehabilitation objectives
A seismic rehabilitation objective for a given building consists of one or more rehabilitation goals. Each rehabilitation goal represents target building performance level for given earthquake hazard level.
• FEMA356
FEMA356 defines three types of rehabilitation objectives: Basic Safety Objective (BSO), Enhanced and Limited rehabilitation objectives (see Table 1.3). The Basic Safety Objective includes achievement of Life Safety and Collapse Prevention performance levels under earthquake excitations with probability of exceedance in 50 years, equal to 10% and 2% respectively. In comparison with BSO, the Enhanced rehabilitation objectives provide improved building performance (higher performance levels for given seismic hazard levels), while the Limited performance objectives mean worse performance (lower performance levels for given seismic hazard levels). FEMA356 does not give recommendations for choice of rehabilitation objective.
• Italian seismic code
The Italian seismic code defines the following rehabilitation goals:
- DL LS- earthquake excitation with probability of exceedance 50% in 50 years, used for Ultimate Limit State (SLU) design of new buildings;
- DS LS- 10%/ 50 years, used for Damage Limitation State (SLD) design of new buildings;
- CO LS- 2%/ 50 years.
The seismic hazard levels can be additionally changed by multiplying the peak ground acceleration (PGA) by importance factor.
The PGA, needed for Collapse Limit State evaluation, can be obtained by amplifying the PGA for Severe Damage Limit State with 50%.
The Italian seismic code allows the assessment to be performed for DL LS and CO LS only. • EC8
EC8 recommends the following rehabilitation goals:
- LS of Damage Limitation- 20%/50 years;
- LS of Significant damage- 10%/50 years;
- LS of Near Collapse- 2%/50 years.
EC8 does not give recommendation if all the three limit states should be evaluated. • Comparisons and comments
FEMA356 gives larger range of possible performance objectives, than the Italian seismic code and EC8.
Evaluations for all the three limit states, included in the Italian seismic code and EC8 is equivalent to Enhanced Performance Objective according to the FEMA356 terminology (see Fig. 1.3). The rehabilitation goals in the Italian seismic code correspond to goals p, k and a, while EC8 aims at p, k and f.
3. KNOWLEDGE LEVELS
The knowledge about the as-built condition of the building (geometry, detailing, material properties, presence of any degradation, etc), is classified as a particular level, according to the source of the collected information. The lower the knowledge level, the more conservative the applied assessment procedure should be. This principle is put into practice by modifying the component capacities using knowledge factors, confidence factors or partial safety factors (see 6.3).
The non-linear analysis procedures (see 4.1.1.3 and 5) require detailed information about the properties of the structure, and therefore, are not applicable when the knowledge level is low. • FEMA356
FEMA356 classifies the knowledge as Minimum, Usual or Comprehensive level, according to the available documentation (design drawings/ construction documentation), condition assessment performed (visual/ comprehensive) and material properties source (drawings/ documents/ usual tests/ comprehensive tests/ default values).
When BSO or Limited rehabilitation objective is chosen, Minimum and Usual knowledge levels should be allowed, while an Enhanced rehabilitation objective requires at least Usual knowledge level to be achieved. The knowledge factor values are shown in Table 3.1.
Table 3.1 Knowledge factors acc. to FEMA356
Rehabilitation
objective BSO or Limited Enhanced
Knowledge level Minimum Usual Usual Comprehensive
Knowledge factor k 0.75 1.0 0.75 1.0
Non-linear analysis procedures are not applicable in the case of Minimum knowledge level. • Italian seismic code
The Italian seismic code classifies the knowledge as Limited (LC1), Adequate (LC2) or Accurate (LC3) level, according to the source of the information on: geometry and reinforcement (original drawings/ visual or full investigation), structural details (design simulation/ limited, extensive or comprehensive in-situ verification/ incomplete or complete set of construction drawings), material properties (common values/ original certificates of executed tests/ original design specifications/ limited, extensive or comprehensive in-situ tests).
Table 3.2 Confidence factors acc. to Italian seismic code
Knowledge level Limited (LC1) Adequate (LC2) Accurate (LC3)
Confidence factor
FC 1.35 1.20 1.0
Non-linear analysis procedures are not applicable in the case of Limited (LC1) knowledge level.
• EC8
The knowledge levels in EC8 have essentially the same definition as the Limited (LC1), Adequate (LC2) and Accurate (LC3) levels in the Italian seismic code, but are named Limited (KL1), Normal (KL2) and Full (KL3) respectively.
For each knowledge level, EC8 recommends respective partial safety factors (PSF) for the material properties (see Table 3.3), instead of the global knowledge and confidence factors in FEMA356 and Italian seismic code.
Table 3.3 Partial safety factors acc. to EC8
Knowledge level Limited (KL1) Normal (KL2) Full (KL3)
PSF- definition 1.20γm1 1.0γm 0.8γm
PSF - concrete 1.80 1.50 1.20
PSF- reinforcing
steel 1.38 1.15 0.92
1- γm is the partial safety factors for the material properties, recommended in EC8 for seismic design of new
buildings.
Non-linear analysis procedures are not applicable in the case of Limited (KL1) knowledge level.
• Comparisons and comments
Different from FEMA356, the Italian seismic code and EC8 do not require achievement of knowledge higher than Limited level when the rehabilitation objective is equivalent to Enhanced rehabilitation objective in FEMA356 (see 2.2).
4. STRUCTURAL MODELING AND ANALYSIS
PROCEDURES
4.1 Analysis procedures
The analysis procedures for assessment of existing buildings can be divided in two groups: displacement-based procedures (see 4.1.1) and force-based procedures (see 4.1.2).
4.1.1 Displacement-based analysis procedures
The displacement-based procedures are aimed to predict the elastic and inelastic deformation demands, imposed on the structural components by design seismic excitation.
FEMA356, Italian seismic code and EC8 include the following four analysis procedures:
- Linear Static Procedure (LSP);
- Linear Dynamic Procedure (LDP);
- Non-linear Static Procedure (NSP);
- Non-linear Dynamic Procedure (NDP).
LSP, LDP and NDP are briefly summarized in 4.1.1.1 to 4.1.1.3. The Non-linear Static Procedures according to FEMA356, FEMA440, ATC-40, Italian seismic code and EC8 are exposed in details in.5.
For applicability limits of the procedures- see 4.3.
4.1.1.1 Linear static procedure
The structure is modeled as linearly elastic with secant stiffness through the yield point. Pseudo lateral load is applied statically at the floor levels. The magnitude of the load is intended to result in the deformation demands which would be caused by design earthquake. The load is referred as “pseudo”, since it induces internal forces with no physical meaning for components working in the inelastic range. Fundamental assumption of the method is that the structural components possess infinite inelastic deformation capacity.
• FEMA356
The base shear, caused by the pseudo lateral load is given as:
(4.1) V =C1C2C3(CmSaM.g). Where:
- M is the total mass of the building;
- Sa(T),[g] is the elastic pseudo-acceleration spectrum value, corresponding to the fundamental natural period T;
- CmSaM.g is the maximum base shear, corresponding approximately to the base shear of the elastic system responding in its fundamental mode.
Three methods for evaluation of the fundamental period are proposed- analytical (eigenvalue analysis), empirical and approximate.
The expression in the brackets of formula (4.1) alone would give the first order elastic response of the structure to design earthquake. The coefficients C1, C2 and C3 are intended to: - C1- relates expected maximum inelastic deformations to deformations based on linear elastic theory;
- C2- represents the effects of pinched hysteresis shape;
- C3- accounts for increased displacements due to dynamic P-∆ effects.
In addition to that, the static P-∆ effects should be considered. Detailed information about the P-∆ effects (static and dynamic) is given in 4.4.
The horizontal forces are distributed along the building height according to:
(4.2) M h m h m F n j k j j k i i i
∑
= = 1 Where:- mi(j)- mass located at floor level i (j);
- hi(j)- height from the base to floor level i (j).
The factor k is intended to reflect the dependence of the response deformed shape of the structure on its flexibility. It is a function of the fundamental period T. For short period structures (T≤0.5s), k is equal to 1, which means linear distribution of the horizontal displacements, while for T≥2.5s, k is equal to 2 and the profile of the floor displacements is parabolic. When the fundamental period is between 0.5s and 2.5s, linear interpolation is used for k value calculation.
• Italian seismic code The base shear is given as:
(4.3) V =λ.Sa(T)M.g
Where:
- Sa(T) and M- see (4.1);
The code recommends an empirical formula for evaluation of the fundamental period T.
The distribution of the horizontal forces along the height of the building follows linear presumed response shape of the structure.
• EC8
The only difference in comparison to the Italian seismic code is that EC8 recommends three methods for evaluation of the fundamental natural period T, similarly to FEMA356- analytical (eigenvalue analysis), empirical and approximate.
• Comparisons and comments
The Italian code and EC8 follow the equal displacement principle, assuming that the maximum displacements of the elastic and inelastic systems are equal. That can lead to underestimation of the displacement demands on short period structures. The two codes do not also account for dynamic P-∆ effects, but only for static P-∆ effects (see 4.4).
FEMA356 gives more precise distribution of the horizontal forces along the height of flexible buildings, compared to the Italian seismic code and EC8.
4.1.1.2 Linear dynamic procedure
The structure is modeled as linearly elastic with secant stiffness through the yield point. Solution is carried out by Response Spectrum Method with elastic spectrum. Model responses are combined through Square Root of Sum of Squares (SRSS) or Complete Quadratic Combination (CQC) rule. The obtained deformations are adjusted to or just interpreted as the expected demands (elastic and inelastic), imposed on the structure by design earthquake. • FEMA356
The deformations, obtained through Response Spectrum Method with elastic spectrum, are amplified by coefficients C1, C2 and C3 to reflect the phenomena as inelastic response, pinching and dynamic P-∆ effects (see 4.1.1.1). Static P-∆ effects are also accounted for. • Italian seismic code and EC8
The deformations, obtained through Response Spectrum Method with elastic spectrum, are adopted as expected demands under design earthquake.
• Comparisons and comments
The comparisons and comments about the equal displacement principle and dynamic P-∆ effects, made for LSP, are also applicable here (see 4.1.1.1).
4.1.1.3 Nonlinear dynamic procedure
The structural model directly incorporates the non-linear cycle force-deformation relations of the components of the building. The response is directly obtained through numerical integration of the equations of motion, using accelerograms to represent the ground motion.
The Nonlinear Dynamic Procedure is considered the most realistic tool for assessment of the structural behaviour under earthquake excitation.
4.1.2 Force-based linear procedures- Italian seismic code and EC8
The force-based linear procedures are aimed to predict the minimum strength of the structural components, needed to insure the safety of people under design earthquake.
The solution follows the LSP or LDP (see 4.1.1.1 and 4.1.1.2), but using reduced pseudo-acceleration response spectrum, accounting for the ability of the structure to work safely in inelastic regime. The reduced spectrum is obtained from the elastic spectrum using reduction factor q. In general, q depends on many factors such as local ductility and energy dissipation capacity of the structural components, prevailing failure modes, redundancy of the system, structural regularity in plan and elevation, geometry, etc. The applicability of the q-factor approach for design of new buildings is justified since the above parameters can be controlled, to some extend, during the design process. In the case of existing buildings however, the evaluation of proper value of the force reduction factor is very difficult task. On account of that, EC8 is very conservative- q=1.5 irrespectively of the structural properties. The Italian seismic code suggests values from 1.5 to 3 without criteria for choice of exact number.
The above considerations are the probable reason why FEMA356 and ATC-40 do not include force-based linear procedure as a tool for assessment of existing buildings.
4.2 2D versus 3D models
The choice of model dimension depends first on the in-plan diaphragm flexibility. The criteria for assessment of the diaphragm flexibility are based on its influence on the seismic demands, imposed on the lateral-force-resisting elements. Many factors influence the diaphragm flexibility: the shape of the floors, the type of the diaphragm and lateral-load-resisting system, the arrangement of the vertical elements in plan, etc. In general, the diaphragms can be classified as rigid (with negligible in plane distortions), flexible (with negligible in-plane stiffness) and stiff (intermediate case).
Buildings with rigid diaphragms can be modeled with 2D models in the two orthogonal structural directions, providing the floor rotations do not considerably increase demands on the structural components in comparison to the demands caused by average floor translations. The magnitude of floor rotations depends mainly on mass, stiffness and strength regularity in plan. Floor mass can be lumped in the floor mass center.
Buildings with flexible diaphragms can be modeled with 2D models, since the response of the lateral-load resisting elements (frames, walls, etc.) is almost independent. Floor mass is distributed among the elements according to the tributary areas.
Buildings with stiff diaphragms should be modeled with 3D models, accounting explicitly for diaphragm flexibility and mass distribution.
In any case, 2D models are not applicable for structures with non-orthogonal bracing system.
Generally, spatial models are preferable to planar models. • FEMA356
Diaphragms are classified according to the ratio of the maximum in-plan diaphragm deformations and average interstorey drift of the vertical lateral-force-resisting elements. They are rigid if the ratio is less than 0.5, flexible- ratio more than 2, and stiff- ratio from 0.5 to 2. The diaphragm deformations and the average drift are evaluated using LSP. The horizontal forces are distributed over the floors planes according to the distribution of mass. The extent of floor rotations is assessed, using η coefficient, defined as:
(4.4) η =max(δi,max /δi,avg)
where the ith floor horizontal displacements δi,max and δi,avg are denoted on Figure 4.1.a.
ηx and ηy are evaluated separately for excitation in x and y direction respectively. If the value of η is larger than 1.5 in any of the two orthogonal directions, 3D model should be used. • Italian seismic code
Buildings are classified as regular or irregular in plan. Only regular buildings can be modeled with two planar models in the two orthogonal directions. The criteria for regularity include the in-plan stiffness of the diaphragms with respect to the lateral stiffness of the vertical elements, as well as in-plan mass and stiffness symmetry and compactness. Criteria related to the shape of the floors are also given. Buildings with diaphragms different than rigid are classified as irregular and consequently, should be modeled with spatial models.
• EC8
In addition to Italian code criteria, EC8 defines quantitative assessment of diaphragm flexibility and in-plan mass and stiffness regularity.
The diaphragm is taken as being rigid, if the floor displacements of the building, modeled with deformable diaphragms, do not exceed with more than 10% the floor displacements of the building, modeled with rigid diaphragms.
The mass and stiffness are regularly distributed in plan if:
(4.5) 1 / 3 . 0 / 0 ≥ ≤ s x x x l r r e
where eox is the eccentricity of mass center (CM) with respect to center of rigidity (CR) (see Figure 4.1.a), rx is the torsional radius and ls is the radius of gyration of the floor mass in plan.
CM CR θ diaphragm rigid e 0x x r A 0x e / rx l /s rx (3.6) (3.5) a) b) max δ avg δ A δ CR δ
Figure 4.1. Criteria for regular distribution of mass and stiffness in plan acc. to EC8: a) Interpretation of e0x to rx ratio; b) Limits on eox/rx and ls/rx ratios
The physical meaning of the two criteria can be explained for one-storey building (3 DOF system). The first expression is the ratio of the displacement of point A due to rotation around the center of rigidity (CR) and the CR displacement (see Figure 4.1.a). It shows the amplification of the drift demands due to floor rotations when only translation inertia is accounted for. The second expression is the ratio of the natural vibration frequency associated with the rotational mode and that, associated with the translational mode of vibration, under the assumption that CM and CR coincide. It reflects the possibility for increased drifts demands due to rotation inertia.
The proof of the above interpretation is shown bellow:
(4.6) x x x x x y x x y x x CR A r e r r e k k r e k E k r e E 0 2 0 0 0 / / / . = = = = θ θ δ δ , (4.7) s x m y y m y l r M J k k m k J k = = = / / / / θ θ θ ω ω ,
where kθ is the rotational stiffness of the system, ky is the translational stiffness in y direction,
M is the mass and Jm is the mass moment of inertia.
Even if the structure is not classified as regular, 2D models can be used, providing that several conditions are met. They concern the rigidity of partition walls, building height and diaphragm rigidity. Expressions (4.5) are replaced with more liberal expression (4.8) (see Figure 4.1.b): (4.8) 2 2 2 s ox x e l r ≥ +
• Comparisons and comments
FEMA356 does not give recommendations about the analysis type used for η coefficient evaluation. Neither of the codes takes into account strength distribution in plan as a property of the structure that can trigger rotational response.
The Italian code does not give quantitative criteria for diaphragm flexibility and in-plan mass and stiffness regularity.
4.3 Choice of analysis procedure
Static procedures are applicable when no significant participation of higher modes is expected. The load patterns, used for static analyses, are not able to reflect the deformed shaped of the structure when higher mode effects are involved. The higher mode participation depends mainly on the mass and stiffness regularity and on the allocation of the natural periods of the structure with respect to earthquake predominant periods. Structures with non-orthogonal lateral-force-resisting system should be analyzed with dynamic procedures.
Linear procedures (LSP and LDP) should predict the magnitude and distribution of the displacement demands due to non-linear response of the structure under design earthquake. Therefore, they are applicable when the structure remains almost elastic or when expected non-linear deformations are uniformly distributed allover the building (no weak-storey mechanisms or severe inelastic torsion are present). Demand to Capacity ratios (DCRs), based on linear analysis, can be used for assessment of the distribution of inelastic deformations. • FEMA356
The applicability of the LSP instead of LDP is proved if four conditions for mass and stiffness regularity in plan and along the height are met:
(1)The building does not have severe torsional stiffness irregularity.
(2)The building does not have severe vertical mass or stiffness irregularity.
(3)The ratio of the dimensions of adjacent storeys should not exceed 1.4.
(4)The building has orthogonal lateral-force-resisting system.
The first two criteria are based on the distribution of the drifts (in plan and along the height respectively) from LSP.
In addition to that, the fundamental natural period of the structure T should be:
(4.9) T ≤3.5Ts
where Ts is the period separating the constant acceleration from constant velocity region of the pseudo-acceleration response spectrum.
Linear analyses can be applied if the structure remains nearly elastic: (4.10) DCRs≤2.
Otherwise, uniform distribution of inelastic deformation should be proved. The check is subdivided into two:
(1)Severe weak storey irregularity- the ratio of the average storey DCRs of adjacent storeys should be not more than 1.25.
(2)Severe in-plan discontinuity irregularity- the ratio of the component DCRs in one storey should not be more than 1.5.
The force demands are calculated for linear elastic behaviour of the structure (C1=C2=C3=1). DCRs are based on the critical component action (such as axial force, flexure, shear). The component DCRs participate in the average storey DCR proportionally to the shear force they attract, i.e. DCRs of stiffer elements have more importance. If stiffer component enters in the inelastic range, the reduction of the total storey stiffness is larger than that in the case of softer element yielding.
In addition to (1) and (2), specific verification is included for RC frame structures:
(3) The average DCRs of columns in a storey should not exceed the average DCRs of the beams above the storey if the column ductility demands are more than half of their ductility capacity. The calculation of the column ductility capacity and ductility demand is discussed in 6.4.1.
NDP should be preferred to NSP if:
(4.11) V90%/V1st >1.3 Where:
- V90%- storey shear forces from LDP and modes giving 90% mass participation; - V1st- storey shear forces based on first mode only.
Even when that condition is met, NSP can still be applied, but together with LDP. In that way the higher mode effects are accounted for to some extent.
• Italian seismic code
Usage of LSP instead of LDP is allowed when the structure is classified to be regular in elevation and the first natural vibration period T is less than 2.5Ts. Regularity is proved if several criteria for stiffness, mass and strength distribution along the height of the building are met.
The liner procedures are applicable, if the following two conditions are observed: (4.12) DCRmax/DCRmin≤2.5 for deformation-controlled actions;
(4.13) DCRs≤1 for the force-controlled actions.
The deformation- and force-controlled actions (also referred as ductile and brittle mechanisms) are defined in 6.2.
DCRmax and DCRmin are the maximum and minimum Demand-to-Capacity Ratios among the DCRs with values larger than 2. The force demands on the brittle mechanisms are obtained from the analysis if no yielding associated with the adjacent ductile mechanisms is expected. Otherwise, the limit-analysis principles should be followed.
The Italian seismic code does not impose any limitation on the applicability of the force-based linear procedures.
• EC8
The differences between the Italian code procedure and EC8 procedure are the following:
(4.14) T1 ≤min(4Ts;2s)
(4.15) DCRmax/DCRmin≤2÷3 for the ductile mechanisms.
DCRmax and DCRmin are the maximum and minimum Demand-to-Capacity Ratios among the DCRs with values larger than 1.
• Comparisons and comments
EC8 and the Italian code include in-elevation strength distribution as a criterion for choice between LSP and LDP, although they both do not reflect the strength.
According to FEMA356 the structure remains nearly elastic when DCRs for ductile and brittle mechanisms have values less than 2. The Italian seismic code gives limiting value of 2 for ductile and 1 for brittle mechanisms. EC8 recommends unity for both force- and deformation- controlled actions, which is the theoretical limiting value. FEMA356 allows DCRs for brittle mechanisms to exceed unity, because the force demands are not based on limit-analysis principles, but on linear elastic analysis.
EC8 and the Italian code do not define limitations on the applicability of the Non-linear Static Procedure (NSP).
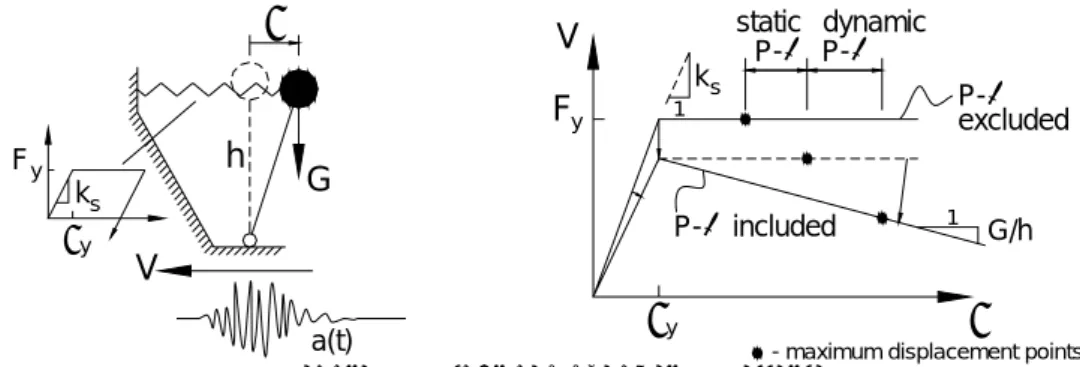
4.4 P-∆ effects
The increase of the deformation demands, due to the action of the gravity loads through the deformed configuration of the structure, is referred as P-∆ effects or also second order effects. The P-∆ effects can be subdivided into:
1) Static P-∆ effects- increased deformations due to the reduced strength and initial stiffness; 2) Dynamic P-∆ effects- increased deformations due to the negative post-yield stiffness. This can be demonstrated on the simple system, shown on Figure 4.2.
G V δ h Fy y δ s k a(t) δ V ks 1 δy y F static P-∆ P-dynamic ∆ ∆ P- included ∆ P-excluded
- maximum displacement points 1
G/h
• FEMA356
When linear procedures (LSP and LDP) are used, the P-∆ effects are accounted for through stability coefficient θ, evaluated for the linearly elastic structure (no Ci coefficients included):
(4.16) i i i i i h V Pδ θ = Where:
- Pi- the portion of the total weight of the building, acting on the vertical elements of the ith storey;
- δi- lateral drift in storey i, in the direction under consideration, at its center of rigidity;
- Vi- the total calculated storey shear force in the direction under consideration due to earthquake response;
- hi- storey height.
The stability coefficient gives approximately the ratio of the total storey moments, corresponding to the gravity loads and to the inertial forces.
If θi<0.1, the static P-∆ effects are negligible. When 0.1≤θi≤0.33, seismic forces and deformations in storey i shall be increased by factor 1/(1-θi). If θi>0.33, the structure should be considered unstable and rehabilitation measures are needed.
The dynamic P-∆ effects are accounted for through the coefficient C3 (see 4.1.1.1 and 4.1.1.2), which amplifies the seismic forces and deformations in addition to the 1/(1-θi):
(4.17) C3=1 if θ<0.1 and C3=1+5(θ-0.1)/T if θ≥0.1,
where θ is the maximum value of θi of all storeys.
The stiffer the structure (shorter fundamental period T), the more pronounced the dynamic P-∆ effect is. That trend can be explained by the simple structure from Figure 4.2. For fixed mass (which means also fixed gravity load), a structure with shorter natural period has larger ratio post-yield to initial stiffness and consequently is more sensitive to dynamic P-∆ effects. The role of the stability coefficient in (4.17) is similar. In the case of the structure from Figure 4.2 it is equal to the post-yield to initial stiffness ratio.
When NSP is used, the static P-∆ effects are accounted for directly in the push-over analysis by including geometric nonlinearity. The dynamic P-∆ effects are reflected through coefficient C3 (for details- see 5).
• Italian seismic code and EC8
The two codes account for the static P-∆ effects in the some way as FEMA356, but the dynamic P-∆ effects are not considered.
4.5 Horizontal torsion
Horizontal torsion is caused by non-symmetric distribution of mass, stiffness and strength, but even in “ideally” symmetric structures it can be provoked by rotational component of the excitation. The torsion based on the computed distribution and translational ground motion is called actual torsion. Accidental torsion is a consequence of unfavorable deviation from the assumed distributions and presence of rotational excitation component.
The actual torsion is directly accounted for when 3D models are applied. The accidental torsion could be considered by introducing accidental eccentricities to the inertial forces, i.e. by displacing the floor mass centers.
When 2D models are exploited, the actual and accidental torsion should be included indirectly by means of increased force/displacement demands.
• FEMA356
In the case of linear procedures, applied to 3D rigid floor models, ith storey accidental torsional moments are calculated as:
(4.18) Mai =Vxi5%Li +Vyi5%Bi
Where:
- Vxi and Vyi- storey shear forces from analysis;
- Li and Bi- dimensions of the diaphragm above the ith storey, perpendicular to Vix and Viy respectively.
The moments Mai are additionally multiplied by coefficient A=(η/1.2)2≤3 if η>1.2 (η is defined by (4.4) and should correspond to the main direction of the excitation). Torsional moments, corresponding to the torsional storey moments Mai, are then applied at the floor levels to obtain the component demands due to accidental torsion.
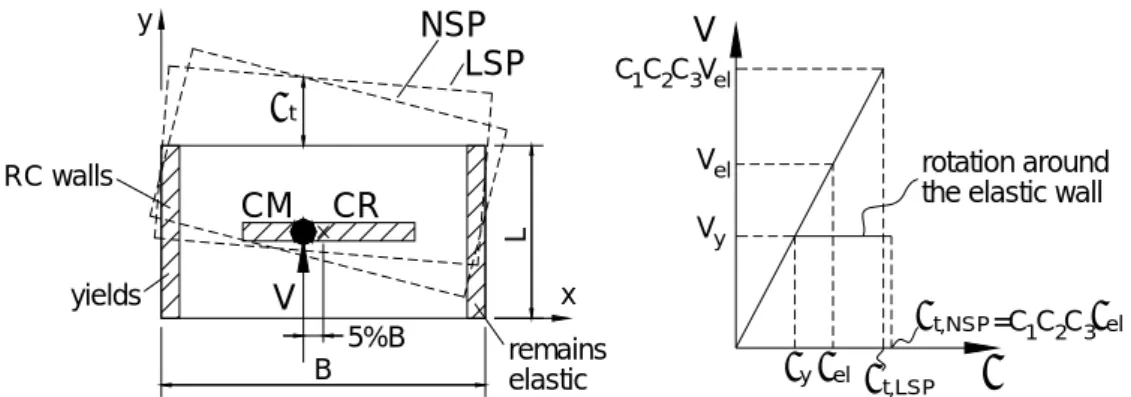
The A coefficient accounts for increased torsion due to strength irregularity, not reflected in the linear models. This effect can be demonstrated by the simple one-storey building, shown on Figure 4.3. The two RC walls in y direction are identical, but the accidental eccentricity introduces slight strength irregularity (the DCRs of the two walls are slightly different). LSP and NSP (see 4.1.1.1 and 5) predict similar average roof displacement, but LSP underestimates the rotations. Structures with low level of redundancy are likely to be more sensitive to this aspect.
CM 5%B CR B RC walls yields L x y elastic remains NSP LSP t δ y V el V V δ δy el δt,NSP δ C C C V1 2 3 el δt,LSP =C C C1 2 3 elδ the elastic wall rotation around
V
Figure 4.3. Amplification of the torsional effects due to strength irregularity
When non-linear procedures are applied to 3D rigid floor models, accidental torsion is accounted for by displacing the mass center (CM) of each floor in ±5%Li and ±5%Bi along y and x axes respectively.
Accidental torsion is not accounted for if 3D stiff or flexible floor models are used. This can be attributed to lesser sensitivity of these systems to changes in the distribution of mass- small shift of the mass center do not leads to as global effect as in case of rigid diaphragms.
When 2D models of buildings with rigid floors are used, actual and accidental torsional effects are taken into account approximately as follows:
- LSP and LDP- amplifying the force and deformation demands by ηx or ηy according to the direction of analysis concerned;
- NSP- amplifying the target displacement by ηx (ηy);
- NDP- amplifying the excitation, i.e. accelerogram, by ηx (ηy).
If a building with flexible diaphragms is analyzed by 2D model, no amplification is needed, since the lateral-force-resisting elements respond almost independently.
• Italian seismic code
Generally, the code recommends the accidental torsion in 3D models to be accounted for by displacing the mass center (CM) of each floor in ±5%Li and ±5%Bi along the y and x axes respectively.
For 3D linear procedures applied, the accidental torsion storey moments Mai are evaluated using (4.18), where Vxi and Vyi are obtained from LSP. This approach can not be applied to buildings with non-rigid diaphragms, since the concentrated moments on the floor levels would produce unrealistic diaphragm distortions.
When 2D linear models are used, the accidental torsion is accounted for as the force and deformation demands are amplified by factor δx or δy according to the plane of analysis:
(4.19) e x L x 6 . 0 1+ = δ Where:
- x- the distance of the component under consideration from the center of mass of the building in plan, measured perpendicularly to the direction of the seismic action;
- Le- the distance between the two outermost lateral-load-resisting components, measured perpendicularly to the direction of the seismic action.
The Italian code does not give recommendations for the evaluation of torsional effects in the case of 2D non-linear analyses.
• EC8
The only difference between EC8 and the Italian code is that δ coefficients are also used when 2D NSP is applied. In this case δ amplifies the target displacement.
• Comparisons and comments
When 3D models with non-rigid diaphragms are used, FEMA356 recommends no accidental eccentricities to be accounted for, while according to the Italian seismic code and EC8, the floor mass centers should be displaced in ±5%Li and ±5%Bi along the y and x axes respectively.
The evaluation of the torsional effects according to the three codes in case of 2D models is similar. The demands are amplified by coefficient η in FEMA356 and δ in the Italian code and EC8. The η coefficient reflects actual and accidental torsion, while δ is aimed to account for accidental torsion only. All the three codes imply that 2D analyses predict well the average floor displacements (η is the ratio of the maximum to average floor displacement and δ≈1 for components near the axis of the building). It seems that FEMA356 approach is conservative for components near the building axes.
The A coefficient in FEMA356 is aimed to capture the effect of inelastic torsional response. Consequently, it should be based on the strength distribution in the building plan rather than on the initial linear properties of the structure.
4.6 Multidirectional effects
The earthquake excitation has spatial character- it acts simultaneously in all the three orthogonal directions, imposing deformation demands on the building.
The concurrent action of the excitation along the two horizontal orthogonal axes should not be considered, when the building is symmetric in plan with independent orthogonal lateral-force-resisting systems. In that case, excitation along one of the structural axes would impose demands on the perpendicular bracing system due to accidental torsion only. These demands
are assumed to be negligible in comparison to the demands from excitation in the plane of bracing system under consideration.
When 3D models are analyzed by non-linear dynamic procedures, the equations of motions are numerically integrated for horizontal motion of the base.
Usually, the effects of the vertical component of the seismic excitation are neglected, since they are negligible in comparison with the forces due to gravity loads. Exceptions are particular cases, such as presence of large spans, long cantilevers, beams supporting columns, etc. These cases are not considered here.
• FEMA356
The structure is analyzed independently in the two orthogonal directions, accounting for P-∆ effects and horizontal torsion, and the demands are combined. When accidental torsion is considered by (4.18), it is added after the combination of the results from the two directions.
The combination rules are as follows:
- LSP and LDP- 100% of the forces and deformations from excitation in x direction plus 30% of the forces and deformations from excitation in y direction and vice versa;
- NSP and 2D NDP- forces and deformations associated with 100% of the design displacement from excitation in x direction plus forces associated with 30% of the design displacement from excitation in y direction and vice versa.
• Italian seismic code
With respect to the linear procedures, the Italian code recommends the same procedure as FEMA356.
When NSP or 2D NDP are used, no combination of the demands, obtained from independent analyses along the two orthogonal axes, should be considered.
• EC8
In addition to FEMA356 and the Italian code, EC8 permits also the SRSS combination rule to be applied, when linear analyses are used.
No recommendations are given for multidirectional effects in case of 2D NSP and 2D NDP.
If 3D NSP is used, “100%x+30%y” rule or SRSS rule should be applied for the forces and deformations, corresponding to the target displacements in the two orthogonal directions. • Comparisons and comments
The main difference between the three codes is the combination of the demands, obtained by independent NSP in the two orthogonal directions of 3D model (3D NSP). Any combination
does not have rigorous physical meaning, since path-dependent nonlinearity is present. The most conservative approach is adopted in EC8- both forces and deformations are combined (forces and deformations are used for verification of brittle and ductile mechanisms respectively- see 6.4.2). FEMA356 takes the safe side for brittle mechanisms only, assuming that this kind of failure is critical for the building safety. The most liberal is the Italian code, using the demands from unidirectional analyses.
EC8 allows application of the SRSS rule, which generally gives a safe side estimate of the probable values of actions, acting simultaneously with the action under consideration. For instance, a common column of two orthogonal moment-resisting frames in regular building should be checked for the maximum possible moments along its two principal axes, applied simultaneously.
4.7 Summary
The procedures for choice of model dimension and analysis type are presented here as flow charts. The issue of whether to account for horizontal torsion and multidirectional effects is referred too.
• FEMA356
• Italian seismic code
The procedure in Italian seismic code is very similar to that in EC8, presented in the following flow chart.
• EC8
• Comparisons and comments
The general FEMA356 procedure is based directly on the quantities that govern the structural response. This makes it difficult for practical application. Ideally, in order to check the applicability of 2D model for example, the designer should perform at least 3D linear static analysis accounting for deformability of the floors. Opposite, Italian seismic code and EC8 use indirect criteria, resulting in simple for application procedure.
5. NON-LINEAR STATIC PROCEDURE
The model directly incorporates the non-linear force-deformation relations of the structural components (material non-linearity) and accounts for P-∆ effects (geometric non-linearity). The structure is first subjected to gravity loads. Horizontal forces (load vector), representing the inertia forces, are then statically applied (push-over analysis). The analysis is carried-out under monotonically increasing control node displacement. The control node is usually located at the center of mass of the roof. The base shear is traced against the control node displacement (push-over curve or capacity curve), as each point of the curve represents possible state of the structure during an earthquake excitation.
The maximum probable control node displacement under design earthquake (target displacement or performance point) should be evaluated. The corresponding deformations and internal forces represent the seismic demand imposed on the structural components.
The target displacement is obtained by modification of the maximum displacement of a non-linear SDOF system, subjected to design earthquake excitation. This system is known as Equivalent Single Degree of Freedom (ESDOF) system and its properties (mass and force-displacement relationships) are obtained through transformation of the properties of the MDOF system (floor masses, modal parameters, push-over curve).
5.1 Non-linear modeling
The structure reaches the maximum state of deformations, undergoing a number of cycles at lower deformation levels. Therefore, the component force-deformation relationships should rather represent a backbone curve of the hysteretic response, than monotonic loading curve.
The backbone curve differs from the monotonic one, since the load-bearing mechanisms degrade with consecutive cycles of inelastic deformations (cycle strength degradation). The cyclic degradation depends mainly on the deformation history and the mechanism, governing the component response. The component deformation history is not known in advance and it is influenced by many factors, as global structural parameters, excitation type, etc. The effect of cyclic degradation is more pronounced in case of short-period buildings and long duration excitations, since the components experience large number of cycles. On the contrary, near field excitations do not provoke significant degradation.
The mechanisms of response are defined as ductile (deformation-controlled actions) and brittle (force-controlled actions) (see 6.1 and 6.2). It could be expected that the number of inelastic excursions decreases with decreasing component ductility capacity. At limit, when the ductility is 1, the first inelastic pulse causes component failure. Consequently, some brittle elements can be well represented by their monotonic force-displacement curves.
• FEMA356 and ATC-40
All the structural components (primary and secondary) should be included in the model. The given force-deformation relations correspond to earthquake loading, involving three fully reversed deformation cycles to design deformation levels, in addition to similar cycles to
lesser deformation levels. The properties should be modified, if increased number of design level cycles is expected as in case of short-period structures or long duration excitation.
For modeling of concrete beams and columns, FEMA356 proposes model with concentrated plastic hinges (lumped plasticity model). The locations of possible plastic hinges should be specified in advance (typically the ends of the element) and should be verified at the end of the analysis. A hinge opens when the bending moment reaches the yield moment of the section under consideration and closes when the hinge rotation changes its sign. The presumed locations of the hinges are realistic if the distribution of the bending moments is statically possible, i.e. the moments in the elastic region of the element are within the elastic limits.
The stiffness of the elastic part of the component should correspond to the secant value through its yield point. FEMA356 gives approximate values for flexural, shear and axial stiffness, expressed as a portion of the stiffness of the gross concrete section. The values for columns depend on the magnitude of axial force, since it affects the extent of cracking. The higher the compression force, the less the cracking, the higher the stiffness.
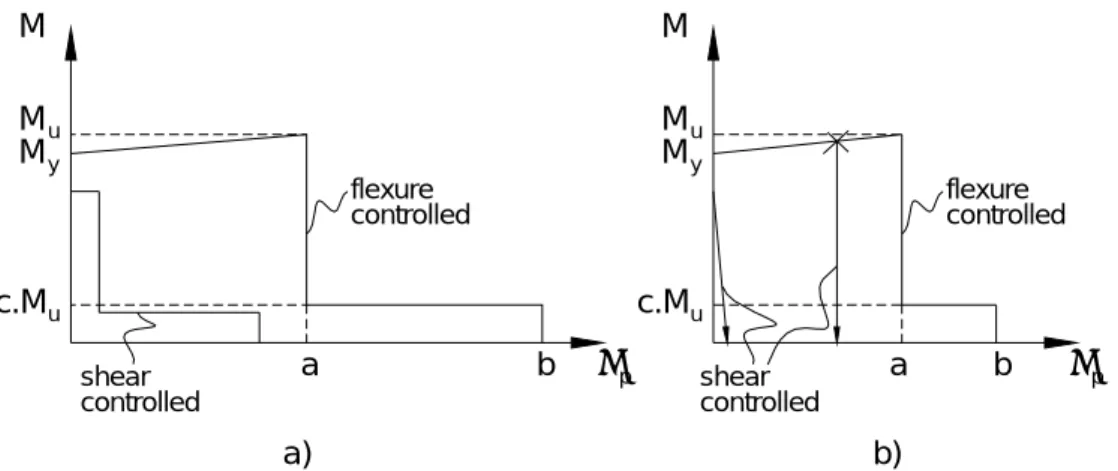
The hinge moment-rotation relationships, proposed in FEMA356, are schematically shown in Figure 5.1. M a b y Mu u c.M M θp flexure controlled controlled shear controlled shear a b θp c.M M M u u y M controlled flexure a) b)
Figure 5.1. Typical plastic hinge M-θ relationships: a) beams; b) columns
The yield moment My and the strength Mu of the section can be calculated using established principles of mechanics (equilibrium, material stress-strain relationships, plane sections hypothesis).
Plastic rotation a corresponds to significant resistance degradation and is associated with crushing of the compression zone of the section or steel rapture. Rotation b corresponds to total resistance degradation. It can be assumed that at this level of deformations the beams fail in shear along the flexural cracks, while the columns are not able to support gravity loads. In general, the rotation capacity of the plastic zones depends on their length and the capacity of the section to develop plastic deformations.
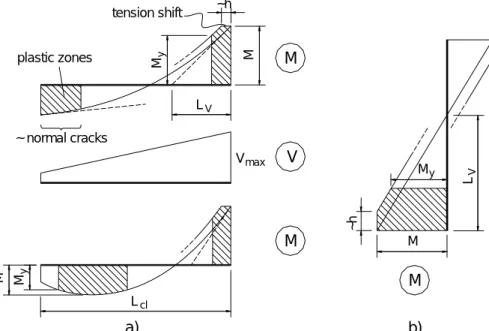
The plastic deformations are usually spread within the element near its ends (along normal and inclined cracks) and within the joint in which the element frames (steel yield penetration). Under the idealization that the cracks are normal to the element axis and the concrete does not possess tension strength, the length of the plastic zone within the element is:
(5.1) p y y LV M M V M M M L ⎟⎟ ⎠ ⎞ ⎜⎜ ⎝ ⎛ − = ⎟⎟ ⎠ ⎞ ⎜⎜ ⎝ ⎛ − ≈ 1 1 ,
where M and V are the internal forces at the end section and LV- shear span (see Figure 5.2). Expression (5.1) loses its validity when LV tends to infinity or when the plastic hinging does not occur near the end of the element. Presence of inclined cracks increases the plastic zones length (tension shift). The shift is proportional to the height of the section.
LV M My Lcl ~h tension shift ~ normal cracks My M ~h M My a) b) plastic zones M V Vmax M M LV
Figure 5.2. Plastic zone length: a) beams; b) columns
The capacity of the section to develop plastic deformations could be characterized by its plastic curvature. It generally increases with decreasing amount of tension reinforcement, increasing amount of compression reinforcement, increasing compression zone width, decreasing section height, decreasing compression force and increasing confinement of the concrete core.
In summary, the plastic rotation capacity of beam end regions is lower when the top reinforcement is in tension, because:
- the shear span LV is shorter as a consequence of the gravity loads (see Figure 5.2);
- the reinforcement at the top of the section is usually more than that at the bottom as a result of the gravity loads too;
- the bottom width of the section is much smaller than at the top (the sections are usually T-shaped).
The plastic rotation capacity of the column end regions is independent of the direction of hinge opening, since the sections are usually symmetric and the shear span does not very significantly during the response.
The plastic rotation capacities, proposed in FEMA356, are shown in Table 5.1 and Table 5.2 for beams and columns respectively. It should be pointed out, that the values are independent of the shear span and the height of the section, in contradiction to the considerations made above. At the other hand, the given capacities depend on the magnitude of shear at the hinge location. The higher the shear is, the lower the plastic rotation capacity. This tendency could be explained by the mechanism of force transfer at the face of the beam-column joint. A wide flexural crack forms at this location and almost all the shear force “passes” through the compression zone of the section, causing its earlier disintegration. This effect further supports the conclusion that the rotation capacity of the beam end regions is lower when the top reinforcement is in tension, because the shear reaches its maximum when yielding of the top reinforcement develops (see Figure 5.2).
If the behaviour of the end regions is controlled by inadequate embedment into the beam-column joint, the moment capacity of the section should be based on reduced steel strength. Plastic deformations are concentrated near the face of the joint (steel pull out), resulting in low rotation capacities (see Table 5.1 and Table 5.2).
In some cases, the flexural yielding of end section is followed by shear failure along diagonal crack. This effect is attributed mainly to degradation of the concrete mechanisms, participating in shear transfer, when the element is cycled within the inelastic range. FEMA356 reflects the phenomenon by reduction of the concrete contribution to the shear resistance of columns as a function of the displacement ductility demand (see Figure 5.1 and Figure 5.3). The steel contribution is reduced if the stirrups are not adequately anchored. In this case the spalling of concrete cover at high ductility levels is critical. It should be also pointed out, that VC is higher for columns with Ls/h<2, since part of the shear force in short columns is transferred by direct diagonal compression.
According to FEMA356, a beam end region, at which the shear strength is reached before flexural yielding, possesses capacity to develop plastic deformations (see Figure 5.1 and Table 5.2). This effect can be attributed to dowel action of the tension reinforcement. It redistributes the shear force, carried by concrete mechanisms, to stirrups outside the inclined crack. The flexural model is kept: the bending moment remains constant and concentrated rotations take place. This is not physically meaningful, since the shear force can further increase in case the opposite end of the beam is still elastic. In reality, the shear force remains equal to the shear strength and concentrated shear deformations develop.
µ V V ( =1) C Cµ V ( =1)Cµ VC µ V <E VG V V >E G 2.0 1.0 0 0 2.0 1.0 0.7 a) b) 4.0
Figure 5.3. Shear force, carried through concrete mechanisms: a) beams (ACI-318); b) columns
Table 5.2 Plastic rotations- columns
The beam-column joints are modeled as rigid or as shear panels with shear force-shear angle relationships, shown on Figure 5.4.
c.V V u u V γ a b p a b γp u V c.V Vu a) b)
Figure 5.4. Typical joint V-γ relationships: a) interior; b) other
Mean (expected) and mean minus one standard deviation (lower bound) strengths are used for modeling of ductile and brittle mechanisms respectively.
• FEMA440- interpretation of the FEMA356 and ATC-40 models
FEMA440 recognizes two kinds of strength degradation- cyclic and in-cycle (see Figure 5.5), since they have different effect on the structural response. The former phenomenon represents drop of resistance at given deformation level under consecutive loading cycles. The later phenomenon represents drop of resistance under monotonically increasing deformations.
The cyclic strength degradation effects are attributed to large inelastic deformations and are associated with ductile behaviour. The in-cycle strength losses are associated with brittle behaviour. Consequently, the constitutive laws for deformation-controlled and force-controlled actions in FEMA356 should be interpreted as backbone curves of the hysteretic responses of type a) and b) respectively (see Figure 5.5). In the latter case the backbone curve is essentially the same as the monotonic loading curve.
Figure 5.5. Types of strength degradation: a) Cyclic strength degradation; b) In-cycle strength degradation
• Italian seismic code and EC8
The two codes give general recommendations for modeling of primary and secondary components.
EC8 recommends the following expression for beam/column effective stiffness prior yielding:
(5.2) 2 y cl y eff L M EJ θ = ,
where My is the yield moment capacity of the end section, Lcl is the clear length and θy is the yield drift ratio of the element, considered as cantilever with length Lcl/2. The expression for θy accounts for steel strain penetration beyond the end section, flexural and shear deformations (see 6.4.1). EJeff is calculated for each half of every component.
According to the Italian seismic code the effective stiffness should not exceed 50% of the stiffness of the gross concrete section.
Mean strength values are applied for modeling of ductile mechanisms. Inelastic deformations, associated with brittle mechanisms, are not allowed (see 6.4.2).
• Comparisons and comments
All the codes recommend mean and less than mean strengths to be used for deformation-controlled and force-deformation-controlled actions respectively. In this way the analysis is conservative with respect to unfavorable brittle failure, since high strength estimates for ductile mechanisms mean high force demands on the non-ductile mechanisms in a yielding structure. At the same time, low capacity estimates are used for brittle failure modes.
5.2 Load vectors
The load vectors are obtained as a product of the floor masses and chosen profile of horizontal accelerations. They can be divided in two main groups: single-mode load vectors and multi-mode load vectors. In the former case, the push-over curve is generated by application of a single vector with constant or varying (adaptive) profile. In the latter case push-over analyses are carried out independently with load vectors representing the response in the first several modes and the effects are combined (multi-mode push-over procedures). The multi-mode push-over procedures are aimed to capture the higher mode participation in the response of the structure.
The single-mode load vectors are summarized below:
- Uniform (rectangular)- constant horizontal accelerations along the height of the structure;
- Triangular- linearly increasing accelerations from the base to the roof of the structure;
- Code distribution- varying from triangular to parabolic acceleration distribution according to the fundamental natural period of the structure (see 4.1.1.1);
- First mode- acceleration profile corresponding to the fundamental mode;
- Adaptive- uses the fundamental mode and recognizes the changes in the load pattern due to non-uniform softening of the structure with increasing control node displacement;
- SRSS- acceleration profile, generating the storey shear forces from LDP.
When the system has one degree of freedom, the load vector represents a single horizontal force.
• FEMA356, ATC-40, Italian seismic code and EC8
The load vectors, implemented in FEMA356, ATC-40, Italian seismic code (IC) and EC8 are given in Table 5.3.
Table 5.3 Load vectors
Single-mode load vectors Uniform Triangular Code
distribution First mode Adaptive SRSS Multi-mode load vectors FEMA356 √ − √ √ √ 1 √ − ATC-40 − − √ √ √ 1 − √ 1 IC √ − − √ − − − EC8 √ − − √ − − −
1- explicit instructions for implementation are not given. • FEMA440- evaluation of the load vectors
FEMA440 examines the effectiveness of the load vectors adopted in FEMA356 and ATC-40 on nine example buildings. Each of the buildings is subjected to eleven ordinary ground motions and four near-field records. Each of the ordinary records is scaled through NDP to three intensity levels, resulting in three predefined total drifts (roof displacement as a percentage of the building height). The total drifts caused by the four near-field excitations are also obtained by NDP.
Each of the buildings is then pushed to the seven total drift levels, applying each of the load vectors. The distribution of the floor displacements, interstorey drifts, storey shears and overturning moments along the height of the structure are compared with the corresponding values from the non-linear dynamic analyses.
This analysis reveals the errors due to the load vector used, in case the target displacement (roof displacement) is well predicted. The first mode vector is recommended since it gives low error displacement estimates and keeps the consistency of the derivation of the ESDOF
system (see 5.4). The multi-mode push-over procedures should be used as a comparison or improvement over the single-mode load vectors. A need for future development of these procedures is pointed out.
5.3 Solution of SDOF systems
The force-displacement relation of a SDOF system is represented by its push-over curve, idealized as bi-linear (see Figure 5.6.a). The elastic and post-yield stiffness are denoted as k0 and αmaxk0 respectively. All the codes (FEMA356, ATC-40, Italian seismic code and EC8) establish the bi-linear idealization on the principle for equal areas under the original and idealized push-over curves.
Figure 5.6. Capacity curve: a) bi-linear idealization; b) hysteretic model
The push-over curve actually represents a backbone curve of the expected global hysteretic response of the structure up to the target displacement. The model of the hysteretic response should generally include stiffness degradation, cyclic and in-cycle strength degradation (see Figure 5.6.b).
Theoretically, the system can be solved by direct integration of the equation of motion for fixed strength or fixed maximum ductility. The maximum mass displacement (target displacement) can be expressed as:
- fixed strength solution
(5.3) δmax =δt = f(T0,β0,R,HYST,α,a(t)) - fixed maximum ductility solution
(5.4) δmax =δt = f(T0,β0,µ,HYST,α,a(t)).
The meaning of the governing parameters in the brackets is as follows:
- T0- natural period, corresponding to the elastic branch of the idealized push-over curve; - β0- damping coefficient, usually given a value of 5%;