AND
ASTROPHYSICS
About the origin of extinction
in the gravitational lens system MG J0414+0534
?
M.-C. Angonin-Willaime1, C. Vanderriest2,??, F. Courbin2,3,4, I. Burud3, P. Magain3,???, and F. Rigaut5 1
DEMIRM, Observatoire de Paris-Meudon, France 2
UMR 8631, CNRS-DAEC, Observatoire de Paris-Meudon, F-92195 Meudon Cedex, France 3
Institut d’Astrophysique et de G´eophysique, Universit´e de Li`ege, Avenue de Cointe 5, B-4000, Li`ege, Belgium 4
Universidad Catolica de Chile, Department of Astronomy and Astrophysics, Casilla 22, Santiago 22, Chile 5
European Southern Observatory, Karl-Schwarzschild-Strasse 2, D-85748 Garching bei M¨unchen, Germany Received 21 January 1999 / Accepted 25 March 1999
Abstract. Photometric measurements of the highly reddened gravitational mirage MG J0414+0534 have been carried out either by PSF subtraction or by applying accurate deconvolu-tion algorithms to optical (R, I) and near-infrared (K) images obtained at CFHT and NOT under sub-arcsecond seeing condi-tions. It is confirmed that the close pair of images A1-A2 suffers a larger extinction than B and C. While the colours of image A2 obtained from ground-based data seem inconsistent with a sim-ple reddening law, higher resolution images available from HST archives reveal an additional extended component (arc) which introduces significant errors in the photometric decomposition. When the arc component is properly taken into account, the colours of the 4 nucleus images do agree with a classical red-dening law, with A2 being by far the most obscured component. Such a differential extinction (maximum difference∆E(R-I) ' 0.6) is likely due to the lensing galaxy. This does not mean that
all the extinction occurs into the lens. Indeed, the fact that the
arc is much less red than the images of the nucleus suggests that an important part of the reddening is intrinsic to the source. Fi-nally, no significant variability is observed within this data set, i.e. between 1994 and 1997, while a discrepancy from earlier data is noticed for (A1 + A2).
Key words: galaxies: ISM – galaxies: quasars: individual: MG J0414+0534 – cosmology: gravitational lensing – infrared: galaxies
1. Introduction
MG J0414+0534 is one of the gravitational lens systems found in the MIT-Green Bank radio survey (Bennett et al., 1986). Its
Send offprint requests to: M.-C. Angonin-Willaime
?
Based on observations collected with the Canada-France-Hawaii Telescope at Mauna Kea (Hawaii, USA), the Nordic Optical Telescope (Canary, Spain) and archive data from the Hubble Space Telescope (NASA/ESA)
??
Visiting Astronomer, Canada-France-Hawaii Telescope ???
Also Maˆıtre de recherches au FNRS, Belgium
high radio flux allowed a detailed mapping with the Very Large Array (Hewitt et al., 1988, Hewitt et al., 1992, Katz & Hewitt, 1993), revealing a trapeziform configuration (almost identical to that of PG 1115+080) with 4 bright images labelled A1, A2, B and C.
This system is remarkable because, in the optical domain, the counterparts of the radio images are extremely red and faint, and their spectrum is almost featureless. The source appears to be a very obscured quasar; its redshift (zS = 2.639) could only be obtained from infrared spectra (Lawrence et al. 1995a). The strong and broad Hαemission line, as well as other fainter Balmer and Fe II lines, indicate a classical active nucleus spec-trum after correction for the reddening. The most prominent spectral feature in the optical may be identified with an ab-sorption complex of Fe II lines at redshifts close to the emis-sion redshift of the quasar (Lawrence et al. 1995b). The lensing galaxy is easily detected on sub-arcsecond images (Shechter & Moore, 1993, Angonin-Willaime et al., 1994) but its redshift, zL = 0.958, remained unknown until recently (Tonry and Kochanek 1998).
The exact value of the reddening in MG J0414+0534 de-pends on its origin, but is high in any case. The Hα/Hβflux-ratio as well as the upper limit for Lα/Hα(Lawrence et al. 1995a) suggest an extinction Av ' 6 mag for the brightest QSO pair, assuming it occurs in the lensing galaxy. The fact that the flux ra-tios between the different QSO images change with wavelength can be interpreted in terms of differential reddening along dif-ferent line of sight, through the lensing galaxy. Lawrence et al. (1995a) proposed that most of the extinction occurs in the lens, rather than close to the source (galaxy hosting the quasar, associated cluster...). The present paper compares optical and infrared data in order to test this interpretation. The ground-based optical and near-IR data are presented and discussed in Sect. 2. Sect. 3 presents a re-analysis of archival HST data and shows how the presence of a gravitational arc may affect the photometry derived from lower resolution images. Finally, the origin of the measured extinction is discussed in Sect. 4.
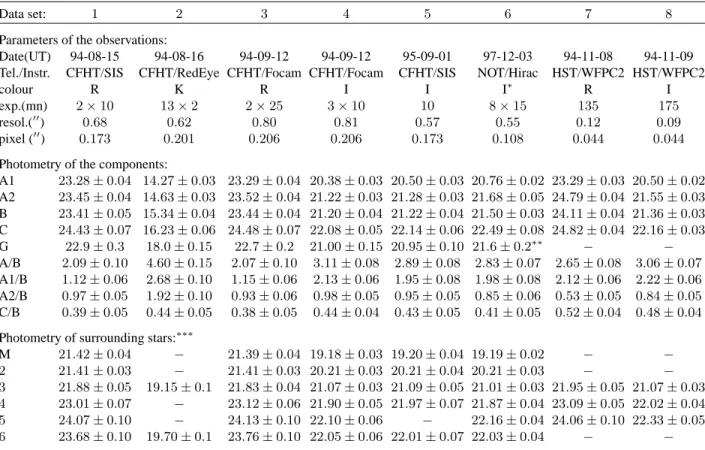
Table 1. Photometry of MG J0414+0534 (ground-based and HST data)
Data set: 1 2 3 4 5 6 7 8
Parameters of the observations:
Date(UT) 94-08-15 94-08-16 94-09-12 94-09-12 95-09-01 97-12-03 94-11-08 94-11-09 Tel./Instr. CFHT/SIS CFHT/RedEye CFHT/Focam CFHT/Focam CFHT/SIS NOT/Hirac HST/WFPC2 HST/WFPC2
colour R K R I I I∗ R I
exp.(mn) 2 × 10 13 × 2 2 × 25 3 × 10 10 8 × 15 135 175
resol.(00) 0.68 0.62 0.80 0.81 0.57 0.55 0.12 0.09
pixel (00) 0.173 0.201 0.206 0.206 0.173 0.108 0.044 0.044
Photometry of the components:
A1 23.28 ± 0.04 14.27 ± 0.03 23.29 ± 0.04 20.38 ± 0.03 20.50 ± 0.03 20.76 ± 0.02 23.29 ± 0.03 20.50 ± 0.02 A2 23.45 ± 0.04 14.63 ± 0.03 23.52 ± 0.04 21.22 ± 0.03 21.28 ± 0.03 21.68 ± 0.05 24.79 ± 0.04 21.55 ± 0.03 B 23.41 ± 0.05 15.34 ± 0.04 23.44 ± 0.04 21.20 ± 0.04 21.22 ± 0.04 21.50 ± 0.03 24.11 ± 0.04 21.36 ± 0.03 C 24.43 ± 0.07 16.23 ± 0.06 24.48 ± 0.07 22.08 ± 0.05 22.14 ± 0.06 22.49 ± 0.08 24.82 ± 0.04 22.16 ± 0.03 G 22.9 ± 0.3 18.0 ± 0.15 22.7 ± 0.2 21.00 ± 0.15 20.95 ± 0.10 21.6 ± 0.2∗∗ − − A/B 2.09 ± 0.10 4.60 ± 0.15 2.07 ± 0.10 3.11 ± 0.08 2.89 ± 0.08 2.83 ± 0.07 2.65 ± 0.08 3.06 ± 0.07 A1/B 1.12 ± 0.06 2.68 ± 0.10 1.15 ± 0.06 2.13 ± 0.06 1.95 ± 0.08 1.98 ± 0.08 2.12 ± 0.06 2.22 ± 0.06 A2/B 0.97 ± 0.05 1.92 ± 0.10 0.93 ± 0.06 0.98 ± 0.05 0.95 ± 0.05 0.85 ± 0.06 0.53 ± 0.05 0.84 ± 0.05 C/B 0.39 ± 0.05 0.44 ± 0.05 0.38 ± 0.05 0.44 ± 0.04 0.43 ± 0.05 0.41 ± 0.05 0.52 ± 0.04 0.48 ± 0.04
Photometry of surrounding stars:∗∗∗
M 21.42 ± 0.04 − 21.39 ± 0.04 19.18 ± 0.03 19.20 ± 0.04 19.19 ± 0.02 − − 2 21.41 ± 0.03 − 21.41 ± 0.03 20.21 ± 0.03 20.21 ± 0.04 20.21 ± 0.03 − − 3 21.88 ± 0.05 19.15 ± 0.1 21.83 ± 0.04 21.07 ± 0.03 21.09 ± 0.05 21.01 ± 0.03 21.95 ± 0.05 21.07 ± 0.03 4 23.01 ± 0.07 − 23.12 ± 0.06 21.90 ± 0.05 21.97 ± 0.07 21.87 ± 0.04 23.09 ± 0.05 22.02 ± 0.04 5 24.07 ± 0.10 − 24.13 ± 0.10 22.10 ± 0.06 − 22.16 ± 0.04 24.06 ± 0.10 22.33 ± 0.05 6 23.68 ± 0.10 19.70 ± 0.1 23.76 ± 0.10 22.05 ± 0.06 22.01 ± 0.07 22.03 ± 0.04 − −
∗See discussion about the photometric systems in Sect. 2.2
∗∗Measurement in a 1.800diameter aperture, while it was ∼ 400for the other data.
∗∗∗Identification as in Angonin-Willaime et al. (1994). For the visible ground-based data, star 2 was chosen as the main local photometric reference, while it was star 3 for HST data.
2. Ground-based observations
Several high-resolution data sets have been obtained with the Canada-France-Hawaii Telescope (CFHT) and the Nordic Opti-cal Telescope (NOT) between 1994 and 1997, allowing to mea-sure individually the fluxes of the 4 images of the source. Six data sets corresponding to four epochs (Table 1) have been anal-ysed.
2.1. Optical: observations and reduction methods
The data from CFHT have been obtained with SIS (Subarcsec-ond Imaging Spectrograph), which uses an active guiding mirror for a first order (tip-tilt) correction of the atmospheric turbu-lence, or with the direct imaging unit FOCAM. The same com-bination of detector (a CCD from Loral) and filters was used for both instruments. The individual frames were re-centered and co-added for each data set whenever several exposures were available. The typical spatial resolution is 0.600with SIS and 0.800with FOCAM.
The photometric measurements of the lensed images of the nucleus were performed by direct PSF subtraction: a synthetic PSF is built from the average of several surrounding stars, then
properly scaled and subtracted at the positions of the 4 images, A1, A2, B and C. Scaling factors and positions are adjusted by trials and errors, using procedures from the IRAF package. For evaluating the quality of decomposition and the photometric accuracy, the same PSF subtraction method is applied to a few stars belonging to the photometric sequence established in the field (Angonin-Willaime et al., 1994). After a few iterations, the procedure leaves a clear picture of the lensing galaxy (Figs. 1 and 2). The residuals close to the positions of the lensed images are similar to the residuals around field stars, except for some faint excess of flux between A1-A2 and B. This structure, barely emerging from noise, is the mark of the arc component detected more easily with the HST (see Sect. 3).
The data from NOT have been obtained with the HiRAC camera under very good seeing conditions. The excellent spa-tial stability of the PSF provided by this instrument gave the opportunity to take full advantage of the MCS deconvolution code (Magain et al., 1998). The algorithm decomposes the im-ages into a sum of point sources plus a diffuse background; the final resolution is chosen according to the signal/noise ratio in the object. When applied to one single image, this proce-dure of “controlled deconvolution” already allows to improve both the resolution and sampling of the data (see Courbin et al.,
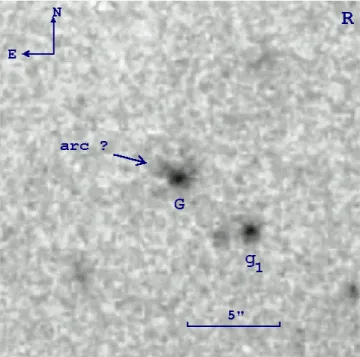
Fig. 1. Processing of the R images from CFHT (sum of data sets 1 and
3). The figure displays the residuals after “optimal” PSF subtraction at the locations of the 4 images of the nucleus. This allows an accurate photometry of the lensing galaxy G. An excess of light is clearly present at the location of the arc detected with HST. The nearby galaxy g1was already identified by Angonin-Willaime et al. (1994).
1997 for an application to PG 1115+080), but better results are achievable when several dithered frames of the same object are deconvolved simultaneously (Courbin et al., 1998a, Burud et al., 1998). In the present case, 8×15 mn exposures were decon-volved simultaneously, with a final resolution of 0.1600, using a pixel scale of 0.053500. The programme determines the inten-sities of the point sources independently for each frame. The standard deviation of the eight intensities therefore provides a reasonable estimate of the 1σ error bar on the photometry. The quality of the deconvolution is checked by inspecting the resid-ual maps obtained for each frame (see Courbin et al., 1998b for more details). The final deconvolved image is displayed in Fig. 3 and should be compared with Fig. 7. The arc between A1-A2 and B is clearly visible; the “object X” from Schechter & Moore (1993) is measurable with I = 24.0 ± 0.2, i.e. in agreement with previous photometry (Angonin-Willaime et al., 1994). First or-der moment of the light distribution allows one to estimate the position of the lensing galaxy; more detailled analysis also re-veals the flattening of the isophotes, as well as some rotation of its major axis with the surface brightness level, suggesting it could be either a giant Spiral or a triaxial Elliptical.
For all our ground-based data, photometric measurements are related to the local reference star 2, which was also inde-pendently checked against primary standards. The results for the local sequence are in good agreement with previous values (Angonin-Willaime et al., 1994). The only significant difference may be for the R magnitude of star M, which could indicate slight, but significant, photometric variability. The optical
posi-Fig. 2. Same as posi-Fig. 1 for the I-band image obtained at CFHT (sum
of data sets 4 and 5; scale and orientation as in Fig. 1). The arc is not clearly seen, while object “X” is easily detected. Note that the lens is very red compared with surrounding galaxies.
tions found for the QSO components agree very well with the radio positions (Katz et al., 1997), while the intensity ratios do not, confirming the reddening of the source.
2.2. Comments on the optical photometry
Table 1 summarizes our photometric measurements. We notice that the magnitudes of the images did not vary significantly over the period of observations for the CFHT data sets (1 and 3 in
R, 4 and 5 in I). The magnitudes from NOT are apparently ∼
0.2–0.3 mag fainter. Similarly, when comparing with data from 1991–92 (Angonin-Willaime et al., 1994), we remark a small brightening of all the QSO images in I (see the concluding sec-tion). If real, this would indicate a synchronous variation of all the 4 images of the source, which is not unlikely with short time delays. However, it should be kept in mind that the very red spectrum of the source makes its photometry extremely sensi-tive to the precise shape of the red cut-off of the instrumental passband. This is especially true for the I-band. In fact, when we build the I-band instrumental responses for CFHT and NOT by combining the filter and CCD responses, both show a small departure from the theoretical I system: too red for CFHT and too blue for NOT (for details, see the instrument manuals of these telescopes). We checked, by integrating the source spec-trum multiplied by the response curves, that such small discrep-ancies are quantitatively sufficient for explaining the observed effect. There is no noticeable effect on the surrounding stars of the photometric sequence because, although some of them are quite red, the shapes of their spectra are less “extreme”.
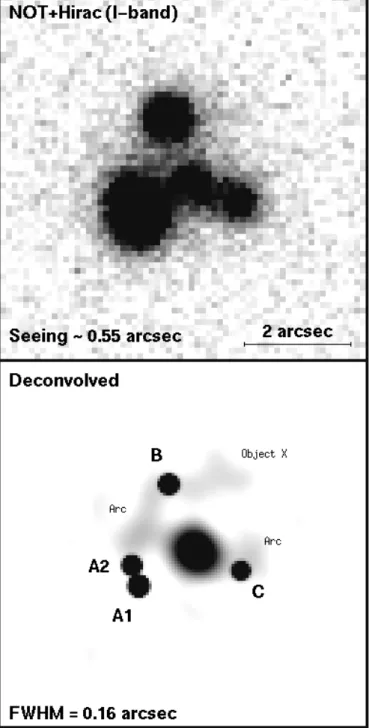
Fig. 3. Processing of the I image obtained at NOT (data set 6);
up-per panel shows the direct sum of 8 images; lower panel displays the result of running the MCS algorithm simultaneously on the 8 images (see text). One may see clearly the lensing galaxy as well as residual structures, emerging significantly from the background noise, which correspond respectively to the arc (between A1+A2 and B, and close to C), and to object “X”. See Fig. 7 for a comparison with HST images.
This discussion shows that one should be extremely cautious with apparent variations of MG J0414+0534 measured with dif-ferent instruments. Variation of the flux ratios would be a better clue to real variations, since the spectra of the 4 gravitational im-ages are similar (except for the differential extinction which, in this case, is a second order effect). No such variation is detected
Fig. 4. K-band image obtained at CFHT (data set 2). The lensing galaxy
G is clearly seen at K = 18.0 and the nearby galaxy g1 at K ' 19.8.
with our data. Finally, within the error bars, the observations are compatible with a total stability of the source.
2.3. Infrared
Observations in K band with the RedEye infrared camera (Si-mons et al., 1994) were made one night after optical observa-tions (data sets 1 and 2). This quasi-simultaneity insured that any measured colour difference cannot result from intrinsic vari-ability coupled with time-delay effects. We took 13 successive exposures, each of 120 s duration, shifted by 400along a square pattern. An accurate flat field is obtained by correlation of all the individual frames. After rebinning to 0.100/pixel, recentering and coaddition of the frames, the final image has a useful field of view ∼ 4000. The stars present in this field are much too faint for building an accurate PSF. It was therefore determined iteratively from the object itself. After PSF subtraction, the photometric ac-curacy on the nucleus images, although somewhat deteriorated by the process, is still comparable to the one in optical. Likewise, the lensing galaxy is measurable with an accuracy comparable to optical. The absolute photometric calibration was carried out by using the standard stars FS26 and FS35 (Casali & Hawar-den, 1992). The near-IR photometric results are summarized in Table 1 and astrometry is given in Table 2.
The magnitudes of the 4 components agree, within the er-ror margins, with those measured by McLeod et al. (1998) in 1992–93, but there is an obvious discrepancy of almost 2 magni-tudes for the lensing galaxy. Owing to the better signal-to-noise ratio and resolution, the magnitude derived here seems to be more reliable (it is already obvious on Fig. 4 that galaxy G cannot be as bright as claimed by McLeod et al.). The(R − I)/(I − K) colour ratio agrees with that of a giant elliptical at z '0.9 with
Table 2. Relative astrometry in K (CFHT data) and in optical (HST data) CFHT (K) HST ∆α(00) ∆δ(00) ∆α(00) ∆δ(00) A1 +0.60 ± 0.01 −1.93 ± 0.01 +0.60 ± 0.01 −1.94 ± 0.01 A2 +0.74 ± 0.01 −1.54 ± 0.01 +0.73 ± 0.01 −1.55 ± 0.01 B 0.00 0.00 0.00 0.00 C −1.35 ± 0.02 −1.65 ± 0.02 −1.345 ± 0.01 −1.64 ± 0.01 G −0.53 ± 0.05 −1.31 ± 0.04 −0.475 ± 0.01 −1.28 ± 0.01 ? 3 +4.60 ± 0.03 +9.23 ± 0.03 +4.61 ± 0.01 +9.23 ± 0.01 ? 6 +18.79 ± 0.03 −6.01 ± 0.03 − −
Note: Astrometry based on psf subtraction for the source images and
stars; barycenter for the galaxy.
very little reddening (Kodama et al., 1998). Conversely, if we assume that the lensing galaxy is a giant elliptical with small reddening, the observed I magnitude alone suggests a redshift comparable to that measured by Tonry & Kochanek (1998).
3. HST data
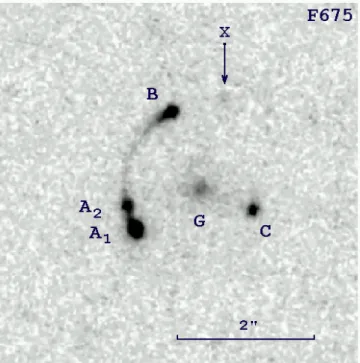
WF/PC2 frames of MG J0414+0534 are available from the HST archives. As discussed in Falco et al. (1997), the high resolution allowed to discover a lensed arc, in addition to the 4 point-like images. We retrieved these frames via the CADC network and did our own processing (Figs. 5 to 8). The arc that links images A1, A2and B shows up very clearly in both colours. A fuzzy extension north of image C is also visible, especially in R. As noted by Falco et al., these structures indicate that the source is made of a point-like core (the nucleus of the quasar) and a very asymmetric underlying galaxy or a close companion.
3.1. Photometric measurement of the nucleus images
Measuring the magnitudes of the 4 core images was done by PSF subtraction, in the same way we did for ground-based data. For each image, the intensity of the PSF was adjusted for obtaining the “best” residuals. However, two difficulties arise here: (i) the PSF of the WF/PC2 is undersampled (∼ 2 pixels FWHM) and (ii) it is difficult to evaluate the arc profile underneath the core images. Anyway, our photometric method (Figs. 6 and 8) gives significantly different results than those previously obtained by Falco et al., who just integrated the flux inside an aperture. The chequered pattern of the image residuals at the position of the subtracted PSFs (best visible in the I image of Fig. 8) is an arti-fact due to the undersampling. This effect probably contributes to increase the error of our photometry, but not to an extent that would make it compatible with the estimate of Falco et al. As can be seen from Figs. 6 and 9, light contamination by the lensed arc is not negligible at all, especially around component A2. This casts some doubts on the reliability of the aperture photometry carried out by Falco et al. (1997), at least for component A2.
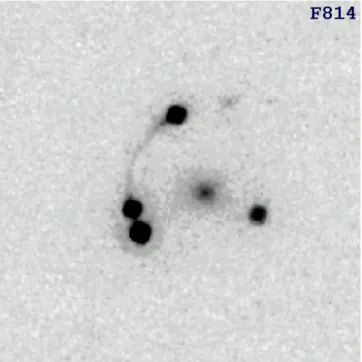
Fig. 5. Close-up on the arc structure from HST images in R.
Fig. 6. Same as Fig. 5 after PSF subtraction at the locations of A1,
A2, B, C and “X” (contrasts have been slightly stretched with respect to Fig. 5). Note the bright arc portions close to the nucleus images (arrows), especially between A1 and A2.
3.2. Comparison of HST and ground-based photometric measurements; influence of an extended structure
Having processed the images as described above, one may note that the photometric results from HST differ notably from the ground-based results. This cannot be due to difference in the photometric systems. The rattachment to the standard photomet-ric system is done quite accurately by using the formulae given
Table 3. Colour indices of the components of the lensing system (R-I)CF H (R-K)CF H (R-I)H ST RH ST−KCF H A1 2.9 ± 0.05 9.0 ± 0.04 2.8 ± 0.04 9.0 ± 0.04 A2 2.3 ± 0.05 8.8 ± 0.04 3.25 ± 0.05 10.15 ± 0.04 B 2.25 ± 0.06 8.05 ± 0.06 2.75 ± 0.05 8.75 ± 0.05 C 2.4 ± 0.09 8.2 ± 0.08 2.65 ± 0.05 8.6 ± 0.07 G 1.7 ± 0.3 4.9 ± 0.3 − − arc − − 1.4 ± 0.3 −
by Holtzman et al. (1995), and any remaining effect should be a systematic shift of the magnitude scale. The observed differ-ences are rather due to the presence of the arc, which brightness is maximum near A1-A2 and varies significantly on a scale comparable to the resolution of ground-based data. In such a case, the errors with the direct PSF subtraction method or even the deconvolution method could be important, especially for the relatively faint component A2. Note on Figs. 1–3 that the arc is totally “lost” underneath A1-A2 and the residuals seem nevertheless acceptable. This failure is explained by the very important photon noise from the QSO images spread over the arc, while HST images are naturally exempt of contamination. We verified this interpretation by smoothing and rebinning the HST data to match the parameters of ground-based data (resolution ' 0.600, pixel ' 0.100), then applying the same pro-cedure of PSF subtraction as for real ground-based data. The “best” results obtained this way give almost unchanged fluxes, within 0.1 mag, for components A1 and C but over-estimates the flux of B by 0.1 mag in I and 0.3 mag in R, and the over-estimation for A2 reaches 0.4 mag in I and 1.0 mag (!) in R. In other words, standard processing of the (degraded) HST data yields almost exactly the flux values measured from data set 5. This exercise shows quantitatively how the presence of a faint extended structure, hardly detected with 0.600resolution, could induce substantial errors on PSF subtraction results. However, the correction needed to retrieve the “true” photometry depends only on the final resolution and, since the seeing of our ground-based data set is almost constant around 0.600- 0.800, it would make sense to search for variability by inter-comparison. 4. Extinction
Table 3 gives the final colours of the various components (rounded to the nearest 0.05 mag). As discussed above, the most realistic colours of the nucleus images are those involving HST observations. Then, it becomes obvious that A2 is much more reddened than the other images of the nucleus. The order of increasing reddening is: C, B, A1, A2, with a∆E(R-I) of 0.6
mag between A2 and C.
4.1. Estimation of the extinction and discussion of its origin
The high extinction in MG J0414+0534 could be due to dust in the foreground lensing galaxy as well as dust in the quasar itself (or, more likely, a combination of both). A first value of
Fig. 7. Close-up on the arc structure from HST images in I.
Fig. 8. Same as Fig. 7 after PSF subtraction at the locations of A1, A2,
B, C and “X” (contrasts have been slightly stretched with respect to Fig. 7). The arc is visible between A1 and A2 with a relativly high surface brightness.
the extinction AV can be inferred from the R − I colour of the nucleus images, through a relation AV = k.E(R-I) in which k depends on the shape of the extinction curve and on the redshift of the absorber. A typical z=2.6 quasar should have R-I ' 0.5 (Irwin et al., 1991; V´eron & Hawkins, 1995), thus E(R-I) is close to 2.15 for C and 2.75 for A2. Assuming that this colour excess is due entirely to the lensing galaxy at z∼0.9, we could compute
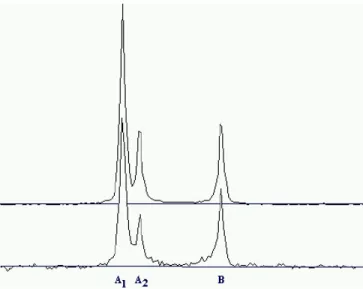
Fig. 9. Flux distribution projected along the arc in I (upper curve) and R
(lower curve), showing the important contribution of the arc underneath A2.
AV provided that the extinction law is well known. An “SMC-like” extinction law, without the 2200 ˚A “bump” observed in our Galaxy (see e.g. Pr´evot et al., 1984) is needed to fit the spectrum of the quasar. Then, the best fit is obtained with a flat source spectrum and AV ' 4 for image C and 6 for A2 (C. Lawrence, private communication).
Lawrence et al. (1995a) showed also that it is difficult to fit the observed spectrum assuming the dust is at the redshift of the source, even using the “SMC-like” extinction law. This favours extinction by the lens. It is unclear, however, which law should be used for an extinction intrinsic to the quasar. Low metallicity is expected for high-redshift objects, but absorptions associated with quasars (i.e at zabs ≈ zem) seem to indicate in most cases solar or higher metallicities (Franceschini & Gratton, 1997). Moreover, Lawrence et al. (1995b) had shown that the quasar spectrum displays large equivalent width Fe ii lines which sup-port a non-negligible local extinction contribution. An evidence for the contribution of such “in situ” extinction is the colour of the arc (Falco et al., 1997 and this work). If its reddening is similar to that of the less reddened image of the nucleus (C), the real (R-I) colour becomes ∼ -1.3, which is bluer than the typical colour of even a starburst galaxy or H ii region at z=2.6.
4.2. Consequences
The existence of differential extinction between the images im-plies that at least a part of the total extinction should be due to inhomogeneities of the lensing galaxy. A lower limit for this contribution is AV = 1.9 in the direction of A2. Finally, the con-straints on the relative contributions from, respectively, dust in the vicinity of the source (AV(S)) and in the body of the lensing galaxy (AV(G)) are still rather loose. With the present data, we can only securely assess that:
(i) 0< AV(S) <3.5 (assuming an SMC-like extinction curve at z=2.6) and
(ii) 0< AV(G) <4. (for image C) or 1.9< AV(G) <6. (image A2).
Assuming that all the extinction is due to the lens (AV(S)=0), we find a total mass of dust in G of the order of 5.108
M with a screen model of radius 1.500giving an homoge-neous extinction (Aoki et al., 1991). Then, using a gas-to-dust ratio around 100, the mass of gas is ∼5.1010M , which is hard to reconcile with a giant elliptical. It thus seems likely that a sig-nificant part of the extinction occurs in the lensed object itself. Obtaining a spectrum of the arc or, at least, HST images in V band would help to ascertain its extinction. If the true colour is indeed R − I = -1.3, this implies a population of very hot stars, hence strong emission lines are expected. HI 21 cm observations at the redshifts of the FeII clouds could also help to constrain the metallicity and resolve the ambiguity on the extinction law to be used.
5. Conclusion
The analysis of new data and the re-discussion of older ones from HST presented in this study lead to the following main conclusions:
1) Good resolution imaging at visible and IR wavelengths con-firms the existence and precises the amplitude of differential extinction between the images of the quasar nucleus. 2) A reanalysis of HST data shows that the arc should be
care-fully taken into account for a correct photometry of these nucleus images. After doing so, the observed properties of the nucleus images become compatible with a classical ex-tinction by dust.
3) It is not yet possible to make a clear departure between the contributions of the source and of the lensing galaxy to the global extinction. Fitting the observed spectrum with dust at both redshifts would certainly work well, but the quality of present data is not sufficient for putting strong constraints on the fit parameters.
4) The source was not significantly variable during the period 1994–1997.
Concerning the last point, one may note that, compared to earlier observations in 1991–1992 (Angonin-Willaime et al., 1994), a significant (∼ 0.5 magnitude) dimming is observed in R for the close pair (A1+A2) while B and C remain constant. In I, there is no mesurable effect, save for a small global shift of the zero point that is imputable to passband differences (see the dis-cussion in Sect. 2.2). This could be the signature of an intrinsic change in the quasar combined with the different time delays of the images. Another possible explanation is that we were witnessing in 1991–92 the termination of a microlensing event that ended before 1994. However, the difference in behaviour between I and R is not easily explained with such mechanisms. The simplest explanation for this chromatic effect is that we are in presence of time-dependent absorption of the image(s) by the lens. The time scale seems a priori inadequate, but the lensing would help to shrink it. A1-A2 is a very amplified pair
of images (A ∼ 20 to 30 in flux) near a caustic. This flux am-plification is only a geometrical effect (magnification matrix of the lens), which acts on the vectors of relative proper motion as well as on position vectors. Statistically, the modulus of a randomly oriented proper motion vector should be increased by
√
A, with possibly higher amplifications for favourable
orienta-tions. In the specific case of the pair A1-A2 in MG J0414+0534, the beam of light coming from the source may thus scan the lens galaxy with a relative velocity of several thousands, or even tens of thousands of km s−1. The same line of reasoning used for dis-cussing the time scale of microlensing events holds also for the time scale of extinction variations across small clouds. If the clouds have a fine patchy structure, variable extinction may be observed with a time scale compatible with the data.
Acknowledgements. The data have been obtained partly on
discre-tionary time from the direction of CFHT. The authors are grateful for this privilege. FC and IB are supported by contracts ARC 94/99-178 “Action de Recherche Concert´ee de la Communaut´e Franc¸aise” (Belgium), and Pˆole d’Attraction Interuniversitaire P4/05 (SSTC, Bel-gium). Retrieval of HST archive images was done through the service of CADC, which is operated by NRC, Herzberg Institute of Astrophysics and Dominion Astrophysics Laboratory. Finally, thanks are due to the referee for his very useful suggestions.
References
Angonin-Willaime M.-C., Vanderriest C., Hammer F., Magain P., 1994, A&A 281, 388
Annis J., Luppino G., 1993, ApJ 407, L69
Aoki T., Hiromoto N., Takami H., Okamura S., 1991, PASJ 43, 755
Barvainis R., Alloin D., Guilloteau S., Antonucci R., 1998, ApJ 492, L13
Bennett C., Lawrence C., Burke B., Hewitt J., Mahoney J., 1986, ApJS 61, 1
Burud I., Courbin F., Lidman C., et al., 1998, ApJ, submitted Casali M., Hawarden T., 1992, JCMT-UKIRT Newsletter, 33 Courbin F., Magain P., Keeton C., et al., 1997, A&A 324, L1 Courbin F., Lidman C., Magain P., 1998a, A&A 330, 57 Courbin F., Lidman C., Frye B., et al., 1998b, ApJ, 501, L5 Falco E., Lehar J., Shapiro I., 1997, AJ 113, 540
Franceschini A., Gratton R., 1997, MNRAS 286, 235
Hewitt J., Burke B., Turner E., et al., 1988, In: Gravitational lenses. Lecture Notes in Physics 330, 147
Hewitt J., Turner E., Lawrence C., Schneider, 1992, AJ 104, 968 Holtzman J., Burrows C., Casertano S., et al., 1995, PASP, 110, 2570 Irwin M., McMahon R., Hazard C., 1991, ASP Conf. Ser. 21, 117 Katz C., Hewitt J., 1993, ApJ 408, L9
Katz C., Moore C., Hewitt J., 1997, ApJ 475, 512
Kodama T., Arimoto N., Barger A., Arag´on-Salamanca A., 1998, A&A 334, 99
Lawrence C., Elston R., Jannuzi B., Turner E., 1995, AJ 110, 2570 Lawrence C., Cohen J., Oke J., 1995, AJ 110, 2583
Magain P., Courbin F., Sohy S., 1998, ApJ 494, 472 Malhotra S., Rhoads J., Turner E., 1997, MNRAS 288, 138 Moore C., Hewitt J., 1997, ApJ 491, 451
McLeod B., Bernstein G., Rieke M., Weedman D., 1998, AJ 115, 1377 Pr´evot M., Lequeux J., Maurice E., Pr´evot L., Rocca-Volmerange B.,
1984, A&A 132, 389
Schechter P., Moore C., 1993, AJ 105, 1
Simons D., Clark C., Kerr J., et al., 1994, S.P.I.E. 2198, 185 Tonry J., Kochanek C., 1998, AJ, in press