HAL Id: hal-01934281
https://hal.archives-ouvertes.fr/hal-01934281
Submitted on 25 Nov 2018
HAL is a multi-disciplinary open access
archive for the deposit and dissemination of
sci-entific research documents, whether they are
pub-lished or not. The documents may come from
teaching and research institutions in France or
abroad, or from public or private research centers.
L’archive ouverte pluridisciplinaire HAL, est
destinée au dépôt et à la diffusion de documents
scientifiques de niveau recherche, publiés ou non,
émanant des établissements d’enseignement et de
recherche français ou étrangers, des laboratoires
publics ou privés.
Context-aware clustering and assessment of photo
collections
Dmitry Kuzovkin, Tania Pouli, Rémi Cozot, Olivier Le Meur, Jonathan
Kervec, Kadi Bouatouch
To cite this version:
Dmitry Kuzovkin, Tania Pouli, Rémi Cozot, Olivier Le Meur, Jonathan Kervec, et al.. Context-aware
clustering and assessment of photo collections. Expressive ’17 The symposium on Computational
Aesthetics, Jul 2017, Los Angeles, United States. �10.1145/3092912.3092916�. �hal-01934281�
Context-aware Clustering and Assessment of Photo Collections
Dmitry Kuzovkin
Technicolor, IRISA, University of Rennes 1 Rennes, France dmitry.kuzovkin@technicolor.comTania Pouli
Technicolor Rennes, France tania.pouli@technicolor.comRémi Cozot
IRISA, University of Rennes 1 Rennes, France remi.cozot@irisa.fr
Olivier Le Meur
IRISA, University of Rennes 1 Rennes, France olivier.le_meur@irisa.fr
Jonathan Kervec
Technicolor Rennes, France jonathan.kervec@technicolor.comKadi Bouatouch
IRISA, University of Rennes 1 Rennes, France kadi.bouatouch@irisa.fr
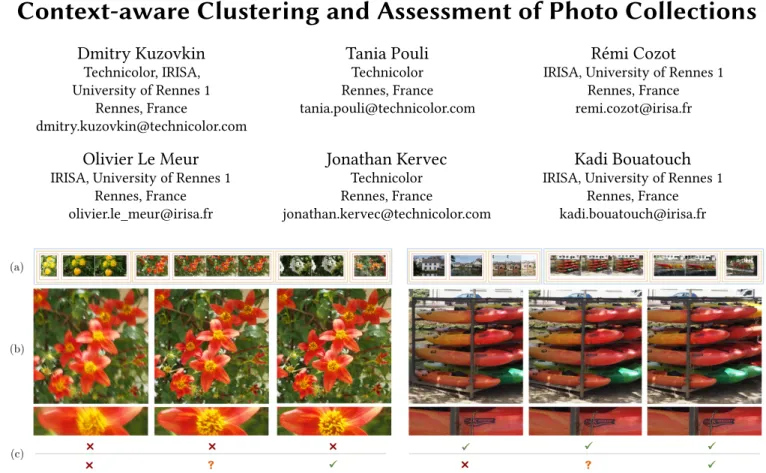
Figure 1: Our context-aware framework performs the assessment and labeling of images in photo collections by considering image quality in the context of the collection as well as photos captured in the same scene. (a) Extract from a photo collection and visualization of clustering. (b) Photos captured in the same scene and close-ups of image details. (c) Top: image labeling obtained from independent assessment. Bottom: labels assigned after our context-aware adaptation of the independent score.
ABSTRACT
To ensure that all important moments of an event are represented and that challenging scenes are correctly captured, both amateur and professional photographers often opt for taking large quantities of photographs. As such, they are faced with the tedious task of organizing large collections and selecting the best images among similar variants. Automatic methods assisting with this task are based on independent assessment approaches, evaluating each im-age apart from other imim-ages in the collection. However, the overall quality of photo collections can largely vary due to user skills and other factors. In this work, we explore the possibility of context-aware image quality assessment, where the photo context is defined using a clustering approach, and statistics of both the extracted context and the entire photo collection are used to guide identifica-tion of low-quality photos. We demonstrate that our method is able to flexibly adapt to the nature of processed albums and to facilitate the task of image selection in diverse scenarios.
KEYWORDS
Photo selection, Clustering, Image quality
1
INTRODUCTION
With digital photography and low storage costs, users have the ability to capture many photos of the same scene, object or event with little overhead in terms of cost or effort – an estimated 1.1 trillion photos were captured in 2016 alone1. However, this increase in the number of photos captured, brings a significant overhead in the time and effort necessary for organizing one’s photo collections, and eventually selecting which images to keep or reject.
This task is commonly addressed with individual image aes-thetics assessment approaches, where an input image is evaluated irrespective of its context [Chang et al. 2016; Datta et al. 2006; Lu et al. 2014; Luo and Tang 2008; Mavridaki and Mezaris 2015; Redi et al. 2015; Tang et al. 2013]. However, these approaches often tend to be modeled over average user preferences, extracted from a vast, generic range of content, thus diminishing the subjective aspect of selection and neglecting the context of other photos present in the same collection.
Generally, as a pre-selection step, users tend to remove clearly flawed photos, such as for example blurred or wrongly exposed ones, to facilitate the subsequent step of subjective selection, where aspects related to the depicted scene or people present in the photo
Figure 2: An overview of our context-aware framework. (a) An independent image assessment is performed based on the selected quality criteria. (b) Using computed SIFT matches and time stamps, photos are clustered in a hierarchical manner. (c) Obtained clustering is used to define the context for each photo and create the context-aware visualization of the collection. (d) An independent image score is re-estimated for the three context levels, leading to a final scoring and labelling of the photo collection.
are assessed. Detection of such low-quality photos is generally assumed to be an objective process that can be performed on each image independently.
Nevertheless, users implicitly consider the characteristics of the entire collection, as well as surrounding photos, to make a deci-sion for a particular image. For example, photos taken by a non-experienced user with a smartphone camera might present more blur and other artifacts, compared to photos acquired by a profes-sional photographer in a studio. In a non-profesprofes-sional scenario, the user is likely to keep the best photos of their collection as a repre-sentation of an event, even if they are not objectively perfect photos. As an opposite example, pre-selection of sharp photos taken in a professional photo session presents stricter quality requirements, especially when numerous similar photos from the same scene are available. Regardless of the user skills and collection characteristics, if many photos of a particular object, landscape or moment are available, the user might apply stricter criteria to select whether to keep each instance or not. At the same time, they might be more lenient in their decision if only a single version is available. There-fore, the notion of quality context is important, and computation of context characteristics should be considered in the process of photo pre-selection.
To that end, we propose a novel framework that facilitates the process of photo pre-selection by evaluating image quality in the context of the collection in which it belongs and the relevant photos captured in the same scene. Given a collection of photos, originat-ing from the same user and equipment, and representoriginat-ing a soriginat-ingle event (e.g. trip, holiday, party, wedding), we employ a hierarchical
clustering approach to organize collection into similarity-based clusters and define the context of each image.
This clustering, in addition to offering a convenient structure for browsing photos, also provides the context in which quality may be evaluated, using any desired criteria. The context is modeled on three levels, with the following intuition behind each level:
(1) Collection level statistics can be used to reflect the fea-tures of the capturing devices and skills of a photographer. (2) Scene level statistics focus on images of the same gen-eral scene but not necessarily completely overlapping, and aim to reflect environment properties, such as influence of illumination.
(3) Near-duplicate level information focuses on images that depict the same scene or object with minor variations due to occasional user mistakes and other arbitrary changes between similar images.
Using the obtained context information, an independent quality score is adapted according to surrounding photos and transformed into a user friendly selection label. For demonstrating our frame-work, we focus on sharpness as the quality criterion, however our system can be extended to include further assessment criteria. Fig.2 shows an overview of our clustering and assessment framework.
2
RELATED WORK
Image quality assessment methods aim to automatically evaluate the visual quality of an image based on particular criteria. The
majority of existing approaches is represented by machine learn-ing based solutions, where subjective factors (such as image com-position, color characteristics and scene complexity) are aggre-gated together with objective metrics (such as sharpness and scene exposure metrics) [Chang et al. 2016; Datta et al. 2006; Lu et al. 2014; Luo and Tang 2008; Mavridaki and Mezaris 2015; Tang et al. 2013]. At the same time, the evaluation of particular aspects of low-quality pictures is reflected in more specialized research. Detection of blurred photos is often performed using wavelet transform based approaches [Tong et al. 2004; Yan Ke et al. 2006], or by comput-ing blur likelihood over local image windows in Fourier domain [Chakrabarti et al. 2010; Mavridaki and Mezaris 2014]. Exposure artifacts, such as over-exposure, are usually detected using straight-forward approaches based on average intensity information [Datta et al. 2006] or image histograms statistics [Redi et al. 2015].
Whether relying on specific criteria or a combination of multiple factors, most methods assess general image quality or particular defects by analyzing each image independently, and not considering the individual preferences, the photographer’s skills, the capturing environment, or the camera properties.
To encode personal preferences in the context of aesthetic im-age assessment, Yeh et al. [2010] proposed a photo ranking system combining general aesthetics features with personal preferences, which are manually defined or learned from a chosen photo exam-ple. In the work of Bychkovsky et al. [2011], an extensive dataset of photo pairs before and after processing by different professional retouchers was created. Based on this dataset, a tone style adjust-ment model was learned, which could be adapted to a particular user using a small set of training photos.
The described preferences-based approaches perform the anal-ysis of photos independently, where the information about other photos, captured in the same conditions, is not taken into consid-eration. The knowledge of the photo context – characteristics for the entire album and specific scenes – could potentially assist the process of automatic photo assessment and selection, even without explicit user modeling.
To extract this necessary context information, we need to find natural boundaries between different captured scenes within a col-lection, which can be achieved using clustering methods. Photo album clustering is typically obtained using temporal [Cooper et al. 2005; Platt et al. 2003] or similarity [Ceroni et al. 2015; Chu and Lin 2008; Loui and Savakis 2003] information. Among clustering approaches, hierarchical clustering takes a prominent place. As it does not require a pre-defined number of clusters, it is versatile in its application and suitable for different types of data, and, in par-ticular, images. Hierarchical clustering is often applied for creating tree-like representations for image browsing, for example based on color histogram similarities [Krishnamachari and Abdel-Mottaleb 1999] or on geo-location information [Epshtein et al. 2007]. In our proposed method we also rely on hierarchical clustering, but, in contrast to previous methods, our clustering approach is based on similarity computed from matches defined over SIFT descriptors. More importantly, instead of a typical tree-like browsing structure, we obtain a flat representation of the entire collection, which can serve as a convenient way of image browsing (which is demon-strated in Section 4.4).
Collection clustering and quality assessment may also be per-formed in conjunction, either in an independent manner [Loui and Savakis 2003] or by considering both tasks simultaneously [Ceroni et al. 2015]. In the latter case, in the method of Ceroni et al., a set of features is accumulated on intra- and inter-cluster levels, and a final decision to keep or not to keep a particular photo is obtained using a machine learning system. Although some of their features depend on the clustering, their method does not perform adaptive per-album and per-cluster evaluation, but rather learns a binary classifier that reflects a model learned over numerous non-related albums and users. Another approach for context-aware selection was recently introduced by Chang et al. [2016], where pairwise comparisons are performed within photo series of similar (near-duplicate) photos using deep convolutional neural networks, to obtain a relative ranking of images. This method demonstrates impressive results, however it is limited to ranking and selecting among small sets of nearly identical photographs, although their approach also presents a potential for further extension to handle complete collections.
In contrast, in our framework we consider the complete collec-tion as well as different levels of image context simultaneously. By performing hierarchical similarity clustering, the necessary multi-level context is obtained, which gives an intuitive collec-tion representacollec-tion and provides a base for adaptive image scoring and labeling. While several previous methods are based on a pre-defined criteria for image quality assessment, in our work we opt for a more flexible approach that can adapt any image quality cri-teria to consider the context of each photo. This way, our method can provide the evaluations that are closer to user’s expectations.
3
CONTEXT-BASED ASSESSMENT
3.1
Method Overview
The goal of our framework is to simultaneously organize and as-sess the quality of photographs belonging to a photo collection by considering not only each image independently but also its sur-rounding context. To achieve this, our approach consists of the following stages, which are illustrated in Fig.2.
First, for each image, an independent image quality score is computed based on the selected quality criteria (Fig.2a). Second, an input collection is grouped into temporal windows, and then each temporal window is hierarchically clustered into scene-level clusters and near-duplicate clusters (Fig.2b). These clusters are used to define the similarity-based context of each image and create the intuitive collection visualization through the context-aware representation (Fig.2c).
The per-image independent quality score computed initially is then re-estimated for the three context levels, defined by collection, scene-level and near-duplicate level statistics (Fig.2d). Finally, the weighted sum of context-based scores for different levels is used to obtain a global scoring and subsequent labeling of each image, flagging images as Accept, Reject or Maybe, similar to common photo editing workflows.
We have opted to demonstrate our framework using sharpness as the underlying image quality criterion. Accordingly, a photo is suggested to be removed when its sharpness is not sufficient (or, in other words, a photo is too blurred) in the context of the
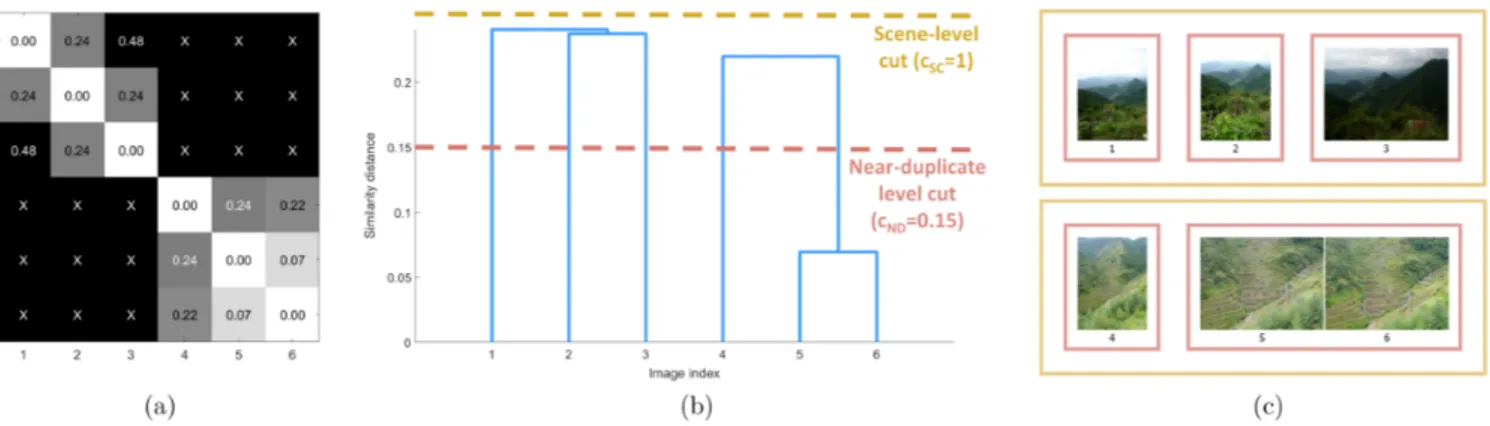
Figure 3: Demonstration of our similarity-based hierarchical clustering on an example set of six images. (a) Similarity distance matrix between each pair of images. Crosses indicate that no matches between images are found. (b) Dendrogram of hierarchi-cal clustering based on similarity distances. Cuts at specific height (corresponding to the similarity distance) produce clusters grouped by different levels of similarity. (c) Output of clustering. The images are clustered into two scenes (yellow borders), where two images from the second scene (5 and 6) are grouped into near-duplicates cluster (red borders). Image credits: INRIA Holidays dataset [Jegou et al. 2008].
collection. Among the criteria leading to image rejection, blur in its different forms is one of the most important factors [March-esotti and Perronnin 2013; Wolters et al. 2014], as it can affect both professional and amateur photographs and it is hard to remove in post-processing. At the same time, the sharpness requirements largely vary depending on content type and user intentions, hence the need for context-aware adaptation.
Our framework can be adapted to other independent metrics or extended to include multiple factors, such as exposure issues or noise. In effect, any existing method can be used to obtain initial independent image quality scores, as long as the scores provided are defined within a limited range of values (e.g. 0 to 1, not 0 to infinity).
3.2
Independent Image Quality Score
Existing techniques are capable of assessing sharpness or blur in individual images, but they cannot be easily adapted to the nature of particular collections. For example, a collection captured in difficult illumination conditions by an amateur photographer might exhibit a large number of blurred photos. However, typical blur assessment methods are pre-trained on a wide range of photos, thus they can underestimate and reject many photos in a low-quality collection. In our method, we use a traditional blur assessment method as an initial quality estimator for each image, and adapt its result to the particular context at a later stage.
We adopt the wavelet-based blur detection by Tong et al. [2004]. The Haar wavelet transform is applied to an image, and edge maps Ei are generated on three scales, using the pyramid imagesLH (vertical details),HL (horizontal details), and HH (diagonal details):
Ei=
q LH2
i + HL2i+ HHi2 (i = 1, 2, 3). (1)
Non-maximum suppression is applied to process all maps into the equivalent scale, using scale-dependent local windows. Depend-ing on the edge properties across scales, each pixel is assigned an edge or non-edge value, and each edge pixel is further assigned
one of four edge structure types: Dirac-structure, Roof-structure, Astep-structure and Gstep-structure. In particular, Dirac-structure and Astep-structure pixels are considered sharp (as they tend to disappear in presence of blur), and their total numberNda, along with the total number of edge pixelsNedдe is used to compute a final sharpness score:
sI =NNda
edдe. (2)
The obtained sharpness score is used as an individual image score in our approach. Sharpness histograms for three different photo collections are shown in Fig. 4. Context-based adaptation of the obtained score is described in Section 3.4.
3.3
Context Extraction by Hierarchical
Clustering
After individual image quality scores are obtained, they can be adapted to the context of each image. This allows our framework to consider the quality of the image in relation to images surrounding it (same scene, taken at a similar time and so on). In this section, we describe how the context of each image is determined. As a first step, the entire collection is organized into time-based groups. Then, inside each time group, a hierarchical tree is constructed, using the proposed image similarity metric. Finally, each time group is clustered into two levels: scene level and near duplicate level, which group the photos according to the visual similarity between them. Time-based Grouping. As an input collection can span a large time range, varying from several minutes to days, we first split the entire collection into sequential temporal windows, to facilitate fur-ther similarity context extraction. Based on the photo time stamps, temporal windows are computed using the solution by Platt et al. [2003]. In their method, temporal window boundaries are created when a time gapдN between two images (at the positionN ) ex-ceeds the time gap average across neighboring images, satisfying
the following condition: loд(дN) ≥K + 1 2d + 1 d Õ i=−d loд(дN +i), (3)
where the parameters are set by the authors asK = loд(17) and d = 10.
Time stamps for this analysis are extracted from EXIF data, typi-cally available for most photographs. If no reliable timestamps are available, the complete collection is considered as a single temporal window in further analysis.
Similarity-based Distance. Each obtained temporal window is further clustered in a hierarchical manner, providing scene-level clusters and near-duplicate clusters of images. Before clustering, a similarity-based distance metric is computed between all images. Our distance metric is based on the SIFT features [Lowe 1999], due to their advantage in identifying the image matches even in presence of distortions (which often appear in the series of similar photos). For each pair of images within a temporal window, two sets of SIFT descriptors are compared using the Euclidean distance. Given a pair of imagesI and J, the number of matching descrip-tors [Lowe 1999] is computed in both directions:mI →J andmJ →I. Then, our distance between a pair of images is given by:
d(I, J) = 10
M(I, J) · P(I, J), (4) whereM(I, J) is the average of number of matches (mI →J+mJ →I)/2, andP(I, J) is a measure of pair matches consistency, defined as:
P(I, J) =max(mmin(mI →J,mJ →I)
I →J,mJ →I). (5) The nominator in Eq.(4) is set to 10, to scale the output distance to approximately a 0-1 range for most images.
Based on the computed pair-wise image similaritiesd(I, J), we obtain a similarity distance matrix (an example is shown in Fig.3a). The distance matrix is computed within each temporal window and then used to perform hierarchical agglomerative clustering [Everitt et al. 2011].
Hierarchical Tree Construction. We chose the hierarchical clus-tering approach, as it does not require a pre-defined number of clusters, and it allows to create a specific cluster structure, where clusters of different similarity are enclosed into each other, as it ex-plained below. Such structure allows to reflect natural organization of photos, where photos are usually considered in connection with similar photos from the same scene.
Using the similarity distances computed in the previous step, the clustering is performed in a bottom-up approach, where each image initially belongs to a cluster containing only the image itself. At each step, the two clusters with the lowest similarity distance are merged together into a new cluster. The distance between single-image clusters can be directly retrieved from the similarity distance matrix. The distance between two clusters with multiple images C1andC2is defined as the shortest distance over all possible pairs
of images, where one image from a pair belongs to the clusterC1
and another image belongs to the clusterC2(this way of cluster
merging is also known as the single-linkage criteria).
The merging process continues recursively until only a single cluster is left, where all clusters are merged together into one hier-archical binary tree. It is worth noting that in our case there will be pairs of images with no matches present between them, thus leading to infinite similarity distance (denoted as X in Fig.3a). In this case, the merging stops when one cluster is achieved or when the distance between all remaining clusters is infinite. Thus, it is possible to obtain multiple, unconnected hierarchical trees. An ex-ample of such case is demonstrated in Fig.3b, where two trees are obtained, due to the absence of similarity between the two scenes. Note that the depth of branches in the hierarchical tree corresponds to the similarity distances between the two connected clusters.
Tree Cutting. After the hierarchical tree is created, it can serve to partition images into final clusters corresponding to different levels of similarity. To achieve this, the hierarchical tree can be cut at different levels, where the tree is traversed from top to the bottom, and all connected nodes below a particular cut level are assigned a single cluster. To obtain scene-level and near-duplicate clusters, the tree is cut at two levels of similarity distance, using cut thresholdscN DandcSC, wherecN D < cSC, as the near-duplicate clusters with higher similarity should be enclosed into the scene-level clusters. As a result of the conducted experiments, the cut thresholds were set ascSC = 1 and cN D = 0.15, since we found
that these distances lead to a clear separation into scene-level and near-duplicate groupings for all collections tested. A visualization of the tree cuts and resulting clusters is given in Fig.3b-c.
3.4
Context-based Photo Scoring and Labeling
The final step of our framework is the adaptation of individual image scores computed in Section 3.2, according to the context extracted at different levels (Section 3.3). The context of each image is defined on three levels: collection level, scene cluster level and near-duplicate cluster level. In the following we refer to the three levels using the C, SC, N D identifiers. To obtain context-dependent image scores, we utilize the z-score [Kreyszig 2007] (based on the assumption that the independent scores follow Gaussian distribution), which can be computed from the independent image scoresI as follows:
zIL=
sI −µL
σL , (6)
whereµLis a mean of quality scores on the levelL ∈ C, SC, N D, andσLdenoting a standard deviation on the levelL. It is worth pointing out, that each image belongs to only one cluster from each level (it can be observed in Fig. 4).
The intuition behind the z-score is that it normalizes score values around the mean value of the corresponding level, therefore adapt-ing to its quality statistics. Examples of collection-level distributions are shown in Fig. 4, showing the necessity of such adaptation: over-all sharpness can vary significantly across different collections.
In this manner, a z-score is computed on three levels, where each level provides an estimation how good the photo in the context of entire collection, its containing scene and among very similar near-duplicate photos. If the image is unique at its level (for example, no other similar photos have been taken in the same scene), then no other images are available for the computation of the statistics information, and we consider its z-score as undefined.
The global scoreZI of an image is computed by considering the z-scores computed previously at each context level:
ZI =zIC + zISCn + zIN D
z , (7)
wherezIC is an image score on the collection level,zISCis a scene
level score,zIN D is a near-duplicates level score, andnz is the
number of defined z-scores for this image (number of non-singleton clusters). Undefined z-scores for a given image are set to 0 for this calculation.
The obtained score can either be used directly for sorting and displaying the photo collections, or it can be transformed into user-friendly selection label. To facilitate the process of further photo selection, we provide users with three types of labels for each image: Accept, Reject or Maybe. The threshold values for this output labeling can be determined based on user input, for example, from the percentage of photos that user wants to keep, or set to pre-defined values. In our experiments, we define thresholdsZI ≥ 0 for the label Accept, −0.5 ≥ZI < 0 for the label Maybe, and ZI < −0.5
for the Reject label. This way the labels reflect the nature of z-scores, whereZI = 0 corresponds to the mean of the scores across
three levels of the context, and images with scores below zero are worse quality-wise than other neighboring images from their corresponding context.
4
EXPERIMENTS
Accept Maybe Reject Fleiss’ kappa agreement Travel collection 46% 26% 28% 0.470 Wedding ceremony 47% 27% 26% 0.423 Professional session 47% 36% 17% 0.172 Sport event 24% 30% 46% 0.336 Halloween party 35% 34% 31% 0.256 Table 1: Dataset characteristics computed from user study results: label selection percentage and level of agreement be-tween observers, according to Fleiss’ kappa measure [Fleiss and Cohen 1973].
To demonstrate the effectiveness of our approach, we have con-ducted a user study, where people’s pre-selection decisions have been collected for various types of collections. Then, the obtained data has been used to verify the benefit of our context-aware method in comparison with independent methods for detection of low qual-ity images, which do not adapt to the collection properties.
4.1
Dataset
Although a number of image datasets for aesthetic assessment (with corresponding evaluations by users) is publicly available, such as the Photo.Net dataset [Datta et al. 2006] or the AVA dataset [Murray et al. 2012], these datasets are created to address the task of independent image assessment. Thus each image is given without any context information about the original collection. Moreover, these datasets are acquired from photographers’ peer-review social
networks, hence the majority of presented photos are high-quality post-processed photos, which represent the final outcome of a photographer’s work.
In our work however, we aim to assess the photos at a very early stage of pre-selection, when a large collection of photos is just captured and needs to be organized. The recently proposed Photo Triage dataset [Chang et al. 2016] partially addresses these problems, as this dataset contains photos taken by a wide range of users and is organized into series of similar shots from the same scene. Nevertheless, these photo series still lack the context of the corresponding containing collections, which better reflect the overall intentions and skills of a photographer.
Since our approach performs photo evaluation based on multi-level context rarely available in publicly available datasets, we decided to evaluate its efficiency with a user study, performed on 5 photo collections of different content type. The first collection con-sists of travel photos, taken mostly outdoors, with a small number of low-quality images. The second collection consists of wedding photos, captured indoors in difficult lighting conditions, and con-taining a noticeable number of blurred pictures. The third collection is a photo session conducted by a professional photographer (the photos are extracted before any processing is applied to them), with a consistent level of photo quality. The fourth collection covers a sport event (a volleyball match), where multiple pictures present motion blur due to the players’ movements. Finally, the fifth col-lection is taken during a Halloween party and presents cases of out-of-focus and motion blurred photos. All collections, except the professional collection, were acquired from the photo albums in YFCC100m dataset [Kalkowski et al. 2015; Murray et al. 2012]. The professional photo session is acquired directly from a photographer. As the initial photo albums are of different size, for our analyzed collections we extract 100 photos from each album, in their origi-nal consecutive order, hence keeping the scene context uorigi-naltered. Each image is resized, so that the longest side of the photograph is 1920 pixels. In this manner, five collections, each of 100 photos, are created. Example clusters of three collections along with the statistics on their sharpness level (Section 3.2) can be seen in Fig.4.
4.2
User Study
The user study has been performed with 15 participants (9 male and 6 female), where each participant regularly takes personal photos in every-day life and is familiar with the task of photo selection and organization. Two of the participants occasionally use professional cameras, and can be considered as experts. Every participant was presented with each of the collections (selected in a random order), and was given the task of labeling sharp and non-sharp photos. The user could assign one of three labels: Accept if he considered a photo sharp enough to keep, Reject if a photo was too blurry and not worth keeping, and Maybe if a photo was not absolutely sharp but still worth keeping or if they could not otherwise make a decision. A user could freely browse through the entire collection during the labeling process, as in a typical real-life selection scenario, and zoom to view the images at full resolution.
The agreement between observers for each collection is ana-lyzed using Fleiss’ kappa measure [Fleiss and Cohen 1973]. Detailed
Figure 4: Visualization of clustering and labeling on example clusters extracted from the test collections. Blue borders indicate temporal clusters, yellow borders indicate scene level clusters, and red borders indicate near-duplicates clusters. (a) Profes-sional photo collection with a consistent level of quality. (b) Sport collection containing multiple pictures with motion blur. (c) Halloween party collection presenting large number of blurred photos, represented by out-of-focus and motion blurred shots. On the right: histograms of sharpness values corresponding to all photos in the collections containing presented clus-ters. Image credits: professional photo session provided by Nikolay Kuzovkin, sport event and Halloween party collections provided under Creative Commons by Flickr user Parker Knight. The travel collection and the wedding ceremony collection are not demonstrated in the figure, due to copyright restrictions.
results of the assigned labels by participants as well as the corre-sponding Fleiss’ kappa value for each collection are given in Table 1. According to the interpretation of Fleiss’ kappa measure, the level of user agreement ranges from fair to moderate on most of the collections, with the exception of the professional session, where a κ = 0.1827 indicates only slight agreement between observers. This is not a surprising result, as this collection contains very little blur as well as many repetitive images. This observation was supported by participants’ feedback as well, many of which mentioned that they had trouble assessing this particular collection. Given the low degree of blur as well as the low agreement in this set, it is not included in further analysis.
4.3
Results and Discussion
To evaluate the performance of the proposed approach, the out-put labels of our method were compared with the labels given by each participant in the experiment described above. The metrics of accuracy, precision, recall and F-measure [Fawcett 2006] were calculated for each label and user separately, and average values of these metrics were computed across all participants. The perfor-mance comparison is given in Table 2. For each metric, a higher score indicates better performance. Both precision and recall values are important to estimate the correctness of label prediction in our task, therefore the F-measure is a good indicator of the overall performance, since it is computed as the harmonic mean between precision and recall.
To assess the benefit of our adaptation of quality scores accord-ing to context, we compare the performance of our solution against the performance of the original wavelet-based sharpness estimation method by Tong et al. [2004], which performs image assessment in an independent manner, i.e. without considering the image con-text. To obtain labels for each photo according to the method of Tong et al., the sharpness output of their method was thresholded. The thresholds were estimated as follows: sharpness scores were computed and averaged over 1600 different images, leading to an average score of 0.34. Half a standard deviation (σ/2 = 0.1) was considered above and below this average, obtaining the following thresholds and corresponding labels: an image is labeled as Reject if sharpnesssI < 0.24, Maybe if 0.24 ≤ sI ≤ 0.44, and Accept if sI > 0.44. Then, for the obtained labels, the same performance
metrics are computed.
As shown in Table 2, the adaptation of image quality scores using our framework offers a significant improvement on all collections tested, relative to the results obtained with the independent method of Tong et al. [2004]. In collections containing more challenging photographs and conditions (Wedding ceremony, Sport event and Halloween party), our method showed the most improvement. As these collections no longer fit the implicit criteria of the sharpness estimation method, falling well below the expected quality, most of the photos are rejected according to the original non-adapted score. On the contrary, the user study participants adapt to the album quality level and the context, and tend to accept even not perfectly
Travel collection Wedding ceremony Sport event Halloween party Independent Context-dependent Independent Context-dependent Independent Context-dependent Independent Context-dependent Accuracy 0.552 0.692 0.479 0.605 0.595 0.568 0.466 0.536 Precision 0.495 0.569 0.228 0.448 0.279 0.452 0.185 0.384 Recall 0.482 0.559 0.431 0.471 0.368 0.463 0.313 0.408 F-measure 0.435 0.560 0.288 0.452 0.297 0.432 0.178 0.387
Table 2: Comparison of labeling performance based on independent blur assessment scores using [Tong et al. 2004] and context-dependent scores obtained using our approach, for several image collections. Higher value of each measure indicates better performance, where F-measure can be used as an indicator of the overall performance.
sharp photos that might be important for the coverage of such an event. Our method manages to adapt to the quality level in a similar way and provides labeling results, which are more consistent with the users’ decisions. At the same time, noticeable improvements were measured even for the travel collection, where overall image quality was relatively high and few blurry photos were present, showing the ability of our approach to adapt to the context of each collection and image.
Additional performance analysis was conducted using receiver operating characteristic (ROC) curves, which were computed for each of three labels over the all evaluated collections. The shape of the curves, shown in Fig.5, as well as the Area Under the Curve measures, given in Table 3, demonstrate better performance of our method for each label type. It can be noted that the independent method tends to correctly identify photos pre-labeled by users for rejection, while it does not show high performance on two other labels. This agrees with our intuition that the non-adapted method is likely to reject the lower quality photos, while users try to find acceptable photos even among imperfect ones.
Another interesting observation that can be made from the ROC curves concerns the Maybe labels. Both the independent method and our context-dependent method suggest performance that is close to labeling by chance for that label. Indeed, the introduction of the Maybe labels makes the task of automatic pre-labeling more challenging. Despite the ambiguity that a Maybe label may intro-duce, we have opted for including it in our pre-labelling of images to facilitate the task of the end user. Our approach is aimed as a pre-process prior to the user’s final selection of images, enabling them to browse, and decide which images they want to keep or not more efficiently. Given that our approach relies on objective image assessment criteria and therefore cannot consider more subjective preference aspects, using a binary pre-labelling would oblige users to review all photos for making their final selection. In contrast, using a Maybe label, allows us to use the more definite Accept and Reject labels with higher confidence. As such, the end user in this case would only need to verify images with a Maybe label assigned. In addition, to demonstrate the flexibility of our framework, we perform a similar analysis using a second blur assessment method, namely the approach of Mavridaki et al. [2014]. As their method relies on an SVM-based classification, we take the probability esti-mates as an output [Chang and Lin 2011]. For the computed prob-ability estimates,Pi = 1 indicates that the image is sharp, while
Pi = 0 indicates that the image is blurred. The probability is used as
an independent image quality score, and it is adapted to the context as described in Section 3. The output photo labeling for this method was performed in the following way: an image is labeled as Reject ifPi < 0.4, Maybe if 0.4 ≤ Pi ≤ 0.6, and Accept ifPi > 0.6. Table 4
provides a comparison of the independent and context-dependent results for the different image collections. Similar to our analysis using the method of Tong et al., we find that in this case our ap-proach also improves the initial results and leads to labels that better correspond to user assessments.
Area Under The Curve
Independent
Context-dependent
Accept
0.520
0.643
Maybe
0.499
0.512
Reject
0.629
0.663
Table 3: Area Under the Curve measured for independent method of Tong et al. [2004] and our context-dependent method (computed over all collections given in Table 2). Higher value indicates better performance.
Although our approach shows promising results for many col-lections, there are some challenging cases that merit future study. First, even aided by the context, our method largely depends on the independent score used as an initial quality estimator. In the demonstrated sharpness-based example framework, it is not un-common that the sharpness estimation method itself fails and pro-vides a wrong score (for instance, a blurred image can get a high sharpness score due to the specific nature of blur). In case of such failure, the context-based adaptation cannot correct the original score. Furthermore, an incorrect score assigned to one image from a multiple-images cluster can negatively affect score adaptation for the surrounding images. As a second challenge, the context ex-traction by clustering can be unreliable in some conditions. Photos of low quality, especially captured in low-light conditions, often lack reliable information for the SIFT matching, thus leading to unreliable clustering and inaccurate context-adaptation as a result. Finally, we would like to emphasize that our context-adaptive assessment does not aim to achieve the best results in the task of blurred image detection itself. Since our adapted scores rely on the original scores provided by the independent quality assessment
Figure 5: Receiver operating characteristic (ROC) curves for label prediction by independent method of Tong et al. [2004] and our context-dependent method (computed over all collections given in Table 2). The closer the curve extends to the top left corner, the better performance for particular label is achieved. The diagonal line represents performance of random labeling.
method used in each case, they are implicitly dependent on the effectiveness of the image quality criterion chosen. The flexibility of our framework however, allows for different criteria to be used interchangeably. F-measure Independent method by Mavridaki et al. [2014] Context adaptation by our method Travel collection 0.5444 0.5462 Wedding ceremony 0.5459 0.5771 Sport event 0.3735 0.4459 Halloween party 0.2562 0.4472
Table 4: Performance of the labeling obtained with indepen-dent blur estimation method by Mavridaki et al. [2014], com-pared with the results obtained using context-adaptation by our approach.
4.4
Implementation & Visualization
In addition, we would like to discuss a few aspects of our results visualization, which provides a user-friendly way of viewing the photo collection.
Previous approaches that rely on hierarchical clustering for or-ganizing photographs present images in a tree browsing structure, where one representative image replaces the contents of the cluster [Epshtein et al. 2007; Krishnamachari and Abdel-Mottaleb 1999]. However, in the typical photo viewing and managing software (e.g. Picasa, Lightroom) flat representations are preferred, with flags and other identifiers used to label photographs.
With our approach, we construct a flat representation and rely on enclosing borders to identify clusters at different context levels (temporal, scene-level, near-duplicate), as shown in Fig.4. The se-lection labels can be assigned to images, similar to decision flags in popular photo management software, allowing the user to quickly
understand the structure of their collection and perform their final decision, without having to navigate several levels within a tree structure.
The cluster-based context visualization of collections is imple-mented in a form of auto-generated HTML pages, which show image thumbnails with suggested labels, in a manner similar to image browsers (examples are shown in Fig.4). The HTML page can be freely browsed and zoomed without affecting the frames delimiting photo clusters.
Our complete solution was implemented in Matlab, and timings for processing photo collections were measured on an Intel Core i7 PC 2.80 GHz with 16 GB RAM, running Windows 7 64-bit. Using our current framework, a collection of 100 images of HD resolution can be fully processed in about 90 seconds, with a linear growth to 460 seconds for 500 images. The clustering step takes around 40% of the execution time, and the sharpness estimation step takes around 55% of the execution time.
5
CONCLUSION
In this work, we propose a novel context-aware approach of photo assessment, where an independent image quality metric can be adapted to the content of an analyzed photo collection. Our ap-proach extracts the context of each photo by means of hierarchical clustering, where each level reflects different degrees of similarity between photos. Along with statistical information, our cluster-ing method provides a flat collection representation with intuitive indications of the scene boundaries, which can be used to assist the user in the task of photo pre-selection. The extracted context information is used to adapt the initial image quality score for each level of context and compute a final weighted score for every image, from which an output photo label is obtained. The conducted ex-periments demonstrate that we are able to model user pre-selection behavior, and that the context-adapted score performs significantly better than the original computed score in the scenarios where pre-selection decision cannot be made independently.
We believe that the proposed approach is the first step towards user-aware photo assessment methods. Modeling the entire spectra of user preferences is indeed a big challenge, and in this research we attempt to address one of the multi-dimensional quality aspects. However, adapting to the collection context already allows us to model the photographer’s intentions, skills and capturing environ-ment to some extent. In this work, the three context levels are considered as equally important. Nevertheless, further study of the influence of each context level on the final selection of users could provide useful insights on the relative importance of z-scores from different levels in the weighting step. Finally, evaluating the performance of our approach with other image quality assessment metrics is also an interesting direction for future research, as well as searching for a solution that would allow us to combine dif-ferent types of quality scores into a more complete image quality assessment.
REFERENCES
Vladimir Bychkovsky, Sylvain Paris, Eric Chan, and Frédo Durand. 2011. Learning photographic global tonal adjustment with a database of input/output image pairs. In Computer Vision and Pattern Recognition (CVPR), 2011 IEEE Conference on. IEEE, 97–104.
Andrea Ceroni, Vassilios Solachidis, Claudia Niederée, Olga Papadopoulou, Nattiya Kanhabua, and Vasileios Mezaris. 2015. To keep or not to keep: An expectation– oriented photo selection method for personal photo collections. In Proceedings of the 5th ACM on International Conference on Multimedia Retrieval. ACM, 187–194. Ayan Chakrabarti, Todd Zickler, and William T Freeman. 2010. Analyzing
spatially-varying blur. In Computer Vision and Pattern Recognition (CVPR), 2010 IEEE Confer-ence on. IEEE, 2512–2519.
Chih-Chung Chang and Chih-Jen Lin. 2011. LIBSVM: A library for support vector machines. ACM Transactions on Intelligent Systems and Technology 2 (2011), 27:1– 27:27. Issue 3. Software available at http://www.csie.ntu.edu.tw/~cjlin/libsvm. Huiwen Chang, Fisher Yu, Jue Wang, Douglas Ashley, and Adam Finkelstein. 2016.
Automatic triage for a photo series. ACM Transactions on Graphics (TOG) 35, 4 (2016), 148.
Wei-Ta Chu and Chia-Hung Lin. 2008. Automatic selection of representative photo and smart thumbnailing using near-duplicate detection. In Proceedings of the 16th ACM international conference on Multimedia. ACM, 829–832.
Matthew Cooper, Jonathan Foote, Andreas Girgensohn, and Lynn Wilcox. 2005. Tem-poral event clustering for digital photo collections. ACM Transactions on Multimedia Computing, Communications, and Applications 1, 3 (2005), 269–288.
Ritendra Datta, Dhiraj Joshi, Jia Li, and James Z Wang. 2006. Studying aesthetics in photographic images using a computational approach. Computer Vision–ECCV 2006 (2006), 288–301.
Boris Epshtein, Eyal Ofek, Yonatan Wexler, and Pusheng Zhang. 2007. Hierarchical photo organization using geo-relevance. In Proceedings of the 15thannual ACM international symposium on Advances in geographic information systems - GIS ’07. ACM Press, New York, New York, USA, 1.
Brian S. Everitt, Sabine Landau, Morven Leese, and Daniel Stahl. 2011. Cluster Analysis. John Wiley & Sons, Ltd, Chichester, UK.
Tom Fawcett. 2006. An introduction to ROC analysis. Pattern recognition letters 27, 8 (2006), 861–874.
Joseph L Fleiss and Jacob Cohen. 1973. The equivalence of weighted kappa and the intraclass correlation coefficient as measures of reliability. Educational and psychological measurement 33, 3 (1973), 613–619.
Herve Jegou, Matthijs Douze, and Cordelia Schmid. 2008. Hamming Embedding and Weak Geometric Consistency for Large Scale Image Search. In Proceedings of the 10th European Conference on Computer Vision: Part I (ECCV ’08). Springer-Verlag, 304–317.
Sebastian Kalkowski, Christian Schulze, Andreas Dengel, and Damian Borth. 2015. Real-time analysis and visualization of the YFCC100M dataset. In Proceedings of the 2015 Workshop on Community-Organized Multimodal Mining: Opportunities for Novel Solutions. ACM, 25–30.
Erwin Kreyszig. 2007. Advanced engineering mathematics. John Wiley & Sons. Santhana Krishnamachari and Mohamed Abdel-Mottaleb. 1999. Image browsing using
hierarchical clustering. In Computers and Communications, 1999. Proceedings. IEEE International Symposium on. IEEE, 301–307.
Alexander C Loui and Andreas Savakis. 2003. Automated event clustering and qual-ity screening of consumer pictures for digital albuming. IEEE Transactions on Multimedia 5, 3 (2003), 390–402.
David G Lowe. 1999. Object recognition from local scale-invariant features. In Computer vision, 1999. The proceedings of the seventh IEEE international conference on, Vol. 2. Ieee, 1150–1157.
Xin Lu, Zhe Lin, Hailin Jin, Jianchao Yang, and James Z. Wang. 2014. RAPID: Rating Pictorial Aesthetics using Deep Learning. Proceedings of the ACM International Conference on Multimedia - MM ’14 (2014), 457–466.
Yiwen Luo and Xiaoou Tang. 2008. Photo and Video Quality Evaluation: Focusing on the Subject. In Proceedings of the 10th European Conference on Computer Vision: Part III (ECCV ’08). Springer-Verlag, 386–399.
Luca Marchesotti and Florent Perronnin. 2013. Learning beautiful ( and ugly ) attributes. British Machine Vision Conference (2013), 1–11.
Eftichia Mavridaki and Vasileios Mezaris. 2014. No-Reference Blur Assessment In Natural Images Using Fourier Transform And Spatial Pyramids. Image Processing (ICIP), 2014 IEEE International Conference on. IEEE, 2014 1, October (2014), 566–570. Eftichia Mavridaki and Vasileios Mezaris. 2015. A comprehensive aesthetic quality
assessment method for natural images using basic rules of photography. In 2015 IEEE International Conference on Image Processing (ICIP). IEEE, 887–891. Naila Murray, Luca Marchesotti, and Florent Perronnin. 2012. AVA: A large-scale
database for aesthetic visual analysis. In 2012 IEEE Conference on Computer Vision and Pattern Recognition. IEEE, 2408–2415.
John C. Platt, Mary Czerwinski, and Brent A. Field. 2003. PhotoTOC: Automatic clustering for browsing personal photographs. ICICS-PCM 2003 - Proceedings of the 2003 Joint Conference of the 4th International Conference on Information, Communications and Signal Processing and 4th Pacific-Rim Conference on Multimedia 1 (2003), 6–10.
Miriam Redi, Nikhil Rasiwasia, Gaurav Aggarwal, and Alejandro Jaimes. 2015. The beauty of capturing faces: Rating the quality of digital portraits. In 2015 11thIEEE International Conference and Workshops on Automatic Face and Gesture Recognition (FG). IEEE, 1–8.
Xiaoou Tang, Wei Luo, and Xiaogang Wang. 2013. Content-Based Photo Quality Assessment. IEEE Transactions on Multimedia 15, 8 (Dec. 2013), 1930–1943. Hanghang Tong, Mingjing Li, Hongjiang Zhang, and Changshui Zhang. 2004. Blur
detection for digital images using wavelet transform. In Multimedia and Expo, 2004. ICME’04. 2004 IEEE International Conference on, Vol. 1. IEEE, 17–20.
Maria K Wolters, Elaine Niven, and Robert H Logie. 2014. The art of deleting snapshots. In CHI’14 Extended Abstracts on Human Factors in Computing Systems. ACM, 2521– 2526.
Yan Ke, Xiaoou Tang, and Feng Jing. 2006. The Design of High-Level Features for Photo Quality Assessment. In 2006 IEEE Computer Society Conference on Computer Vision and Pattern Recognition - Volume 1 (CVPR’06), Vol. 1. IEEE, 419–426. Che-Hua Yeh, Yuan-Chen Ho, Brian A Barsky, and Ming Ouhyoung. 2010.
Person-alized photograph ranking and selection system. In Proceedings of the 18th ACM international conference on Multimedia. ACM, 211–220.

![Table 1: Dataset characteristics computed from user study results: label selection percentage and level of agreement be-tween observers, according to Fleiss’ kappa measure [Fleiss and Cohen 1973].](https://thumb-eu.123doks.com/thumbv2/123doknet/12428801.334363/7.918.80.438.569.703/dataset-characteristics-computed-selection-percentage-agreement-observers-according.webp)


