HAL Id: hal-01801118
https://hal-mines-albi.archives-ouvertes.fr/hal-01801118
Submitted on 1 Jun 2018
HAL is a multi-disciplinary open access
archive for the deposit and dissemination of
sci-entific research documents, whether they are
pub-lished or not. The documents may come from
teaching and research institutions in France or
abroad, or from public or private research centers.
L’archive ouverte pluridisciplinaire HAL, est
destinée au dépôt et à la diffusion de documents
scientifiques de niveau recherche, publiés ou non,
émanant des établissements d’enseignement et de
recherche français ou étrangers, des laboratoires
publics ou privés.
Reducing CO2 emissions from oil shale semicoke
smoldering combustion by varying the carbonate and
fixed carbon contents
M. Sennoune, Sylvain Salvador, Michel Quintard
To cite this version:
M. Sennoune, Sylvain Salvador, Michel Quintard. Reducing CO2 emissions from oil shale semicoke
smoldering combustion by varying the carbonate and fixed carbon contents. Combustion and Flame,
Elsevier, 2011, 158 (11), pp.2272 - 2282. �10.1016/j.combustflame.2011.04.004�. �hal-01801118�
Reducing CO
2
emissions from oil shale semicoke smoldering combustion
by varying the carbonate and fixed carbon contents
M. Sennoune
a,⇑, S. Salvador
a, M. Quintard
baUniversité de Toulouse, Mines Albi, CNRS, Centre RAPSODEE, FRE 3213, Campus Jarlard, F-81013 Albi Cedex, France bUniversité de Toulouse, CNRS, IMFT, Allée Camille Soula, F-31400 Toulouse, France
Keywords: Smoldering front Combustion Fixed-bed Oil shale Semicoke Carbonate mineral
a b s t r a c t
One technique used to recover oil from ground oil shale, or to burn oil shale semicoke, consists of prop-agating a smoldering front through a packed bed. One drawback of this technique is that the mineral structure of the shale is decarbonated due to the high temperature of the front. This phenomenon causes 70% of the CO2emissions released during such processes. The remaining 30% result from the fixed carbon oxidation. With the aim of decreasing the front temperature and thus avoiding decarbonation at the front passage, the impact of two parameters was experimentally tested in this work: first, increasing the amount of carbonates, as they may play the role of a heat sink, and second, decreasing the amount of fixed carbon in the medium. It is shown that increasing the amount of carbonates can only decrease the front temperature to 800!C but not lower, which is still too high to avoid decarbonation. On the other hand, the front temperature can be decreased enough for decarbonation to be almost completely avoided by reducing the amount of fixed carbon. At the low temperatures reached, almost all the fixed carbon is oxidized, but not all the oxygen transported in the air is consumed by the chemical front. The velocity of the front is consequently decreased.
1. Introduction
An oil shale is a sedimentary rock that contains a significant proportion of solid organic material embedded in a matrix of fine inorganic minerals. To recover the oil from the shale, its organic portion—termed kerogen—must be thermally decomposed. This thermal decomposition, known as retorting, converts the shale’s lid organic material into liquid and gaseous fractions, leaving a so-lid carbonaceous residue called semicoke. Semicoke is the primary by-product formed in a retort furnace. It is a source of severe envi-ronmental pollution and classified as a dangerous waste, because it contains several toxic compounds, such as water-soluble phenols, sulfide sulfur, and polynuclear aromatic hydrocarbons (PAH)
[1,2]. Its placement into open dumps presents a potential threat of groundwater pollution by polycyclic aromatic hydrocarbons, heavy metals, and phenols via leaching from the semicoke storage due to rain and snow[3,4]. In Estonia, for example, solid semicoke is mostly disposed of in open dumps. Approximately 300 million tons of solid semicoke waste is currently present in such dumps
[3,5].
At this time, one of the main problems of the oil shale industry is to find an effective treatment for semicoke. Combustion with heat recovery is one of the solutions, but it is the source of a large
quantity of CO2 emissions resulting from decarbonation of the
mineral matrix.
Smoldering in porous media consists of propagating a combus-tion front, fed with some oxygen, through a packed bed of granular solids. It is a complex process, due to the large number of thermo-chemical and physical subprocesses involved[6]. There are numer-ous examples of this phenomenon—also known as filtration combustion—both in the natural world and in industry. It has been studied extensively in the literature. Among the many published papers, one may refer to the pioneering works of Aldushin and Seplyarsky[7], which studied the propagation of one-dimensional combustion waves in a porous medium. The work of Ohlemiller[6], Schult et al.[8], and Oliviera and Kaviani[9]are important refer-ences for the physical processes involved and their modeling.
There are two basic configurations for fixed-bed combustion, depending on the directions of the air and fuel flows: co current (or forward) combustion, and countercurrent (or backward) com-bustion[10]. Co current combustion is the most energy-efficient mode of propagation since, in this configuration, the oxidizer flows through the chemical front and the transported energy is used to preheat the fuel and porous matrix ahead of the chemical front
[6–11].
Schult et al.[8]studied smoldering propagation in the context of forced forward combustion. Two different traveling waves were identified: reaction-leading and reaction-trailing waves. Both front structures have two layers propagating with constant, though not ⇑Corresponding author. Fax: +33 5 63 49 32 42.
necessarily equal, velocity. These are the fixed carbon combustion layer and the heat transfer layer. They are separated by a region of constant high temperature called later a plateau. The reaction lead-ing structure prevails when the combustion layer—or chemical front—travels faster than the heat transfer layer or thermal front. The present work deals with this most commonly encountered structure.
The particular case of oil shale smoldering has recently been studied by Martins et al.[12,13]. Oil shale conversion can be di-vided into five major phases:
! Water evaporation.
! Release of volatile mater—or devolatilization—which includes light (incondensable) gases and (condensable) heavy oil. The solid that is left after this phase is called fixed carbon (FC). ! Simultaneous direct oxidation of part of the organic matter,
called low-temperature oxidation (LTO).
! Ignition and burning of the fixed carbon, which is also called high-temperature oxidation (HTO). This reaction is essential in the process, as it supplies the thermal energy required to prop-agate the front. When the front temperature is high enough (>800!C), this reaction controls the fixed carbon oxidation layer velocity. In fact, the carbon oxidation and oxygen utilization are now complete, so the reaction stoichiometry determines the progress of the chemical front.
! Decomposition of carbonate minerals entering the oil shale composition. These minerals are CaCO3 and MgCO3 and will
be referred to as CaCO3in this work.
It was also shown that CO2from decomposition of carbonates
represents 70% of the total CO2emissions, the rest resulting from
fixed carbon oxidation. Therefore, there is strong environmental interest in avoiding medium decarbonation at the passage of the smoldering front.
1.1. Factors influencing the plateau temperature—energy balance approach
Generally speaking, the plateau temperature is known to be dependent on the amount of fixed carbon in the porous medium and on the fraction of oxygen in the fed gas. It does not depend on the fed air-flow rate when enough oxygen is provided for self-sustained propagation.
The plateau temperature can be calculated from an energy bal-ance on the two layers (chemical front and thermal front). In the case of a medium that does not contain carbonates, and assuming that all the FC is oxidized to CO2, the plateau temperature can be
calculated simply, as described in Elayeb[14], who established that
Tp¼ð1 $
e
ÞðxFC fu$ xFC resÞD
HFC b Cjd $ 1j ; ð1Þ where b C ¼e
Cgþ ð1 $e
ÞCS: ð2ÞThis expression shows the dependence of the plateau tempera-ture Tpon d. The case d = 1 would lead to a plateau temperature
tending to infinity. The plateau temperature decreases rapidly when d moves away from one.
In the case of oil shale or semicoke, FC is actually first oxidized into CO, but CO2is also observed in the produced gas. No flaming
occurs in the smoldering process, although recent papers[14]have shown theoretically that, under certain circumstances, some pore-scale local processes occur that involve CO-to-CO2oxidation in the
bulk gas phase. Whether this should be termed ‘‘flaming’’ is debat-able. Since our experiments cannot provide any information on this
discussion (given the scale involved), we have left this question open at this point. On the other hand, some decarbonation of the mineral matrix does occur. These two phenomena affect the pla-teau temperature and make it more complex to calculate. Indeed, the oxidation of C into CO consumes 2 mol of C for 1 mol of O2. This
leads to a rapidly advancing chemical front and, in addition, means that the reaction is less exothermic than the oxidation of carbon to CO2. For these two reasons, the oxidation of C into CO leads to
low-temperature fronts. Conversely, the direct oxidation to CO2leads to
slow chemical fronts and high exothermicity, resulting in a high-temperature front.
A thermal balance for these mechanisms is proposed in this work. It makes it possible to estimate the plateau temperature. De-tails of the calculation are given inAppendix A. The plateau tem-perature is expressed by Eq.(A.14), which we recall here:
Tp¼
_
mCaCO3
D
HCaCO3þ _mFCD
HFC_
mresCpres$ _mgCpg þ Tamb
: ð3Þ
Let us examine the implications of this theory.
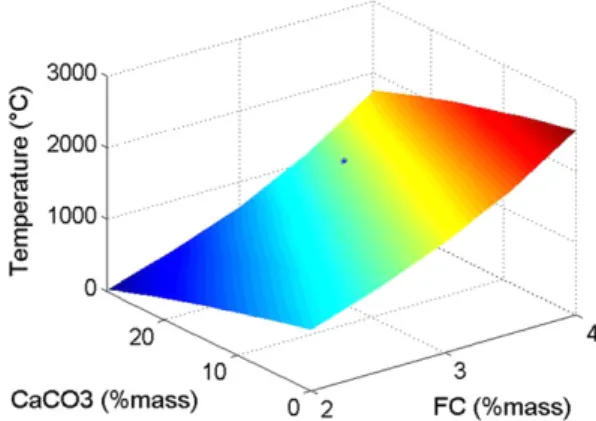
First, we consider the impact of FC and CaCO3concentrations.
Figure 1 plots the plateau temperature calculated from this ap-proach as a function of the concentrations of FC and CaCO3. It is
as-sumed here that all the FC is oxidized and all the CaCO3 is
decarbonated. It must be noted that the cases with low FC amounts and high CaCO3content lead to unrealistic front temperatures. We
see from these results that the amount of FC has a tremendous im-pact on the plateau temperature. A change of 1% in FC concentra-tion leads to a change of approximately 600!C in the plateau temperature. When the amount of decarbonated CaCO3 is
in-creased from 0% to 30%, the plateau temperature is significantly af-fected: it decreases by 900!C. This shows that the impact of the CaCO3content on the plateau temperature is highly significant.
As indicated, there is also a strong potential impact of the frac-tion of FC oxidized to CO—called frCO. We have plotted the plateau temperature versus this parameter inFig. 2. The results show that this parameter may theoretically affect the plateau temperature by more than 2000!C. In practice, as will be shown later in this paper, frCO is observed to vary between 0.19 and 0.35. The figure indi-cates that this leads to a plateau temperature change of more than 300!C. It is clear that this parameter—which, in practice, is not a controlled parameter but an observed parameter resulting from a complex chemistry that is difficult to model—has a very strong influence on the plateau temperature.
To conclude, based on a thermal balance development, we have shown that not only the fixed carbon content but also the CaCO3
content and frCO parameter greatly influence the plateau temperature.
Fig. 1. Impact of FC and CaCO3amounts on the plateau temperature as calculated
from an energy balance on the two layers (case with frCO = 0.3).'corresponds to
1.2. Literature about oil shale (OS) and semicoke (SC) combustion and the impact of medium composition
It has been recognized in the literature that both the fuel prop-erties and the process conditions affect the combustion mecha-nisms, altering the heat generation, heat transfer, and reaction rates in a complicated manner[15]. Only a handful of experimental works on co current combustion have been carried out until now (more recently Pironi et al.[16], Vantelon et al.[17], Zhou et al.
[18], Fang et al.,[19], Changkook et al.[20]).
The combustion of oil shale semicoke has recently attracted the interest of many researchers. Miao et al. [21], Jiang et al.[22]— using thermogravimetric analysis—studied the ignition mecha-nism of semicoke and the effect of pyrolysis temperature and heat-ing rate on its combustion. The behavior of sulfur compounds during the thermo-oxidation of semicoke oil shales and their dif-ferent mass ratio mixtures was studied by Kaljuvee et al. [23]. Wang et al.[24] investigated the interactions between oil shale and its semicokes during cocombustion processes and thoroughly evaluated the behavior of cocombustion. Arro et al.[25]compared different combustion technologies and proposed that semicoke and oil shales should be burnt together in a circulated fluidized-bed boiler (CFBB).
Vantelon et al.[17]made an experimental study of the forward combustion of tire pieces mixed with refractory briquettes. They showed that, for a tire mass fraction lower than 50%, the chemical front was unstable and the results were difficult to reproduce. In the same context, Pironi et al.[16]studied the influence of fuel sat-uration—in a mixed bed of coal tar and sand—on the average smol-dering velocity and peak temperatures. Results from tests at various fuel saturation levels demonstrate that ignition and self-propagation can be achieved at saturation levels as low as 10%, and they also show a nonlinear dependence of the peak tempera-ture on saturation. These results also indicate that, as saturation in-creases, the smoldering velocity decreases in a roughly linear fashion, which confirms that, for this saturation range (and air flux), the reaction is oxygen-limited. To summarize this review, no specific work was found in the literature about the influence of the OS or SC composition on the smoldering front temperature. Neither was any work found on the determination of the level of decarbonation in a porous medium after the propagation of a smol-dering front.
Based on this literature survey, and the theoretical material de-scribed inAppendix A, the objectives of this work are to study the effect on the temperature of a smoldering front of two parameters involved in the composition of the porous medium bed:
(i) the carbonate-minerals fraction and (ii) the fixed carbon fraction.
In particular, we want to answer the question: can we propa-gate a smoldering front without decarbonation of the CaCO3
min-eral? Indeed, if this were possible, one could consider the alternative of mixing OS or SC with carbonates or sand prior to pro-cessing them, in order to decrease the combustion temperature and thus avoid decarbonation.
It is also expected that this work will allow us to determine experimental values for the frCO parameter, which was shown to play an important role in the process.
Semicoke particles were chosen to prepare the porous medium for our experiments. The reason for this choice is given in the next section. The semicoke for this work was prepared by retorting Timahdit Oil shale, a deposit found in the Atlas Mountains of Mor-occo. The combustion experiments were carried out by mixing semicoke, sand, and carbonate minerals. This enabled us to vary the FC and carbonate mineral amounts independently.
In the present work, SC was chosen for all the experimental work because it presents a number of advantages as compared to OS:
(i) Performing experiments with SC instead of OS facilitates the interpretation of the results, because the LTO reactions and the devolatilization reaction no longer occur when SC is used. These reactions are avoided in semicoke media because the only organic matter is fixed carbon, which only undergoes HTO. As detailed further in the paper, a mass bal-ance based on flue-gas analysis is necessary for the determi-nation of the fraction of CaCO3that is decarbonated and of
the fraction of FC that is oxidized to CO, denoted frCO. If the medium only contains FC and CaCO3, then only N2, O2,
CO, and CO2are present in the flue gas, which is free from
volatile matter. In contrast, when oil shales are used, non-condensable gas and oil are produced. Oil is probably con-densed downstream of the chemical front. It can form a bank that induces fluctuations in the bed pressure drop and fed air-flow rate at the front, thus requiring a more com-plex analysis.
(ii) When OS is used, it has been shown[12]that part of the fed O2is consumed by LTO reactions, i.e., direct reaction of O2
with the OS organic fraction. This make it more complicated to establish the mass balance. Because of this reaction, which is complex to describe, Martins et al.[12]did not suc-ceed in balancing O2species for their experiments with OS.
The DSC analysis performed by Martins et al.[12]indicated that the devolatilization reaction has such a small reaction enthalpy that it cannot be determined. It is admitted that this reaction has no thermal impact on the chemical front propagation. Neverthe-less, the LTO reactions have a high reaction heat and consume some oxygen. Therefore, these reactions can introduce a difference between oil shale and semicoke smoldering.
2. Experimental devices and procedure 2.1. Semicoke preparation and characterization
The OS used in the work originates from the deposit of Timahdit in Morocco. It is from the same batch as the one used in[12,13]. The oil shale was received as hard dark gray blocks, typically 10– 20 cm long, and 10–20 cm wide, and several cm thick. They were crushed using a rock-grinding device in order to reduce their size. A particle size range of 500–2000
l
m was selected, and large particles were ground and sieved again. This particle size rangeFig. 2. Impact of the fraction of fixed carbon oxidized to CO on the plateau temperature (case with FC = 3.48% and CaCO3= 22.4%). ' corresponds to the
was retained for all characterizations and experiments reported here.
2.1.1. Retorting furnace
The retorting furnace used to prepare semicoke from the oil shale was a batch fixed-bed. It consisted of a stainless steel reactor externally heated by an electric rig furnace. The pyrolysis heating rate and final temperature were controlled. A quantity of 2140 g of crushed oil shale sample was placed in four drawers with 2 cm-thick layers to facilitate heat transfer inside each layer. The reactor was continuously swept by 2 L min$1at STP of N
2, which
was enough to avoid air leakage inside the furnace and to flush the VM out of the furnace to the condensation unit. It was heated to 550!C at a constant rate of 5 !C min$1, maintained at this
tem-perature for 1 h, and then cooled by turning the furnace off. The chosen temperature of 550!C is high enough to induce degrada-tion of organic matter to FC, and low enough to avoid decarbon-ation of the mineral matrix. The heating rate was imposed by the furnace and the sample mass to be heated. The duration of 1 h was found necessary to achieve a high degradation level of organic matter. The gases and vapor leaving the retort were cooled at 4!C to condense oil and water using a heat exchanger placed at the exit of the retorting furnace. An activated carbon filter was placed at the exit of the exchanger to remove odor.
2.1.2. Horizontal tube furnace (HTF)
An HTF was used to characterize the initial oil shale, the pre-pared semicoke, and the solid residue after combustion. This reac-tor has been described in detail in[13]. It consists of a 70-mm i.d. horizontal quartz tube heated electrically and swept by atmo-spheric air, which is preheated before reaching the middle of the tube. A 2-mm-thick layer of sample was placed in a quartz spoon at the end of a quartz handle and in the cold zone of the reactor, outside the electrical furnace. The atmosphere was then set to N2
or to air, depending on the test (pyrolysis or oxidation), with a con-tinuous flow rate of 2 L min$1at STP. The spoon was then pushed
up to the middle of the furnace, where the temperature was controlled.
The amount of volatile matter was determined by measuring the solid decomposition at 550!C after 7 min under inert atmo-sphere. To determine the amount of FC, the test was performed at 550!C for 20 min under air, subtracting the amount of volatile matter. At 900!C under oxidizing atmosphere for 10 min, the ob-tained mass loss corresponded to the release of volatile matter, of fixed carbon, and of CO2 produced by decarbonation. The
amount of CO2produced by decarbonation was determined by
dif-ference. Carbonates can be assumed to be essentially limestone. By considering the decomposition of limestone (CaCO3) into
quick-lime (CaO) and carbon dioxide, according to reaction(4), one can determine the amount of CaCO3.
CaCO3ðsÞ ! CaOðsÞ þ CO2ðgÞ: ð4Þ
2.1.3. Properties of the initial OS and of semicoke
The properties of the initial oil shale were determined by Mar-tins et al.[12]. They are shown inTable 1, along with the properties of semicoke determined in this work. With regard to SC, the amount of volatile matter was 0.7%, which is much smaller than
the content in the oil shale: 14.6%. The amount of FC in the semi-coke was 7.0% and the amount of CaCO3was determined at 44.8%.
The added CaCO3 was supplied by the Provençale Company,
with guaranteed purity of 99.1%. A particle size range of 500– 2000
l
m was selected. The added sand was silica particles (SiO2> 90%) provided by Italcementi group and selected in thesame particle size range by sieving. Heating the sand to 1000!C only induced a mass loss of 0.26%. Thermogravimetric analysis was performed on the SC. The results are plotted inFig. 3. It can be seen that the thermal decomposition of carbonates in semicoke occurs in the temperature range 550–780!C. It has been verified from a thermogravimetric analysis that the added carbonates used in this work were decarbonated in the same temperature range. 2.2. Fixed-bed combustion cell and parameter identification 2.2.1. Fixed-bed combustion cell
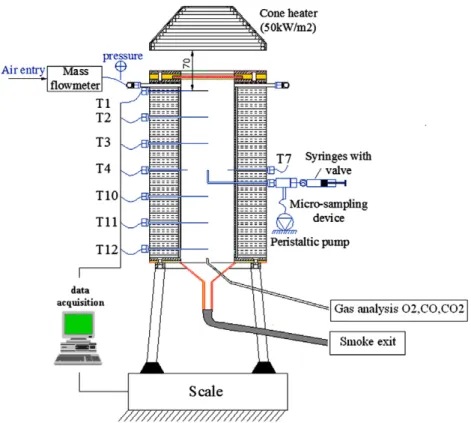
Figure 4shows the schematic diagram of the fixed-bed reactor used for the combustion tests. A detailed description of this reactor was given in[13]. Air is fed into the top of a vertical cylinder of crushed oil shale. Ignition also takes place at the top of the sample, using a cone heater that irradiates the surface through a quartz window.
During the experiments, temperatures in the bed were mea-sured by six type-K thermocouples located along the axis of the cell at different heights (T1, T2, T3, T10, T11, and T12). A crown of six thermocouples (T4–T9) makes it possible to measure the tempera-ture 1 cm away from the cell walls over a horizontal cross section: This is particularly useful to reveal whether the smoldering front progresses as a horizontal surface or not.
A new gas sampling device was added at the axis of the cell, near the bottom, in order to analyze gases. It was observed exper-imentally in[13]that the temperature close to the cell walls is sig-nificantly lower than that at the axis. Therefore, the medium will be less decarbonated close to the walls. The fraction of C oxidized to CO may also be affected. As a consequence, the mass and energy balances at a given time should not be established over all the cell section but rather at the axis. This requires gas sampling at the cell axis. This approach represents a significant improvement in exper-imental procedure since the work of Martins et al.[13]. Gas analyz-ers were connected to the sampling device to analyze CO and CO2
every 4 min by gas chromatography and O2using a paramagnetic
analyser in a continuous mode.
Table 1
Proximate analysis of oil shale and semicoke. Component Proximate analysis (wt.%)
H2O VM FC CaCO3 Inert Oil shale 2.5 14.7 4.70 34.6 43.5 Semicoke – 0.70 6.95 44.83 47.52 -30 -25 -20 -15 -10 -5 0 5 0 500 1000 Temperature (°C) Mass (g) -1,2 -1 -0,8 -0,6 -0,4 -0,2 0 0,2 DTG (%)/min Decarbonation Fixed carbon oxidation
Fig. 3. TGA (light line) and DTG curves (solid line) of semicoke under air—heating at 3 K min$1.
To start a uniform front across the whole bed surface, a sophis-ticated ignition device was used, called a cone radiant heater. Since the work described in [13], the ignition protocol has been im-proved. An optimized air-flow rate was found to be around 12.4 L min$1 at STP. A 1-cm layer of pure semicoke was put at
the top of the bed. The time of ignition was fixed at 300 s instead of 220 s in[13], with the same radiative heat flux of 50 kW m$2.
These changes led to more rapid chemical front ignition and stabilization.
2.2.2. Parameter identification
The fraction of FC oxidized to CO, frCO, the fraction of decarbon-ated carbonates, frdecarb, and the chemical front velocity,
v
frc, weredetermined based on a mass balance for the system as detailed in
[12]. This balance was established at a time corresponding to a sta-bilized combustion process, i.e., in the bottom half of the cell.
! The value of frCO was adjusted by matching the balance-pre-dicted CO concentration in the flue gas to the experimental value.
! The value of frdecarbwas similarly adjusted by matching the
bal-ance-predicted CO2concentration in the flue gas to the
experi-mental value.
! The chemical front velocity was also adjusted to match the bal-ance-predicted total loss rate to the experimental mass-loss rate. This was required because the derivative of the chem-ical front position versus time, as given by the thermocouples, was found to be insufficiently accurate for use in a mass balance approach.
Fig. 4. Cell combustion in a porous medium, with continuous gas sampling at the axis.
Table 2
Experimental conditions and main experimental results for all experiments.
Experiment no. References Variation of CaCO3 Variation of fixed carbon
1 2 3 4 5 6 7 8 9 10 11 12 13 14 15 Experimental conditions Mix (% mass) SC 50 50 39 30 25 Sand 50 40 30 0 56 61 64 CaCO3 0 50 10 20 50 5 9 11 Bed density (kg/m3) 1181 1170 1181 1132 1222 1165 1187 1193 1215 1214 1269 1275 1309 1261 1286 Bed composition
(% mass) VMFixed carbon 0.353.475 0.353.475 0.2732.71 0.212.085 0.1751.73
Carbonates 22.41 32.41 42.41 72.41 22.41 22.41 22.41 Inert 73.76 63.76 53.76 23.76 74.60 75.29 75.68 Results Front characteristics Temperature (!C) 1037 1004 1056 821 823 813 836 800 860 685 737 727 562 613 591 Velocity (mm/min) 4.02 4.03 4.07 4.26 3.77 3.96 5.24 – – 4.84 – – 3.6 – – Progress of reactions FC oxidation (%) 96.2 96.2 96.2 96.3 96.1 96.4 95 – – 93.5 – – 91.6 – – frCO 0.32 0.29 0.34 0.28 0.27 0.24 0.19 – – 0.21 – – 0.21 – – CaCO3decarbonation (%) 106.5 93.7 95.2 88 69 37 58.1 – – 20.4 – – 7.93 – – Vol. fraction (%) in flue gas O2 0.0 0.0 0.0 0.0 0.0 0.0 0.0 – – 4.72 – – 10.4 – – CO 5.38 4.94 5.95 4.98 4.20 3.97 4.01 – – 2.85 – – 2.14 – – CO2 25.9 25.6 24.5 31.22 29.0 29.2 28.8 – – 14.4 – – 9.02 – –
Nevertheless, the three parameter identifications were coupled, since each gas species that is produced contributes to the dilution of the other species in the flue gas and changes their concentration. Moreover, CO2is a product of decarbonation but also of carbon
oxi-dation. Matching was therefore carried out simultaneously using a Neadler and Mead-type optimization procedure. An objective func-tion to be minimized was calculated as the sum of the squared dif-ferences between calculation and experiments for gas species concentration and total cell mass loss rate. It was confirmed that only one set for the three identified parameters could minimize the objective function. The values found are all reported inTable 2.
3. Results and discussion
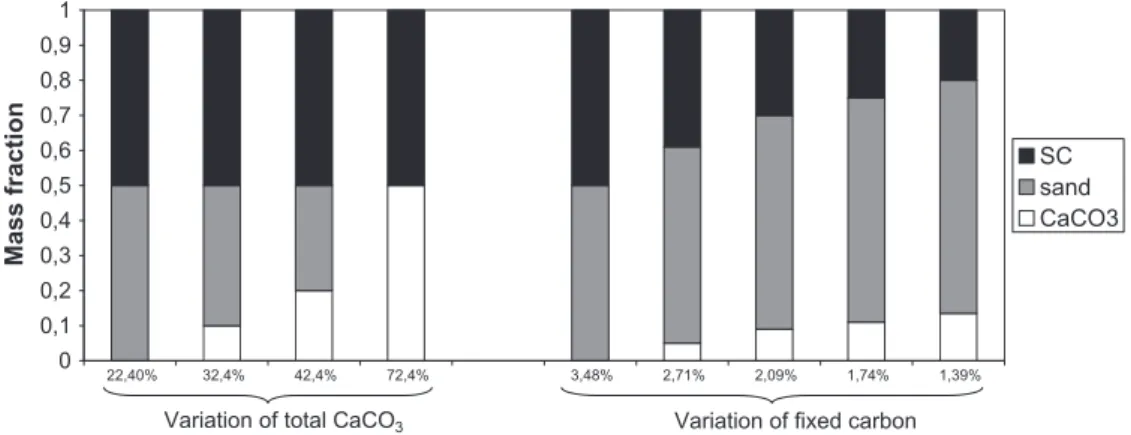
The experimental work was carried out as follows: a reference case was first produced using a mix of 50 mass%/50 mass% of SC and sand. This led to a composition of 3.48% FC and 22.4% total CaCO3. It must be noted that total CaCO3in the mix comes from
both the SC and the added CaCO3. The mass fraction of total CaCO3
was then varied from 22.4% to 72.4%, keeping the FC at 3.48%. This was achieved by adding CaCO3 and removing sand. Finally, the
fraction of FC was varied from 3.48% down to 1.39% while keeping the total CaCO3content at 22.4%. The composition of all mixes is
illustrated inFig. 5, representing the mass fractions of SC, of sand and of carbonates introduced in the mixes. All experimental condi-tions and the main experimental results are reported inTable 2.
3.1. Reference case
A mix of semicoke and sand at a mass composition of 50%/50% was used as the reference case. The semicoke had to be mixed with sand to lower the peak temperature, which would otherwise increase beyond 1300!C with pure SC and would lead to the for-mation of large aggregates in the combustion cell. All experiments in this work were carried out with an air-flow rate of 8.3 L min$1at
STP, which is equivalent to a Darcy velocity of 0.023 m s$1at 20!C.
This velocity is the same as for the oil shale experiments carried out in[13].
Once the bed is ignited by the cone radiant heater, the smolder-ing front propagates continuously into the bed.Figure 6shows the temperature evolution at several locations inside the bed. A per-manent front regime was reached after the cell midheight. This was attested by the similar shape of the peaks in this part of the cell. The peak temperatures were observed to be near 1050!C. The average value of the three bottom thermocouples is taken in the sequel of the paper as the experimental peak temperature. As shown in[13], the fact that the thermocouple temperature
de-creases rapidly after the peak value is reached is due to heat losses that occur in the cell.
On the horizontal cross section at midheight of the bed (T4–T9), one can see that the peak temperature has fallen to about 900!C: the difference between the temperature near the wall and of the axis of the bed is about 150!C. As mentioned in the previous par-agraph, this reveals significant heat losses through the walls[13]. The time evolution of the bed mass and bed pressure drop was measured in the bed throughout the experiment and is shown in
Fig. 7. The mass loss is caused by both oxidation of the FC and decarbonation of the carbonate mineral. It can be observed that the mass-loss rate (slope of the curve) increases in the first half of the experiment, and tends to a constant value in the second half. The chemical front velocity can be calculated from the experi-mental data by looking at the chemical front passage at each ther-mocouple on the cell axis. A quadratic polynomial function giving the position of the chemical front versus time was used at the experimental points. The time derivative of this function gives an estimate of the chemical front velocity. This value was not used in this paper, as it may change during the combustion process. As explained in Section2.2, we preferred to use the chemical front velocity determined from the parameter identification using the mass balance.
Finally, the reference-case experimental conditions were used to evaluate the repeatability of the experiment. It was reproduced three times. The three results are reported in related figures and
0 0,1 0,2 0,3 0,4 0,5 0,6 0,7 0,8 0,9 1 1,39% 1,74% 2,09% 2,71% 3,48% 72,4% 42,4% 32,4% 22,40% Mass fraction SC sand CaCO3
Variation of total CaCO3 Variation of fixed carbon
Fig. 5. SC, sand, and CaCO3mass fractions in the different mixes used in this work. The mass fractions of FC and total CaCO3are indicated.
Fig. 6. Typical time evolution of temperature at several locations at the cell axis (T1, T2, T3, T10, T11, T12) and at the horizontal crown at midheight (T4–T9).
will give an estimate of the error in directly measured and identi-fied parameters.
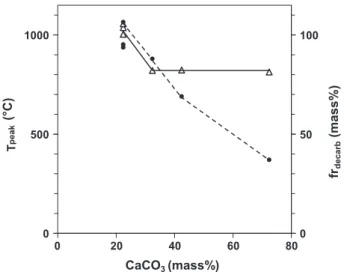
3.2. Influence of the carbonate fraction on the peak temperature In this part, the amount of total CaCO3was varied
indepen-dently while the FC amount was kept at 3.48%. InFig. 8, the peak temperature is shown as a function of the total CaCO3content. It
can be seen that increasing the CaCO3 fraction in the bed from
22.4% to 32.4% reduced the front temperature from 1050 to 800!C. Beyond that, the temperature remained stable at 800 !C while the amount of CaCO3was increased. Observation of the TG
curve of the SC suggests some elements of interpretation. First, the curve shows that the thermal decomposition of carbonates oc-curs in the temperature range 550–780!C. The decarbonation endothermic peak appears around 760!C and stops at a character-istic temperature around 800!C. Therefore, when the temperature is higher than 800!C, CaCO3 is decarbonated rapidly. When the
temperature is 800!C or lower, CaCO3is not decarbonated
signifi-cantly and no longer plays the role of heat sink but, instead, be-haves as an inert medium. Clearly, the peak temperature can be decreased by adding a reactive endothermic medium, but not to temperatures lower than a characteristic temperature. This sug-gests that, by using a mineral with a lower characteristic
temper-ature, such as kaolin or gypsum, the peak temperature could be further reduced. This interesting idea will be tested in future work. The fraction of the initially present 22.4% of CaCO3 that was
decarbonated is plotted inFig. 8. For the reference case, all the car-bonates were decarbonated. When the amount of CaCO3was
in-creased, the decarbonation fraction dein-creased, down to 37% for the experiment with 72.4% carbonates. For these experiments, it is interesting to calculate the absolute quantity of CaCO3that is
decarbonated as the product of xCaCO3( frdecarb. The values obtained
for the three experiments with 32.4, 42.4, and 72.4% initial CaCO3
were nearly the same, i.e., 28 ± 1% mass. It can be concluded that the chemical front can decarbonate up to 28% CaCO3. In the
refer-ence case, as only 22.4% was present, all of it was decarbonated, while in the other cases where CaCO3was present in quantities
lar-ger than 28% mass, only this latter quantity was converted. The remaining carbonates behaved as inert materials.
It was also observed that the chemical front velocity did not change when CaCO3was increased, as compared to the reference
case. This can be explained quite simply: at such high tempera-tures, the chemical front velocity is governed by the fixed carbon oxidation reaction. Indeed, almost all the FC was oxidized, as indi-cated by the analysis of the solid residue after combustion: only 0.25% of FC was found in the residue of all experiments. This en-ables us to calculate the fraction of FC that is oxidized following
froxi¼½
q
( xFC*fu$ ½q
( xFC*res½
q
( xFC*fu: ð5Þ
The values of froxiare reported inTable 2. They are higher than
92%.
Moreover, all the fed O2was used, as attested by the analysis of
the flue gas, which was measured to contain less than 0.1 mol% O2.
This resulted in a constant chemical front velocity.
3.3. Influence of the fixed carbon content on the peak temperature
Figure 9presents the effect on the front temperature of chang-ing the bed fixed carbon content while the amount of CaCO3
re-mained at 22.4%. These experiments were repeated three times; flue gas was analyzed only once, as reported inTable 2. The tem-perature of the front decreased almost linearly from 1000!C down to 562!C with the reduction in fixed carbon from 3.48% mass down to 1.73%. The zone of extinction was reached during the experi-ment at 1.39% of fixed carbon. Ignition was good and the chemical front started to propagate through the cell. Nevertheless, the O2
fraction in the flue gas increased regularly to 20.9% and the mass loss decreased until the chemical front extinguished. This occurred at a temperature of 275!C. This experiment was repeated and led systematically to extinction after erratic propagation. It is likely that, at a low fixed carbon fraction, the heat required for heating the medium and the heat lost from the chemical front by conduc-tion are greater than the heat generated by carbon oxidaconduc-tion. Hence, the front temperature decreased and the chemical front propagation stopped. This experiment was used to draw an extinc-tion zone inFig. 9.
The oxygen fraction in the flue gas was analyzed and also re-ported inFig. 9. It can be observed that the oxygen was totally con-sumed for the experiments with 3.48% mass and 2.71% FC, for which the front temperature was higher than 800!C. This is the classic situation where the chemical front progress is controlled by oxygen supply[6]. Nevertheless, for experiments at 2.09% and 1.74% FC, the oxygen was only partially consumed by the fixed car-bon. For the experiment at 1.74% FC, for which the peak tempera-ture was 600!C, only half of the supplied O2 was consumed.
Several phenomena can explain this:
Fig. 7. Typical time evolution of the bed pressure drop (—) and of the mass loss of the bed (- -). 0 500 1000 0 20 40 60 80 CaCO3 (mass%) T pe ak (°C) 0 50 100 frde ca rb (m as s% )
Fig. 8. Peak temperature (—) and fraction of CaCO3decarbonated (- -) for the
(i) As the temperature decreased, the carbon oxidation kinetics slowed down. Referring to the TG curves under air in[12], one can see that the char oxidation terminated at a temper-ature of 550!C. In the TG tests with a heating rate of 3 K min$1, this temperature was reached after 3 h.
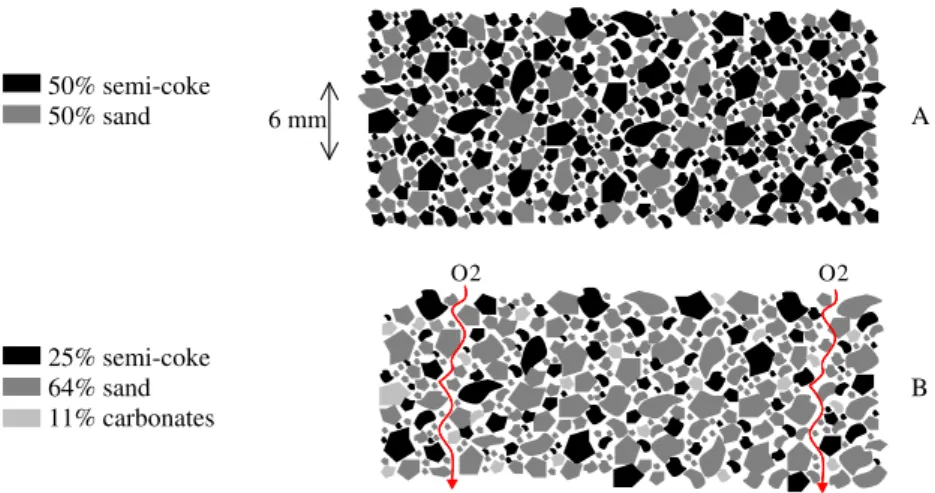
Conse-quently, it is likely that this reaction was slow at the passage of the chemical front and not all the oxygen was consumed. (ii) A representation of the SC/sand/CaCO3particles in the
med-ium may give another clue to interpretation. Figure 10
describes schematically a cross section of the porous med-ium that respects the particle-size ratio of 4 between the lar-ger and the smaller particles and the proportions of the three components in the mix, here distinguished using different gray levels. Part A of the figure represents the reference case. It can be seen that the reactive particles, i.e., SC particles, are quite close to each other. In the case of the experiment with 1.74% FC, which is represented in part B of the figure, reac-tive particles are much more dispersed. One can imagine that bypasses may exist, as large as the chemical front thick-ness, through which O2can advect without the opportunity
to diffuse to the surface of a reactive particle. This thickness has been estimated to be several grain sizes in[13]and is illustrated by the 6 mm scale in the figure. This effect is likely to play a role in the partial consumption of O2.
A consequence of the fact that not all O2was consumed by the
chemical front should be that its velocity would decrease. Indeed, in the case where all O2 was consumed and all FC oxidized, the
chemical front velocity was inversely proportional to the carbon content. It was first checked that all the initially present FC was oxidized by analyzing the solid residue: only 0.25% FC was found, even for experiments where the front temperature was low and not all oxygen consumed. Ohlemiller[6]reported that low temper-atures generally reflect the fact that smoldering causes incomplete oxidation of the carbon in the fuel. This is not the case in this work. The equation of the line inFig. 11is
v
frc= k/xFC, with k = 13.9 mmmin$1%. It corresponds to the case where all FC is oxidized and
all oxygen consumed, since in this situation the product
v
frc( xFCthat expresses the mass flow rate of oxidized carbon is propor-tional to the fed oxygen flow rate, which was constant for all experiments. The constant k was adjusted to fit the experimental points with the higher FC content, for which all O2was actually
consumed. It can be noted that the curve also fits the experiment at 2.71% FC. For the experiment at 2.09% FC and even more for the one at 1.74% FC, the measured chemical front velocities are much lower than the theoretical ones, as represented by the line. This suggests that the nonconsumption of O2by the chemical front
is responsible for front slowdown. It can be observed that the slow-down is proportional to the nonconsumed O2.
0 200 400 600 800 1000 1200 1 2 3 4 FC (mass%) Tpeak (° C ) 0 5 10 15 20 25 30 Re si du al O2 (m ol . % ) Ex tinc tion
Fig. 9. Peak temperature (—) and oxygen fraction in the flue gas (- -) for the experiments with different carbon content.
50% semi-coke
50% sand
A
25% semi-coke
64% sand
B
11% carbonates
6 mm O2 O2Fig. 10. A representation of the porous medium respecting the smaller/larger particle-size ratio and the proportions of SC, sand, and CaCO3, in (A): the reference experiment
and (B): the experiment at 1.74% FC.
0 5 10 1,5 2 2,5 3 3,5 4 FC (mass%) Vfrc (m m /m in )
Fig. 11. Experimental values of the chemical front velocity for experiment with different FC content (d) and theoretical evolution if all O2were consumed (- -).
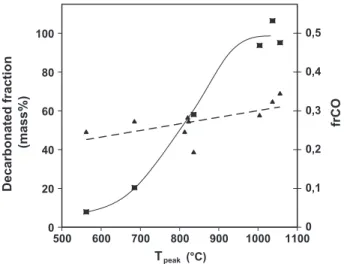
If one plots the decarbonated fraction of the 22.4% carbonate minerals initially present versus the peak temperature, as illus-trated inFig. 12, one can observe that this fraction progressively in-creases with the peak temperature. At 562!C, only 8% of the carbonates are decarbonated. This value is one of the main conclu-sions of the present work: after the SC is diluted so that the amount of FC is 1.73%, the front temperature falls to 562!C, and only 8% of the CaCO3is decarbonated. It is therefore possible to avoid most of
the decarbonation of the medium. Nevertheless, these conditions result in the use of only half of the fed oxygen. The case of the front at 685!C obtained with a FC amount of 2.09% may also be interest-ing for practical applications: 81% of the oxygen is used by the chemical front, while 21.2% of the CaCO3is decarbonated.
3.4. Investigation into the fraction of fixed carbon oxidized to CO As discussed in Section1, the frCO parameter—the fraction of FC that is oxidized to CO—has a strong influence on the chemical front velocity and temperature. From all the results presented above, it is possible to plot its value as a function of the front temperature (Fig. 12). This figure represents the experimental fraction of FC oxi-dized to CO (- -) versus the peak temperature, for all the experi-ments carried out in this work. It indicates that frCO varied between 0.19 and 0.35. Despite significant dispersion, the values tend to indicate an increase of frCO with temperature. This result is in agreement with the literature about carbon oxidation: increasing temperature leads to increasing yields in CO[26–29]. We believe that the frCO parameter plays the role of temperature controller. Indeed, with experimental conditions corresponding to a high fraction of FC, which would tend to create a high temper-ature front, frCO increases and moderates the tempertemper-ature. If for some reason the front temperature tends to decrease, frCO also decreases and contributes to an increase in the temperature. Therefore, these phenomena may contribute to increasing the sta-bility of the chemical front.
The quantitative values obtained here are of practical interest. It is shown that only approximately 30% of the FC is oxidized to CO. There is thus potentially another alternative to decreasing the front temperature: increasing frCO. As shown from the theoretical study in this work, an increase in frCO by 0.1 decreases the plateau tem-perature by more than 300!C. Feeding the chemical front with a CO2-rich gas could be an alternative way of reaching this objective.
Indeed, adding CO2to the incoming gas would lead to an increase
in the CO2partial pressure in the smoldering front. This may favor
the oxidation of C to CO considering that the Boudouard reaction C + CO2? 2CO will be favored. This may also limit the CaCO3
decarbonation reaction[31,32].
This original technique, contrary to mixing with inert or reac-tive solids, may find applications for in situ combustion. It will be tested in future work.
3.5. Capacity of the simplified energy balance to predict the peak temperature
This section evaluates the capacity of the energy balance—as described in the Introduction—to predict the experimental peak temperature. To this purpose, we have plotted inFig. 13the bal-ance-predicted plateau temperature versus the experimental peak temperature. It can be seen that the energy-balance results capture the general trends of the experiments but cannot accurately pre-dict the peak temperature. This confirms the literature reporting that energy balances provide only poor agreements with actual smoldering temperatures.
4. Conclusions and perspectives
The temperature of the smoldering front is clearly influenced by the composition of fixed carbon and inert/reactive solid in the por-ous medium. The increasing of the CaCO3content caused a
reduc-tion in the front temperature from 1050!C to 800 !C, but not below. At this temperature, CaCO3 is still decarbonated, and to
the same level of 28% of the mix mass, whatever the carbonate’s initial quantity. The remaining carbonates behave as an inert material.
The temperature of the smoldering front was decreased from 1050!C to 562 !C by decreasing fixed carbon from 3.48% to 1.73%. At 1.39% of fixed carbon, the chemical front extinguishes. At 562!C, the chemical front propagates and decarbonates only 8% of the CaCO3present. Only half of the fed oxygen is consumed
by the chemical front, which slows down proportionally to the nonutilized oxygen. This is probably due to slow carbon oxidation kinetics or, maybe, to the fact that the reactive particles are so dis-persed that O2 can flow through the oxidation zone without
reacting.
Whatever the experimental conditions, even at the lower tem-peratures, only 0.25% of fixed carbon is left in the medium after the passage of the chemical front. It was found that 19% to 35% of fixed carbon was oxidized into CO. This fraction tends to in-crease with the front temperature and, consequently, may act as
0 20 40 60 80 100 500 600 700 800 900 1000 1100 Tpeak (°C) Decarbonated fraction (mass%) 0 0,1 0,2 0,3 0,4 0,5 frCO
Fig. 12. Decarbonated fraction versus peak temperature (—) and experimental fraction of FC oxidized to CO versus plateau temperature (- -).
Fig. 13. Balance-predicted plateau temperature versus the experimentally-mea-sured peak temperature.
a front temperature controller that increases the front stability. Feeding the chemical front with a CO2-rich gas—using a recovered
CO2for instance—is one perspective revealed by this study. It may
increase the fraction of FC oxidized to CO, and decrease the front temperature in in situ applications.
This study thus offers promising methods to process oil shale or semicoke without degrading part of the mineral matter, typically responsible of 70% of CO2emissions. These results present an
ini-tial approach to cold-front propagation. This approach can be gen-eralized to include other porous media, and opens perspectives on using other reactive solids such as kaolin or gypsum as tempera-ture moderators.
Acknowledgment
The authors are most grateful to Bernard Auduc for his technical support during all experiments.
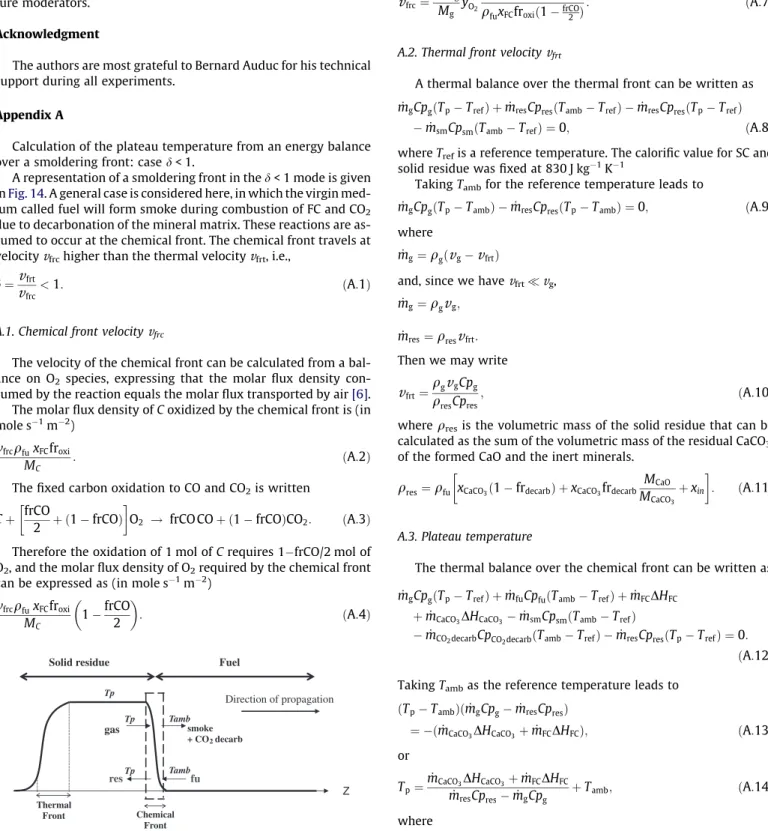
Appendix A
Calculation of the plateau temperature from an energy balance over a smoldering front: case d < 1.
A representation of a smoldering front in the d < 1 mode is given inFig. 14. A general case is considered here, in which the virgin med-ium called fuel will form smoke during combustion of FC and CO2
due to decarbonation of the mineral matrix. These reactions are as-sumed to occur at the chemical front. The chemical front travels at velocity
v
frchigher than the thermal velocityv
frt, i.e.,d ¼
v
v
frtfrc<1: ðA:1Þ
A.1. Chemical front velocity
v
frcThe velocity of the chemical front can be calculated from a bal-ance on O2 species, expressing that the molar flux density
con-sumed by the reaction equals the molar flux transported by air[6]. The molar flux density of C oxidized by the chemical front is (in mole s$1m$2)
v
frcq
fuxFCfroxiMC : ðA:2Þ
The fixed carbon oxidation to CO and CO2is written
C þ!frCO2 þ ð1 $ frCOÞ"O2 ! frCO CO þ ð1 $ frCOÞCO2: ðA:3Þ
Therefore the oxidation of 1 mol of C requires 1$frCO/2 mol of O2, and the molar flux density of O2required by the chemical front
can be expressed as (in mole s$1m$2)
v
frcq
fuxFCfroxi MC 1 $ frCO 2 # $ : ðA:4ÞThe molar flux density of air fed to the chemical front is
v
gq
gMg ; ðA:5Þ
and using the molar fraction of O2in the air yO2, the molar flux
den-sity of O2fed to the chemical front is
v
gq
gMg yO2: ðA:6Þ
From Eqs.(A.3) and (A.5), we have
v
frc¼v
Mgq
g g yO2MC
q
fuxFCfroxið1 $frCO2 Þ: ðA:7Þ
A.2. Thermal front velocity
v
frtA thermal balance over the thermal front can be written as
_
mgCpgðTp$ TrefÞ þ _mresCpresðTamb$ TrefÞ $ _mresCpresðTp$ TrefÞ
$ _msmCpsmðTamb$ TrefÞ ¼ 0; ðA:8Þ
where Trefis a reference temperature. The calorific value for SC and
solid residue was fixed at 830 J kg$1K$1
Taking Tambfor the reference temperature leads to _
mgCpgðTp$ TambÞ $ _mresCpresðTp$ TambÞ ¼ 0; ðA:9Þ
where
_
mg¼
q
gðv
g$v
frtÞand, since we have
v
frt+v
g, _mg¼
q
gv
g;_
mres¼
q
resv
frt:Then we may write
v
frt¼q
gv
gCpg
q
resCpres; ðA:10Þ
where
q
resis the volumetric mass of the solid residue that can becalculated as the sum of the volumetric mass of the residual CaCO3,
of the formed CaO and the inert minerals.
q
res¼q
fu xCaCO3ð1 $ frdecarbÞ þ xCaCO3frdecarbMCaO
MCaCO3
þ xin
! "
: ðA:11Þ
A.3. Plateau temperature
The thermal balance over the chemical front can be written as
_
mgCpgðTp$ TrefÞ þ _mfuCpfuðTamb$ TrefÞ þ _mFC
D
HFCþ _mCaCO3
D
HCaCO3$ _msmCpsmðTamb$ TrefÞ$ _mCO2decarbCpCO2decarbðTamb$ TrefÞ $ _mresCpresðTp$ TrefÞ ¼ 0:
ðA:12Þ
Taking Tambas the reference temperature leads to ðTp$ TambÞð _mgCpg$ _mresCpresÞ
¼ $ð _mCaCO3
D
HCaCO3þ _mFCD
HFCÞ; ðA:13Þ orTp¼m_CaCOm_3
D
HCaCO3þ _mFCD
HFC resCpres$ _mgCpg þ Tamb; ðA:14Þ where _ mFC¼
v
frcq
fuxFC; Chemical Front Z Fuel Tp Tamb Tp gas res Thermal Front smoke + CO2 decarb fu Solid residue Tamb Tp Direction of propagation_
mCaCO3¼
v
frcq
fuxCaCO3frdecarb;_
mg¼ ð
v
g$v
frcÞq
g;since we have
v
frc+v
g, then _mg=v
gq
gand _mres¼
v
frcq
res:This equation is of the same nature and basis as that developed by Dosanjh et al.[30].
A.4. Heats of reaction
Fixed carbon oxidation reaction may be written
C þ ð1 $ frCOÞO2 ! frCO CO þ ð1 $ frCOÞ CO2: ðA:15Þ
According to Hess’s law, we have (with our sign definition)
D
HFC¼ 110:5frCO þ 396:5ð1 $ frCOÞ kJ=mol:The decarbonation reaction may be written
CaCO3 ! 0:56 CaO þ 0:44 CO2: ðA:16Þ
According to Hess’s law, we have (with our sign definition)
D
HCaCO3¼ $635:1 $ 393:5 þ 1207 ¼ þ178:4 kJ=mol CaCO3:Appendix B Nomenclature Physical symbol Meaning Cp calorific capacity (J/kg K) fr fraction
frCO fraction of FC oxidized into CO k constant
e
porosity m mass (g)M molar mass (g/mol) _
m mass flow rate in the front frame (kg/s) T temperature (!C)
v velocity (m/s) x mass fraction y molar fraction
d ratio between thermal and chemical front velocities
DH reaction heat (J/mol ) Greek symbol
q
volumetric mass (kg/m3) Subscript Materials fu fuel g gas OS oil shale SC semicoke S solid sm smoke res solid residue ComponentsC carbon
CaCO3 calcium carbonate
FC fixed carbon in inert Reactions
decarb decarbonated dev devolatilized oxi oxidized carbon Others
frc chemical front frt thermal front p plateau
References
[1] M.V. Kök, J. Thermal. Anal. Calorim. 68 (2005) 1061.
[2] X.X. Han, X.M. Jiang, Z.G. Cui, J. Therm. Anal. Calorim. 92 (2008) 595–600. [3] A. Kahru, L. Põllumaa, Oil Shale 23 (2006) 53–93.
[4] W. Qing, S. Baizhong, W. Xiahua, B. Jingru, S. Jian, Oil Shale 23 (2006) 328–339. [5] I. Külaots Indrek, L.G. Jillian, E.M. Suuberg, Fuel 89 (2010) 3300–3306. [6] T.J. Ohlemiller, Prog. Energy Combust. Sci. 11 (1985) 277–319.
[7] A.P. Aldushin, B.S. Seplyarsky, Theory of Filtration Combustion of Porous Metallic Specimens, OIKhF, USSR Academy of Sciences, Chernogolovka, 1977. [8] D.A. Schult, B.J. Matkowsky, V.A. Volpert, A.C. Fernandez-Pello, Combust. Flame
101 (1996) 471–490.
[9] A.A.M. Oliviera, M. Kaviani, Prog. Energy Combust. Sci. 27 (2001) 623–645. [10] H. Thunman, Bo Leckner, Fuel 82 (2003) 275–283.
[11] A.G. Merzhanov, B.I. Khaikin, Prog. Energy Combust. Sci. 14 (1988) 1–98. [12] M.F. Martins, S. Salvador, J.F. Thovert, G. Debenest, Fuel 89 (2010) 144–151. [13] M.F. Martins, S. Salvador, J.F. Thovert, G. Debenest, Fuel 89 (2010) 133–143. [14] M. Elayeb, Modélisation à l’échelle microscopique de transports avec réaction
en milieu poreux: combustion en lit fixe, Ph.D. Thesis, Université de Poitiers, France, 2008.
[15] D. Shin, T. Yu, W. Yang, B. Jeon, S. Park, J. Hwang, Waste Manage. 28 (2008) 2422–2427.
[16] P. Pironi, C. Switzer, G. Rein, A. Fuentes, J.I. Gehard, J.L. Torero, Proc. Combust. Inst. 32 (2009) 1957–1964.
[17] J.P. Vantelon, B. Lodeho, S. Pignoux, J.L. Ellzey, J.L. Torero, Proc. Combust. Inst. 30 (2005) 2239–2246.
[18] H. Zhou, A.D. Jensen, P. Glarborg, P.A. Jensen, A. Kavaliauskas, Fuel 84 (2005) 389–403.
[19] H. Fang, N. Zobel, Z. Wenjian, F. Behrendt, Biomass Bioenergy 33 (2009) 1019– 1029.
[20] R. Changkook, A.N. Phan, Y.B. Yang, V.N. Sharifi, J. Swithenbank, Waste Manage. 27 (6) (2007) 802–810.
[21] Z.Y. Miao, G.G. Wu, P. Li, N. Zhao, P.C. Wang, X.L. Meng, Mining Sci. Technol. (China) 3 (2009) 380–384.
[22] X.M. Jiang, X.X. Han, Z.G. Cui, Prog. Energy Combust. Sci. 33 (2007) 552–579. [23] T. Kaljuvee, R. Kuusik, A. Trikkel, N. Maljukova, Oil Shale 20 (2003) 113–125. [24] Q. Wang, H. Wang, B. Sun, J. Bai, X. Guan, Fuel 88 (2009) 1520–1529. [25] H. Arro, A. Prikk, T. Pihu, I. Opik, Oil Shale 19 (2002) 117–125. [26] N.M. Laurendeau, Prog. Energy Combust. Sci 4 (1978) 221–270.
[27] L. Tgnotti, J.P. Longwell, A.F. Sarofim, in: Twenty-Third Symposium (International) on Combustion. The Combustion Institute, Pittsburgh, 1990, pp. 1207–1213.
[28] R.E. Mitchell, Combust. Sci. Technol. 53 (1987) 165–186. [29] T.F. Zeng, F. WB, Combust. Flame 107 (1996) 197–210.
[30] S.S. Dosanjh, P.J. Pagni, A.C. Fernandez-Pello, Combust. Flame 68 (1987) 131– 142.
[31] T.R. Ingraham, R.H. Marier, Can. J. Chem. Eng. (1963) 170–173.
[32] J. Khinast, G.F. Krammer, C. Brunner, G. Staudinger, Chem. Eng. Sci. 4 (1996) 623–634.