HAL Id: hal-01851557
https://hal.archives-ouvertes.fr/hal-01851557
Submitted on 30 Jul 2018
HAL is a multi-disciplinary open access
archive for the deposit and dissemination of
sci-entific research documents, whether they are
pub-lished or not. The documents may come from
teaching and research institutions in France or
abroad, or from public or private research centers.
L’archive ouverte pluridisciplinaire HAL, est
destinée au dépôt et à la diffusion de documents
scientifiques de niveau recherche, publiés ou non,
émanant des établissements d’enseignement et de
recherche français ou étrangers, des laboratoires
publics ou privés.
Post-Impact Investigation of CFRP Laminated Plate
Haris Ahmad Israr, Natthawat Hongkarnjanakul, Samuel Rivallant,
Christophe Bouvet
To cite this version:
Haris Ahmad Israr, Natthawat Hongkarnjanakul, Samuel Rivallant, Christophe Bouvet.
Post-Impact Investigation of CFRP Laminated Plate.
Jurnal Teknologi, 2014, 71 (2), pp.71-78.
O
pen
A
rchive
T
OULOUSE
A
rchive
O
uverte (
OATAO
)
OATAO is an open access repository that collects the work of Toulouse researchers and
makes it freely available over the web where possible.
This is an author-deposited version published in :
http://oatao.univ-toulouse.fr/
Eprints ID : 14394
To link to this article: DOI :10.10113/jt.v71.3723
URL :
http://dx.doi.org/10.11113/jt.v71.3723
To cite this version :
Israr, Haris Ahmad and Hongkarnjanakul,
Natthawat and Rivallant, Samuel and Bouvet, Christophe
Post-Impact Investigation of CFRP Laminated Plate.
(2014)
Jurnal Teknologi, 71 (2). ISSN 0127-9696
Any correspondance concerning this service should be sent to the repository
administrator:
staff-oatao@listes-diff.inp-toulouse.fr
Post-Impact
Investigation of CFRP Laminated Plate
H.A Israra,*, N. Hongkarnjanakulb,S.Rivallantc,C.BouvetcaFaculty of Mechanical Engineering, Universiti Teknologi Malaysia, 81310 UTM Johor Bahru, Johor Malaysia
bGeo-Informatics and Space Technology Development Agency, 120 The Government Complex, Chaeng Wattana Road, Lak Si, Bangkok 10210,
Thailand.
cUniversité de Toulouse : ISAE, INSA, UPS, Emac; ICA (Institut Clement Ader), 10 Avenue Edouard Belin, 31055 Toulouse Cedex 4, France.
*Corresponding author: haris@fkm.utm.my
Graphical abstract
Abstract
This paper deals with low-velocity impact and quasi-static indentation tests on carbon fibre reinforced plastic (CFRP) laminates that classically used in aeronautical applications. The aim is to carry out post-impact analysis using Vic 3-D digital image correlation to investigate the behaviour of permanent indentation which is an important condition for the damage tolerance justification in composite. Result shows the indentation depth decreased with the time due to relaxation of the specimen until at certain position. The microscopic observations were carried out to understand the phenomenon. Besides that, the post-mortem analyses on the impacted plate were also carried out through microscopic observation to determine the delamination area at each interface which is normally difficult to extract from the C-Scan result. The observations were made at three different sections cut (0°, 90° and 45°). The results of delamination area obtained from both microscopic and C-scan analysis is compared and there are rather satisfying to each other.
Keywords: CFRP; Impact; permanent indentation; delamination
1.0 INTRODUCTION
Composite materials have been used progressively to replace metallic materials, particularly in structural applications of aeronautical industries because of their interesting characteristics, like low specific weight, enhanced mechanical strength and durability. However, their behaviour under impact loading is one of the major concerns as a single impact can even produces several different damage modes simultaneously [1-2]. This is important because impacts do occur during manufactures, normal operations, maintenances, that can decrease the structure’s life even though the damages are not visible to the naked eyes. However, internal damage may already have been created including damage characteristics, such as matrix cracks, delamination and fibre ruptures.
On the other hand, impact damage tolerance deals with the effect of existing impact damage on the strength and stability of the structures [3-5]. It is essential to define a damage tolerance demonstration as soon as a new project begins. Damage tolerance is proposed to ensure the accidental damage occurring within the operational life of the aircraft, the remaining structure can withstand reasonable loads without failure or excessive structural deformation until the damage is detected. The accidental damage is characterised by its visual detect ability and compared to barely
visible impact damage (BVID) which is a very important concept in relation to the damage tolerance. According to the JAR25.571 which was introduced in year 1978 for aircraft structures, the effect of damage on the strength of the structure must be analysed and controlled through the application of a proper design philosophy and proper maintenance and repair [6].
Therefore, a lot of studies have been carried out to help understand and improve the impact response of composite materials and structures [6-11]. However, there are few results concerning the forming of the permanent indentation [6,12-13], which is one of the main criteria for the definition of damage tolerance in composites. Thus, the aim of this paper is to improve the knowledge of the permanent indentation behaviour after a certain period of time. Generally, the indentation just after the test, which is the temporary indentation, is always bigger than the indentation after a certain period due to the relaxation of the impacted composites. Some of researchers neglected this effect and assume the indentation became permanent after 48 hours [6,11].
In this study, the indentation of the impacted composites will be measured longer than 48 hours in order to observe the indentation depth evolution whether it has become permanent after certain period or it keep reducing with time. To support this analysis, microscopic observations are also carried out to study
the inside rupture areas of the impacted plate. This project deals with low velocity impacts on the composite structures to study this phenomenon.
Besides that, C-scan technology is often used to determine the global delamination area of plate being impacted as reported in the literature [2]. However, it is difficult to extract the delamination area between the interfaces. To overcome this limitation, the availability of microscopic observation results has been used to identify the delamination area at each interface. Results of delamination areas from both C-scan and microscopic observations have been compared and discussed in this paper.
2.0 MATERIALS AND METHODS
Two different tests were carried out in this study. The first one is impact test (dynamics test) and the second test is indentation test (quasi-statics test). Both tests are using different test set-up. A charge-coupled device (CCD) camera system was used to obtain the images of specimen surface in three dimensional. Thus, the surface deformation after the test can be observed to measure the relaxation of indentation depth.
2.1 Specimen Fabrication
The specimens used were made from high strength carbon fibers with an epoxy resin as matrix which is the unidirectional (UD) oriented fibres of the type T700 and matrix of M21. The specimens consist of 16 layers of plies with the symmetric stacking sequence [0°2/45°2/90°2/45°2]s. The panels were cut into
specimens of 150 x 100 mm in dimension with an average thickness of 4.16 mm. This is standard size of specimens prescribed by the industry. Only two specimens were used in this study, T-dyna and T-static for impact and indentation tests respectively.
2.2 Impact Test
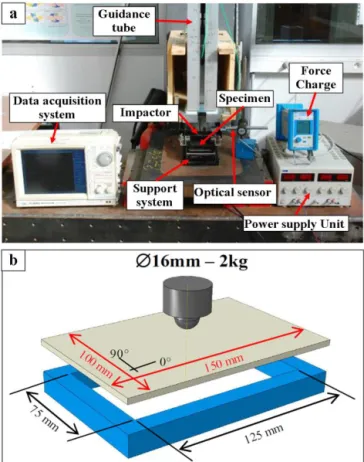
Impact tests were performed using a drop tower system with an impactor with 8 mm radius and 2 kg mass as shown in Figure 1a. The test is according to the guidelines from the standards ASTM D7136/D7136M [14]. The specimen was placed under the drop tower with simply supported on a of 75 mm x 125 mm frame, as shown in Figure 1b. The test was performed at impact energy of 25 J. This energy provides sufficiently different damage mechanisms around the BVID threshold and does not reach the perforation level [2,12]. During the test, the optical sensor, accelerometer and force sensor were installed to measure the impact forces, accelerations and optical signal for plate deflection. All the data were recorded using Yokogawa DL708 digital oscilloscope and acquired at the maximum rate of 200 kHz because the impact test is very dynamic that gives a wide range of frequencies.
2.3 Indentation Test
The indentation test (static test) was carried out after the analyses of the impact test were done. This is because from the analysis of impact test, the total displacement can be obtained which is the parameter that can be set equal to the indentation test. In other words, during the indentation test the displacement of the impactor can be controlled.
Figure 1 (a) The arrangement of the impact test (b) Boundary condition
of the impact test
Figure 2 The indentation test arrangement on the test machine
The indentation test was done by using the Instron 4206 test machine. The set-up of the test can be seen in the Figure 2. The impactor is the same used in the impact tests. Similarly, the specimen was placed on a simple rectangular frame support as in impact test. The displacement of the impactor was controlled by the feed of the test machine’s crosshead and the loading speed was set at 2 mm/min. The displacement was measured using Linear Variable Differential Transformer (LVDT) as this instrument allows more accurate values than the displacement measured by the test machine. The LVDT was installed parallel to
the vertical axis and attached to the crosshead. It gave out a voltage signal depending on the vertical displacement of the impactor. The load cell in the test machine provides the force signal that acts on the specimen. As in the impact tests, the force and displacement data were recorded using the Yokogawa DL708 acquisition system. The indentation test took longer times than the impact test, thus no large frequencies will appear. Therefore, the range is set to a minimum of 500 Hz and the data were recorded for every 0.5s. The CCD-cameras system was place behind the test machine to observe the specimen’s surface just after the test and the following three days.
2.4 Post-Mortem Analysis
In this study, two different types of post-mortem analyses have been carried out namely C-scan and microscopic analyses. The objective is to observe any important marks such as fibre breakages or matrix cracking which is invisible to the images taken during the tests that can support the results obtained from the impact or indentation tests.
2.4.1 C-Scan Analysis
C-scan analyses were done on the impacted specimens to detect the delamination areas which could not be seen through the naked eyes. The ultrasonic waves were sent towards the interior surface to detect delamination. The travelling time was measured and it could be converted to the distance of reflected waves. Then, the area of delamination in each inter-laminar if it occurred could be examined. An interpretation from the results of C-scan was not difficult, the range of colour showed clearly the delamination. The results from C-scan were the pictures of the impact specimen which had a wide range of colour as presented in the following section. From this colour ban, the delamination in each layer can be distinguished. Moreover, a photo of C-scan on the other side is necessary to make sure that the areas of delamination are correctly detected.
2.4.2 Microscopic Analysis
Figure 3 Specimen preparations for microscopic observation (a) the plate
after being cut (b) The areas that were polished and observed (section no.2)
The microscopic analysis was done by using an optical microscope on both impacted specimens, T-dyna and T-static. First, the specimens were cut along the 0° and 90° through the impacted area as shown in Figure 3. After the microscopic observations have been done at both sections, only then the 45° section was cut. However, before cutting, the specimens are immersed in resin together with chemical hardener (catalyse polyester peroxide) to make sure the debris will not be removed during the cutting and polish processes as demonstrated in [15]. These microscopic observations were made to study the debris behaviour inside the crack areas and also to measure the crack length between the interfaces that occurred after the plate being impacted. The measurement of the crack length can be used to
validate with the C-scan result. Besides that, the microscopic observation can be useful to study the general behaviour of damage that occurred after plate being impacted.
3.0 RESULTS AND DISCUSSIONS
3.1 Force-Displacement Curves
After all the data have been analysed, a few curves have been plotted to show more precise the phenomenon of this impact test. The most interesting curve to study is the force-displacement curve of the test. It gives information about the specimen’s rigidity, which is the slope of the curve, and about the appearance of damages [9]. In Figure 4, the force curve for impact test increased continuously, under the formation of further small damages. When the maximal displacement is reached the force decreases steadily until almost zero. From the curves, it showed the maximum displacement is 5.7 mm. This maximum displacement value is important for the indentation test because this is the maximum displacement value fixed for the indentation test. This value was set at the linear variable differential transformer (LVDT). The maximum energy obtained in this test is almost same as the impact test which is 24.8 J. Similarly, the force for the indentation tests increased linearly at the beginning due to no damage occurs on the specimen. However, after reaching 2.3 mm the damage starts to occur on the specimen due to the specimen started to lose in the stiffness. Another marked appearance of damage can be seen clearly at the displacement of 4 mm. The sudden loss of energy from 8.5 kN to 7.2 kN is caused by the fibre cracks.
Figure 4 The comparison of force-displacement curves between impact
and indentation tests
Between the impact and the indentation test, there is one parameter in common, namely the maximal displacement of the impactor. Therefore, a good possibility is given to compare the results of these two different tests. Although the maximal displacement of 5.7 mm was shown by the LVDT machine, however Figure 4 shows that the maximal displacement is only achieved by 5.4 mm. This is probably caused by error in setting LVDT machine at the beginning of the test. This difference is neglected for further analysis. Besides that, the force curve increased linearly longer in the indentation test than in the impact test. Moreover, the force at the same respective displacement is larger in the case of the impact test than the indentation test. From previous studies [11], this phenomenon is explained due to the inertia effect that occurs during the impact test because of the
deformation loading speed in the impact test is higher compared to the indentation test. Thus, the inertia of the dynamically loaded specimen is larger and it reacts stiffer upon the loading. This result is compatible with the other authors that have also obtained the similar trend of the force curves of impact and indentation tests [2,12,16–18].
3.2 Indentation Depth Analysis
A further criterion to assess the damage caused by an impact test or static test is the indentation depth of the plate at where the impactor has knocked. The characteristics of the permanent indentation after certain relaxation are one of the main interests in this study. Therefore, the indentation depth of both specimens; T-dyna of impact test and T-static of static test were measured. A series of 3D images of the damaged specimen has been taken for a few days after the tests to measure the plate’s indentation by using the CCD-cameras. The indentation was observed directly after the test. From the CCD-camera systems, it gave the contour plot images of the specimen by using Vic Snap and Vic 3-D Digital Image Correlation as shown in Figure 5a. These contour plot images were used for the determination of the indentation. The indentation can be seen in the middle of the plates as shown in Figure 5b. Besides that, a global deformation of the specimens can be marked. The specimen has a twisted shape after being damaged because of the plasticity of the resin (Figure 5b) even though the resin’s characteristic is brittle. However, the plasticity can occur in this case.
Figure 5 The Image from Vic 3-D Digital Image Correlation (a)
Coordinate system and size (b) The twisted shape of specimen after being damage
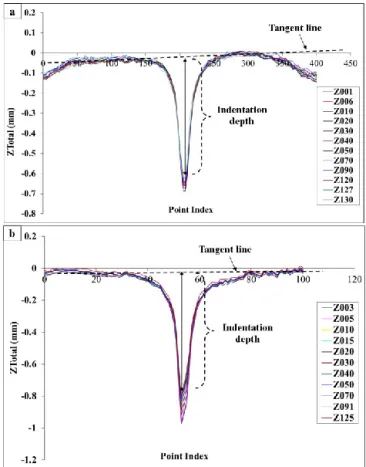
The taken images were marked as Z001, Z002, Z010 and so on. The number 001 or 006 are representing the first image or the
sixth image taken by the CCD camera and Z is representing the displacement in Z-direction. One tangent line was drawn approximately in the middle between the curves. The indentation depths were measured from the point on the tangent line to the lowest peaks of each curve as in the Figure 6.
Figure 6 The indentation depth measurements (a) impact test) (b)
indentation test
All the results of the indentation depths of each curve for the impact and the static test were put in Tables 1 and 2. As mentioned before, all the images are representing the time when the images were took by the CCD-Camera system. The times distance between the images were also included in the tables below.
Table 1 The evolution of indentation depth of impact test on plate T-dyna
No. of
Picture (Hours) Time Depth (mm) Indentation Decrease Speed of
Z001 (ref) 0 0.67264 - Z006 0.23 0.65872 -0.090330 Z010 0.43 0.64631 -0.031523 Z020 1.15 0.63928 -0.012081 Z030 1.98 0.63372 -0.005776 Z050 4.07 0.62795 -0.002257 Z070 7.97 0.62463 -0.001134 Z090 16.63 0.61836 -0.000648 Z120 40.58 0.61041 -0.000455 Z127 47.58 0.60890 -0.000009 Z130 286.667 0.60886 -
Table 2 The evolution of indentation depth of indentation test on plate
T-static No. of
Picture (hours) Time Depth (mm) Indentation Decrease Speed of
Z003 (ref) 0.017 0.94222 - Z005 0.033 0.92765 -0.8500745 Z010 0.067 0.90183 -0.7178192 Z015 0.083 0.89354 -0.4076438 Z020 0.100 0.88892 -0.1713831 Z030 0.300 0.85826 -0.0770489 Z040 1.000 0.82303 -0.0367393 Z050 2.000 0.79891 -0.0056559 Z070 9.717 0.77618 -0.0012278 Z091 21.717 0.77591 -0.0000046 Z125 93.300 0.77581 -
Thus, by knowing these data the curve of relaxation of the indentation depth were plotted as shown in the Figure 7a. As a result, the characteristics of indentation depth after certain period of time were as expected, the depth will decrease due to relaxation of the specimen. The difference between temporary and permanent indentation depth for impact test is ≈10 % and ≈18 % for the static test. In reality, the initial indentation depth (D0) for
both cases is difficult to obtain, especially for the impact test. Hence, in this study the D0 value is assumed as the indentation
depth of the first picture which was taken just after either the impact or the static test. Therefore, there is always a gap between the original D0and the assumed D0 depending on how fast the
first picture was taken. For both tests, when the plate gets unloaded, the deformation which occurred on the plate tries to back its initial location due to the elasticity of the material that is called the plate relaxation. The debris can prevent that relaxation, the better it is distributed the higher is that effect. It is obvious a better distribution can occurs during a static test because the debris has more time to fill the free space of the cracks [4,9]. Referring the speed of decrease for both tests, during the first 5 hours the indentation decreased dramatically but after that it started to decrease steadily. It is almost constant after 45 hours of the tests. Figure 7b has shown that the indentation depth of the plate performed under static test has greater decrease of speed than the impact test. The reason for this phenomenon was not yet found. The counting of fragment or debris of each plate through the microscopic observation could give some idea of this behaviour.
3.3 Debris Observation
The microscopic observations on the 90 and 0 sections cut have shown that there are plentiful of debris exists in the delaminated areas in both sections. Besides the delamination between the interfaces, matrix cracking and fibres rupture are also exists in many areas as shown in Figure 8. Similarly, for the 45 section cut, there are also a lot of debris exists in the delaminated area. Therefore, it seems difficult to count the debris with the naked eyes. Hence, it can be concluded that the existing of these debris will tend to block the fibres and matrices of the specimen being impacted to return to its initial location. It will affect the relaxation of indentation. This could give the general explanation why in previous section the indentation depth became constant after certain period of times. When the crack areas became
smaller with time due to relaxation, it will stop when the debris inside the crack areas cannot move anymore. The hypothesis of this mechanism may be due to the creep phenomenon of the little debris which prevents the broken fibers and matrices moving back to its initial location.
3.4 Delamination Area Analysis
Delamination area of impacted plate taken from the C-scan analysis was measured for each interface as shown in Figure 9. The delaminated area of each interface presents in Figure 9b was approximately extracted from the Figure 9a. From the color ban (Figure 9a), the delamination area in each layer can be distinguished. Moreover, the C-scan result on the non-impacted side (Figure 9a) is necessary to make sure the areas of delamination were properly extracted. There was no delamination if the plies were in the same orientation such as four plies of -45
in the middle of the laminates.
After that, the measurements of delamination length for each interface of C-scan result were compared with the delamination length calculated from the microscopic observation as presented in Figure 10.
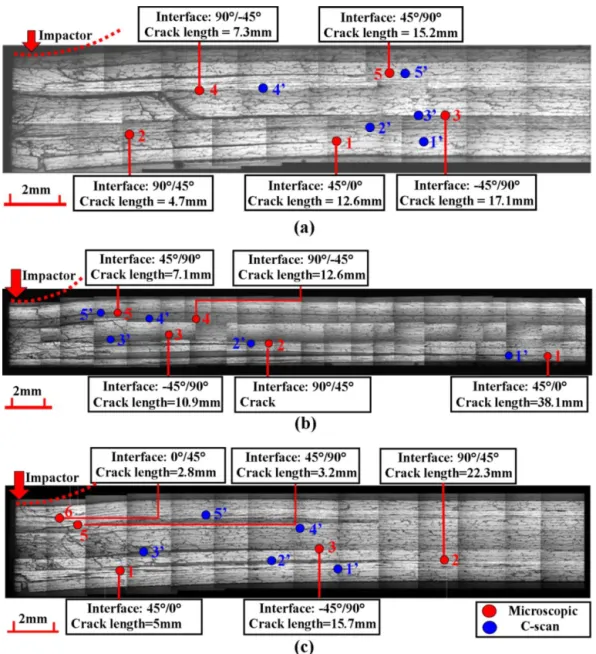
Generally, the delamination length measured from both microscopic and C-scan analyses have some differences. For a better comparison, the measurements from these analyses were plotted in Figure 11. As can be seen in Figure 10 and Figure 11a, the longest crack measured through the microscopic image along the 90° section cut was between the -45°/90° interface which is around 17.1 mm. Meanwhile for the C-scan, three different interfaces have almost the same longest crack around 16.2 mm. This is may be due to the minor error of the approximation process of delaminated area from the Figure 9a. Moreover, the C-scan results have shown that there are five interfaces encountered with delamination but from the microscopic observation, only four interfaces where the delamination can be clearly seen. The 45°/90° interface has only small delamination near to the impacted area.
The microscopic observation on 0 section cut has shown that the longest crack occurred at 45°/0° interface (38.1 mm) which is close to the C-scan result (35.5 mm) as presented in Figure 10b and Figure 11b. Besides that, the number of interfaces having delamination in both analyses is also similar with the delamination length of the other interfaces are compatible to each other.
For both microscopic observations on the 90 and 0 sections cut, the results obtained were rather satisfying compared to the C-scan result. However, for 45 section cut the results obtained by microscopic observation has shown that there are significant differences with the C-scan result. Referring to Figure 10c and Figure 11c, the longest crack occurred at 90°/45° interface with the length of 22.3 mm while for C-scan, the longest crack occurred at 0°/45° interface with length 16.5 mm. Besides that, the second longest crack is also different in both results where for the microscopic observation is 15.7 mm at -450/900 interface
while for C-scan at the same interface, the approximation made are only 6.5 mm. Another important point to discuss is there was a short crack at 0°/45° interface in the microscopic observation. These major differences may be caused by the difficulties to see exactly the delaminated area on each interface from the general result of C-scan (Figure 9a).
(a) (b)
Figure 7 (a) The percentage of evolution indentation depth of each test (b) The comparison of speed of decrease for both tests
(a) (a)
(b)
(b)
Figure 8 Some example of debris in the delamination areas and the
matrices cracking for (a) Near to the impact of 90 cut and (b) Near
to the impact of 0 cut
Figure 9 (a) General results from C-Scan (b) Approximation of delamination
Figure 10 Results of delamination length by microscopic observation (a) 90° section cut (b) 0° section cut (c) 45° section cut
4.0 CONCLUSION
The characteristics of the permanent indentation depth after certain relaxation of impacted plates are one of the main interests in this project. As expected the indentation depth decreased due to relaxation of the specimen and it has become almost constant after 48 hours of the tests. From the microscopic observations, this may be due to the existing of debris in the crack areas that tend to prevent the broken fibres and matrixes back their initial location.
Moreover, the specimen has been slightly twisted after being damaged and the statically loaded plate suffer more damage in terms of the indentation than impacted one. A reason for this might be due to the longer times taken by the impactor to hit the specimen during the indentation test. Besides that, the indentation depth of plate tested under the static test has also experienced greater decrease of speed than the impact test. The reason for this phenomenon has still not yet found and reported in the open literature.
The results of delaminated area obtained by both microscopic observation and C-scan are rather satisfying to each
other despite of some erroneous due the difficulties to see exactly the delaminated area on the 45° cut on the general result of C-scan (Figure 9a).
(b) 0° section cut
(c) 45° section cut
Figure 11 The results comparison of microscopic observation and
C-scan
Acknowledgement
The authors would like to thank the Department of Material and Structure Mechanic of Institut Supérieur de l’Aéronautique et de l’Espace for providing the research facilities and materials to undertake this work.
References
[1] D. Zheng. 2007. Low Velocity Impact Analysis of Composite
Laminated Plates. University of Akron. Ohio. PhD Thesis.
[2] N. Hongkarnjanakul, C. Bouvet, S. Rivallant. 2013. Validation of low velocity impact modelling on different stacking sequences of CFRP laminates and influence of fibre failure. Compos Struct. 106: 549–559. [3] D. Coutellier, J.C. Walrick, P. Geoffroy. 2006. Presentation of a
methodology for delamination detection within laminated structures.
Compos Sci Technol. 66: 837–845
[4] R.C. Alderliesten. 2008. Damage tolerance of bonded aircraft structures. Int J Fatigue. 1: 1–10
[5] R. Dilger, H. Hickethier, M.D. Greenhalgh. 2009. Eurofighter a safe life aircraft in the age of damage tolerance. Int J Fatigue. 31(6):1017– 1023
[6] A.A. Elias, C. Bouvet, R. Samuel, B. Broll, J.J. Barrau. 2009. Experimental analysis of damage creation and permanent indentation on highly oriented plate. Compos Sci Technol. 69: 1238–1245 [7] K. Henkhaus. 2003. Overview of research on composite material
impact behaviour. 16thEngineering Mechanics Conference, American Society of Civil Engineers, University of Washington, Seattle. [8] M. Aktas, C. Atas, M.I. Bϋlent, K. Ramazan. 2008. An experimental
investigation of the impact response of composite laminate. Compos
Struct. 87: 307–313
[9] J.F.M. Wiggenraad, R. Aoki, M. Gädke, E. Greenhalg, D. Hachenberg, K. Wolf, R. Bübl. 1997. Damage propagation in composite structural elements - Analysis and experiments on structures. Compos Struct. 36: 173–186.
[10] S. Petit, C. Bouvet, A. Bergerot, J.J. Barrau. 2007. Impact and compression after impact experimental study of a composite laminate with a cork thermal shield. Compos Sci Technol. 67: 3286–3299 [11] B. Broll. 2008. Experimental Studies On The Damage Mechanisms of
CFRP-Structures. Master Thesis. ISAE.
[12] C. Bouvet, S. Rivallant, J.J. Barrau. 2012. Low velocity impact modeling in composite laminates capturing permanent indentation.
Compos Sci Technol. 72(16): 1977–88
[13] W. He, Z. Guan, X. Li. 2013. Prediction of permanent indentation due to impact on laminated composites based on an elasto-plastic model incorporating fiber failure. Compos Struct. 96: 232–242.
[14] ASTM D7136/D7136M. 2007. Standard Test Method for Measuring the Damage Resistance of a Fiber- Reinforced Polymer Matrix Composite to a Drop-Weight Impact Event.
[15] H. A. Israr. 2014. Experimental and Numerical Investigation of CFRP
Composite Laminates under Crushing. Université de Toulouse: ISAE,
INSA, UPS, Emac; ICA (Institut Clement Ader). Phd Thesis. [16] S.S. Suh, N.L. Han, J.M. Yang, H.T. Hahn. 2003. Compression
behavior of stitched stiffened panel with clearly visible stiffener impact damage. Compos Struct. 62: 213–221.
[17] G. Belingardi, R. Vadori. 2003. Influence of the laminate thickness in low velocity impact behavior of composite material plate. Compos
Struct. 62: 27–38.
[18] A.T. Nettles, A.J. Hodge. 1997. The impact response of carbon/epoxy laminates. NASA/TM-97-206317.