HAL Id: hal-00466825
https://hal-mines-paristech.archives-ouvertes.fr/hal-00466825
Submitted on 23 Jul 2010HAL is a multi-disciplinary open access archive for the deposit and dissemination of sci-entific research documents, whether they are pub-lished or not. The documents may come from teaching and research institutions in France or abroad, or from public or private research centers.
L’archive ouverte pluridisciplinaire HAL, est destinée au dépôt et à la diffusion de documents scientifiques de niveau recherche, publiés ou non, émanant des établissements d’enseignement et de recherche français ou étrangers, des laboratoires publics ou privés.
Performance Prediction of Grid-Connected Photovoltaic
Systems Using Remote Sensing
Didier Mayer, Lucien Wald, Yves Poissant, Sophie Pelland
To cite this version:
Didier Mayer, Lucien Wald, Yves Poissant, Sophie Pelland. Performance Prediction of Grid-Connected Photovoltaic Systems Using Remote Sensing. International Energy Agency, 43 p. - http://www.iea-pvps.org/products/rep2_08.htm, 2008. �hal-00466825�
INTERNATIONAL ENERGY AGENCY
PHOTOVOLTAIC POWER SYSTEMS PROGRAMME
Performance Prediction of Grid-Connected
Photovoltaic Systems Using Remote
Sensing
IEA PVPS Task 2
Report IEA-PVPS T2-07:2008
March 2008
This technical report has been prepared under the supervision of PVPS Task 2 by: Didier MAYER and Lucien WALD,
Centre Energétique et Procédés, École des Mines de Paris/Armines, Sophia Antipolis,
Yves POISSANT and Sophie PELLAND,
CANMET Energy Technology Center, Varennes, Canada.
This report is supported by
Agence française De l’Environnement et de la Maîtrise de l’Energie (ADEME), France, Centre de la technologie de l'énergie de CANMET Varennes, Canada,
CANMET Energy Technology Centre Varennes, Canada.
The support of the
German Federal Ministry for the Environment, Nature Conversation and Nuclear Safety (BMU) is also acknowledged.
Table of Contents
FOREWORD ……….. 3
EXECUTIVE SUMMARY ……….. 4
INTRODUCTION ……… 5
1. SOLAR RESOURCE EVALUATION ………... 7
1.1 THE HELIOCLIM DATABASE 7
1.2 CALCULATION AT TILT AND ORIENTATION ANGLES 9
1.3 COMPARISON WITH SOLAR IRRADIATION MEASURED ON SITE: EVALUATION OF THE ACHIEVABLE ACCURACY 10
1.4 COMMENTS AND FURTHER STEPS 17
2. PV SYSTEM PERFORMANCE PREDICTION .………... 18
2.1 POLYNOMIAL REGRESSION MODEL 18
2.2 PV PERFORMANCE PREDICTION FROM DAILY DATA 19
2.3 PV PERFORMANCE PREDICTION FROM MONTHLY DATA 23
2.4 COMMENTS AND FURTHER STEPS 25 CONCLUSION .……… 26
REFERENCES ………... 27
ANNEX A: EXAMPLES OF ONGOING ACTIVITIES IN THE FIELD OF PV PERFORMANCE PREDICTION ……….. 28
ANNEX B: THE HELIOSAT 2 METHOD ………... 36
Foreword
The International Energy Agency (IEA), founded in November 1974, is an autonomous body within the framework of the Organization for Economic Cooperation and Development (OECD) which carries out a comprehensive programme of energy co-operation among its member countries. The European commission and the European Photovoltaic Industry Association (EPIA) also participate in the work of the IEA.
The IEA Photovoltaic Power Systems Programme (PVPS) is one of the collaborative R&D Agreements established within the IEA. Since 1993, the PVPS participants have been conducting a variety of joint projects in the application of photovoltaic conversion of solar energy into electricity.
The mission of the IEA PVPS programme is: to enhance the international collaboration efforts which accelerate the development and deployment of photovoltaic solar energy as a significant and sustainable renewable energy option. The underlying assumption is that the market for PV systems is continuously expanding from the earlier niche markets of remote applications and consumer products, to the rapidly growing markets for building integrated and other diffused and centralised grid-connected PV generation systems. This market expansion requires the availability of and access to reliable information on the performance of PV systems, technical and design guidelines, planning methods, financing, etc. to be shared with the various actors. The overall programme is headed by an Executive Committee composed of one representative from each participating country, while the management of individual research projects (Tasks) is the responsibility of Operating Agents. By mid 2007, twelve Tasks were established within the PVPS programme.
The overall objective of Task 2 is to improve the operation and sizing of photovoltaic systems and subsystems by collecting, analysing and disseminating information on their technical performance and reliability, providing a basis for their assessment, and developing practical recommendations for sizing purposes.
The current members of the IEA PVPS Task 2 include:
Austria, Canada, European Commission, European Photovoltaic Industry Association, France, Germany, Italy, Japan, Sweden, Switzerland, United Kingdom, United States of America and Poland as an observer.
This report concentrates on the possibility of using solar irradiation calculated from satellite images for PV systems performance prediction. Comparisons have been made to irradiation measurements from systems present in the Task 2 PV Performance Database. A simple performance model has been applied to simulate the global system operation. Results are presented with their related accuracy. The technical report has been prepared under the supervision of PVPS Task 2 by:
Didier MAYER and Lucien WALD, Centre d’Energétique et Procédés, École des Mines de Paris/Armines, Sophia Antipolis, France (FRA),
Yves POISSANT and Sophie PELLAND, CANMET Energy Technology Center, Varennes, Canada (CDN).
The report expresses, as nearly as possible, the international consensus of opinion of the Task 2 experts on the subject dealt with. Further information on the activities and results of the Task can be found at: http://www.iea-pvps-task2.org and http://www.iea-pvps.org.
Executive Summary
One of the major challenges faced by the photovoltaic industry today is to deliver secure and reliable power while managing uncertainties related, on the one hand, to fluctuations and intermittency of the energy source and on the other hand, to the full energy conversion process. Meeting the challenge requires accurate and timely information on the present and future availability of the solar resource as well as other data on parameters affecting the energy yield (close and remote shading, converters’ characteristics).
This document reports, in the first part, on the possibility to use solar irradiation calculated from satellite images for performance predictions. In the second part, different system performance evaluation models are described. The use of calculated irradiations as an input to a simple parametric model is compared with measurements from systems existing in the Task 2 Performance Database. Conclusions are drawn on the related achievable accuracy.
Remote sensing data from satellites offers an attractive and competitive approach to deliver global data sets of energy resources. Large areas of the earth’s surface can be monitored at high spatial (3x3 km2) and timely (15 minutes) resolutions using uniform and consistent
methodologies. In order to make a first step forward it seemed important to compare the value extracted from the Helioclim-2 database, processed at the proper tilt and orientation angles, with some measured values on installation sites. Selected systems from the IEA PVPS Task 2 Performance Database were used as case studies. The first results have shown that in order to correctly take into account the PV system environment (in the albedo viewpoint), a fit between calculated and measured values was sometimes necessary. During spring and summer time a root mean square error (RMSE) of less than 10 % on monthly values has been achieved while 20 % was achieved during winter time. In all cases, a RMSE of less than 10 % on yearly values is observed.
Among several different system performance evaluation tools, a simple parametric model was chosen to illustrate the confidence that can be given to a simple approach predicting the output of PV systems which requires no other input data than temperature and irradiation from the HelioClim-2 irradiation database. The first results showed that to get the best results, the period used to fit the model parameters must be correctly chosen. Having taken this into account, a simple polynomial model calibrated for the selected system and monthly input data from the HelioClim-2 irradiation database could yield monthly predictions within 15 % of the measured output and with a yearly RMSE of about 10 %.
Introduction
The growth of domestic and large scale applications of photovoltaics (annual growth of more than 40 % worldwide since 2000) demonstrates that the technology has stepped out from demonstration phases into large-scale deployment. An emerging, challenging and innovative market is currently being created. Several countries have started to exploit this huge potential as part of their future energy supply. One of the most successful instruments in developing renewable energy strategies are cost effective feed-in tariffs. Even if some countries largely encourage the integration of PV in buildings, as is the case in France, such mechanisms now also offer favourable financial conditions for large PV power stations.
To ensure the growth of the PV sector, further investigations are needed to give a certain level of security for such investments. A decision for an investment into a PV system, whatever the size, has to be carried out carefully. The main influence on the output, beside the system design, is the choice of the location and the accurate estimation of the energy generation potential.
The yield estimation has to be provided for all categories of PV systems from small configurations of 1-5 kW with an investment of several thousand euros up to a multi MW system with a total investment of several million euros.
One of the major challenges faced by the PV industry today is to deliver secure and reliable power while managing uncertainties related on the one hand to fluctuations and intermittency of the energy source and on the other hand to the full energy conversion process. Meeting the challenge requires accurate and timely information on the present and future availability of the solar resource as well as other data on parameters affecting the energy yield (close and remote shading, converters characteristics etc.).
The growth in the solar sector boosts the demand for more accurate information on performance prediction. To meet this demand, new data, algorithms, and derived products have to be developed to serve specific needs. Looking at the technical and scientific barriers, the international efforts aim at improving the maturity of data collection and processing techniques and in standardisation of derived products in order to provide the customers with optimised information.
Depending on purpose, different kinds of information are needed:
- long term historical data sets of the expected energy yield: to support technical feasibility studies, optimal sitting, adequate sizing, and bank audits of power plants, - real-time data sets on available energy resources: to support the management of
power plants and the optimisation of energy production,
- recent, real-time and forecasted site specific irradiances: to support the management of large dispersed PV resource throughout regional power grids as soon as the penetration of PV installations reaches a few percent,
- local solar resource characterisation and reliable estimate on the availability of solar irradiance: to support sensible socio-economic planning concerning the development of solar energy applications, intelligent decisions concerning the future of solar,
- real-time data sets on weather and environmental conditions: to support forecasting of electricity demand, which largely determines the price for buying selling and trading of electric power.
Such statistics should be based on historical data from at least 10 years time series. The data accuracy affects the success of the solar energy projects and the uncertainty in the data can make a difference between profit and loss from the investment. The climate statistics are needed by the decision makers to define appropriate support programmes that are tailored to the needs of countries and regions. Extreme meteorological events and indicators of climate change raise concerns whether the existing historical data are capable to provide accurate enough predictions of the climate for the next 20-25 years.
If we consider that system design and component behaviour are the most important factors in ensuring reaching a high performance ratio (PR), the system energy yield will nevertheless be a function of the solar irradiation level at the installation site. Thus, the performance prediction, of grid-connected PV systems is linked to a good appraisal of the solar irradiation but also to a good design of the energy conversion process.
The traditional approach of collecting solar resource data has been through field surveys and in-situ monitoring which are generally expensive and can only provide local measurements. By contrast, remote sensing data from satellites, referred to as earth observation data, offer an attractive and competitive approach to deliver global data sets of energy resources. Satellite remote sensing in combination with ground meteorological measurements and other information has become an increasingly important and effective way of developing solar resource information over large areas.
Regarding PV systems performance evaluation, a number of different methods have been developed to evaluate the performance of PV systems. Simulation codes can be used to simulate the behaviour of PV systems after having described the configuration of the installation and the related components. However, some components characteristics which are required to run a model are not easily available when the so-called components are not in the software database. Another approach, when data from a monitoring period are available for a given installation, is to consider a simple parametric model for which the parameters will be identified from existing time-series of global operational data.
The IEA PVPS Task 2 has gathered operational datasets for more than 400 systems in its Performance Database over a period of nearly ten years. This allowed some important results on the long-term performance of PV systems to be brought through the evolution in time of indicators like the PR. The influence of external parameters such as the shadowing effect, the module temperature or the behaviour of some inverters has also been highlighted. Moreover, irradiation data for many locations at different tilt and orientation angles is also part of the available data sets.
The aim of this document is to present the results obtained by using the IEA PVPS Task 2 Performance Database in the evaluation process:
- of solar irradiation using satellite data by comparison with measured values, - of a simple parametric performance evaluation tool
- of the coupling of both approaches
1. Solar Resource Evaluation
One of the factors determining the performance of the PV system is the solar energy impinging upon the earth’s surface. A significant improvement of our knowledge of the availability of solar energy resources on a global, regional up to a local level is needed to:
- contribute to setting up effective state and regional policies,
- help researchers, manufacturing industry, installing and maintenance companies to assess the performance of different PV technologies in different climatic regions,
- support other related economic sectors and increase awareness of the general public, - assist utilities in adaptation of energy distribution networks to manage flows from multiple
electricity suppliers to satisfy timely and geographically variable demand.
Therefore for proper site selection, maps of the solar irradiance components are required which can provide a reliable estimate of the average insolation. As the operation of a dense high quality measurement network is far beyond feasibility, and interpolation of terrestrial measurement does not give a realistic distribution of insolation, today it is common sense that such maps should be derived from satellite data, an approach that in principle combines spatially distributed information with fast data access.
The advantage of the satellite-based approach is that large areas of the earth’s surface can be monitored at high spatial and temporal resolutions using uniform and consistent methodologies at relatively low costs when compared to developing the same information using a ground-based network. Satellites are complementary to ground measurements; they improve the understanding of spatial distribution and dynamics of the solar resource.
Meanwhile, for mapping of solar resources several methods and services are set up, which mainly rely on satellite data.
1.1
The HelioClim Database
An objective of the École des Mines de Paris/Armines is to produce data of solar radiation, namely databases and time-series of irradiance or irradiation. These databases are produced by the processing of satellite images, especially from the Meteosat series of satellites. The databases are called HelioClim and can be accessed through the SoDa Service ( www.soda-is.com), which is a web service devoted to solar radiation providing the user with solar radiation data and giving some information on possible applications and training facilities.
HelioClim is a family of databases which comprise irradiance and irradiation values. They cover Europe, Africa, the Mediterranean Basin, the Atlantic Ocean and part of the Indian Ocean. Period runs from 1985 onwards. The Meteosat data are routinely received by a receiving station at École des Mines and processed in real time. This is possible thanks to a fruitful collaboration with Meteo-France and Eumetsat. Table 1.1 describes the main characteristics of the current HelioClim databases.
Table 1.1: Main characteristics of the current HelioClim databases
HelioClim-1 HelioClim-2
Period 1985 – 2005 Since 2004, onwards
Time resolution Day 1 hour
Geographical coverage Longitude: -66, 66 Latitude: -66, 66 Longitude: -66, 66 Latitude: -66, 66
Space resolution Approx. 20 km 5' of arc angle. Approx. 10
km at mid-latitude
Parameters Irradiance, irradiation,
global on horizontal
Irradiance, irradiation, global on horizontal
Update None, except new versions Every hour, real time
Method Heliosat 2 Heliosat 2
Relative uncertainty
(RMSE) for hourly values 20 – 22 % -
Relative uncertainty
(RMSE) for daily values 18 % 18 %
Relative uncertainty
(RMSE) for monthly values 12 % 12 %
Table 1.2 gives the main characteristics of the HelioClim databases in preparation: HelioClim-3 should replace HelioClim-2, and should be replaced in turn by HelioClim-4. HelioClimDay should include HelioClim-1 and offer a consistent series of values from 1985 onwards.
Table 1.2: Main characteristics of the HelioClim databases in preparation
HelioClim-3 HelioClim-4 HelioClimDay
Period Since 2004, onwards Since 2004, onwards Since 1985, onwards
Time resolution 15 min 15 min Day
Geographical coverage Latitude: -66, 66 Longitude: -66, 66 Latitude: -66, 66 Longitude: -66, 66 Latitude: -90, 90 Longitude: -66, 66
Space resolution Approx. 5 km Approx. 5 km Approx. 5 km
Parameters Irradiance, irradiation, global on horizontal Irradiance, irradiation, global, direct and diffuse on
horizontal, spectral distribution
Irradiance, irradiation, global
on horizontal
Update Every 15 min, real
time Two days delay
Every day, real time
Method Heliosat 2 Heliosat 4 Data fusion
Status Designed. Validated. Under construction. Should be available in January 2008. Designed. Working on software for satellite data processing Under design
The relative uncertainty obtained on the values stored in the HelioClim databases is given in Table 1.1. The data extracted from the HelioClim-2 database, calculated at a one hour time step, have been confirmed on several sites all over Europe to bring a better accuracy than the one in the HelioClim-1. One example is given in Fig. 1.2.
0 50 100 150 200 250 04-01 05-01 Month M ont hly m ean of ir radianc e ( W /m 2)
Ground HAMBURG / SASEL HC1v4 Hamburg / sasel HC2 Hamburg / sasel y = 0,8108x - 4,4509 R2 = 0,9896 y = 1,0469x - 2,5367 R2 = 0,9967 0 100 200 300 0 100 200 300
Monthly mean of irradiance observed at ground (W/m2) H C ir radi an ce ( W /m 2) HC1v4 Hamburg / sasel HC2 Hamburg / sasel Linear HC1v4 Hamburg/Sasel Linear HC2 Hamburg / sasel
Fig. 1.1: Comparison between HelioClim-1 and HelioClim-2 average monthly data and those measured by the Hamburg meteo station, on a horizontal surface for 2004 and 2005.
1.2 Calculation at Tilt and Orientation Angles
The processing of Meteosat images gives an estimation of the global irradiance on an horizontal plane. In order to be compared with on-site measurements of the solar irradiance performed on a PV installation site, this data has to be transformed to take into account the tilt angle and the orientation of the PV generator.
There are a few algorithms which allow the split of the global irradiance into its direct and diffuse components and then make the combination of their contribution to the tilt and orientation. The higher the time resolution, the more accurate the results will be. At present, time resolution is one hour with HelioClim-2, and in the near future, will be 15 minutes with HelioClim-3. The algorithmic chain used to calculate from the horizontal to the tilted and oriented plane is given in the most recent version of the European Solar Radiation Atlas.
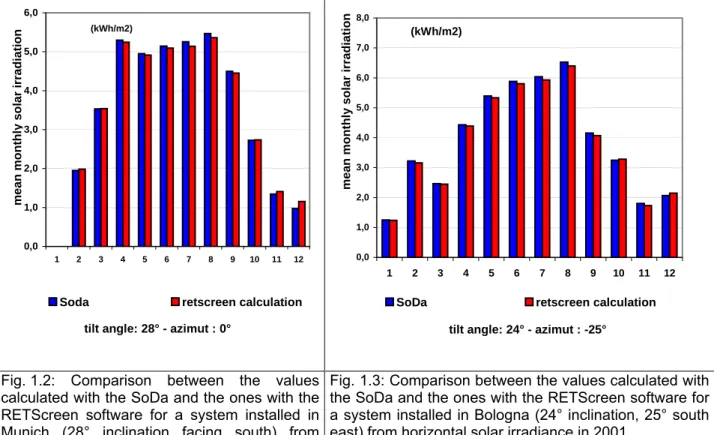
It is very difficult to validate the algorithmic chain used in the SoDa processor with measured data, as both global horizontal and tilted solar irradiance are rarely available for the same site. The only possible comparison can be made with the same type of processors used in well known and widely used software.
Fig. 1.2 and Fig. 1.3 show the results obtained with the SoDa and the RETScreen software on two different locations:
0,0 1,0 2,0 3,0 4,0 5,0 6,0 1 2 3 4 5 6 7 8 9 10 11 12
Soda retscreen calculation
(kWh/m2) mean monthl y s o la r irra dia tion
tilt angle: 28° - azimut : 0°
0,0 1,0 2,0 3,0 4,0 5,0 6,0 7,0 8,0 1 2 3 4 5 6 7 8 9 10 11 12
SoDa retscreen calculation (kWh/m2)
mean monthly solar irradiation
tilt angle: 24° - azimut : -25°
Fig. 1.2: Comparison between the values calculated with the SoDa and the ones with the RETScreen software for a system installed in Munich (28° inclination facing south) from horizontal solar irradiance in 2004.
Fig. 1.3: Comparison between the values calculated with the SoDa and the ones with the RETScreen software for a system installed in Bologna (24° inclination, 25° south east) from horizontal solar irradiance in 2001.
In each case, the relative difference between the data calculated by each software is less than 2%.
1.3
Comparison with Solar Irradiation Measured On Site: Evaluation of the
Achievable Accuracy
In order to evaluate the confidence that can be attributed to the solar irradiation values coming from the HelioClim-2 database processed at tilt and orientation angles, comparisons have been conducted with systems stored in the IEA PVPS Task 2 Performance Database. As the HelioClim-2 one hour time step database is only available since February 2004, it has been compulsory to select some systems in the Performance Database for which detailed operational data were available from that date onwards.
Three systems have been selected:
- the Soleil Marguerite system: 13 kW installed at Villeurbanne (tilt: 30° full South) - the Munich Trade Fair Centre: 1 MW installed at Munich (tilt : 28° full South)
-
the F1 system: 1 kW rooftop installed at Lyon (tilt : 17°, 30° South West).For each of these systems the comparison has been made on a daily basis allowing for the calculation of the root mean square error (RMSE) for monthly values and for yearly values based on monthly means.
Soleil Marguerite PV System
Detailed data, every quarter of an hour, was available for the year 2004 and monthly means have been delivered for 2005 and 2006.
The processing of detailed data for 2004 made it possible to correct the HelioClim-2 values in order to fit the best with the on-site measured values. This correction step is necessary only at times. Fig. 1.4 illustrates the difference between measured and calculated values and Fig. 1.5 shows the correction which was drawn from the comparison of the data at the daily level. A linear relationship is enough for such a correction. As the discrepancy between measured and calculated values differs for sites exhibiting similar solar climates, it is believed that the major cause for differences at Soleil Marguerite comes from the difficulty to catch the specific value of the site albedo. The albedo value is very sensitive to the installed system environment and it is difficult to take into account the real environment of an installation with a 10 km x 10 km space resolution, especially in urban conditions. Fig. 1.6 gives a view of the urban environment of this installation.
Fig. 1.4: Comparison of the solar irradiation processed from the HelioClim-2 database and the solar irradiation measured on site on the tilted plane for the year 2004.
Fig. 1.5: Relationship between measured and calculated daily values in order to apply a correction on the HelioClim-2 data for this site.
Fig. 1.6: General view of the « Soleil Marguerite » installation and of its urban environment.
The correction has been applied to the HelioClim-2 data for 2004 leading to the results presented in Fig. 1.7 in terms of solar irradiation and in Fig. 1.8 in terms of RMSE monthly and yearly values. Fig. 1.9 and 1.10 show the comparison at the daily basis for the best and the worst months. 0 1 2 3 4 5 6 1 2 3 4 5 6 7 8 9 10 11 12 Month M ont hly m ean ir ra diat ion ( kW h/ m 2) AA
global tilted measured global tilted corrected
0 5 10 15 20 25 30
feb mar apr may jun jul year RMSE (%)
Fig. 1.7: Comparison of the solar irradiation
processed from the HelioClim-2 database, corrected according to the relationship given in Fig. 1.5, and the solar irradiation measured on site on the tilted plane for the year 2004.
Fig. 1.8: RMSE calculated at the monthly level from daily data and at the yearly level from monthly means.
Fig. 1.9: Comparison of the daily solar irradiation processed from the HelioClim-2 database and the daily solar irradiation measured on site on the tilted plane for June 2004.
Fig. 1.10: Comparison of the daily solar irradiation processed from the HelioClim-2 database and the daily solar irradiation measured on site on the tilted plane for February 2004.
daily mean irradiation
Global tilted corrected Global tilted measured
8 7 6 5 4 3 2 1 0 June 2004 kWh/m2 28 25 22 19 16 13 10 7 4 1
daily mean irradiation
kWh/m2
February 2004
Global tilted corrected Global tilted measured
29 27 25 15 2317 19 21 13 11 1 3 5 7 9 6 5 4 3 2 1 0
The correction calculated for 2004 was applied for the years 2005 and 2006 for which only monthly means were available. The results are presented in Fig. 1.11 for 2005 and in Fig. 1.12 for 2006. The RMSE on yearly values is respectively about 7 % and 6 % for 2005 and 2006.
0 1 2 3 4 5 6 7 1 2 3 4 5 6 7 8 9 10 11 12 Month M ont h ly m ean ir radiat io n ( k W h /m 2) AA
global tilted measured global tilted corrected
Fig. 1.11: Comparison of the solar irradiation processed from the HelioClim-2 database, corrected according to the relationship given in Fig. 1.5, and the solar irradiation measured on site on the tilted plane for the year 2005.
Fig. 1.12: Comparison of the solar irradiation
processed from the HelioClim-2 database, corrected according to the relationship given in Fig. 1.5, and the solar irradiation measured on site on the tilted plane for the year 2006.
F1 PV system
F1 is a roof integrated system (Fig. 1.13) for which detailed measured data were only available for 2004.
Fig. 1.13 : General overview of F1 system and of its roof integration with PV tiles.
As the F1 PV installation is located in the same region as the Soleil Marguerite one, the same correction was applied to the HelioClim-2 solar irradiation data, giving the results shown in Fig. 1.14 and 1.15 regarding the RMSE on monthly and yearly values. Fig. 1.16 and 1.17 give an illustration of the difference on the daily basis for the best and the worst month, in terms of accuracy. 0 1 2 3 4 5 6 1 2 3 4 5 6 7 8 9 10 11 Month M ont hly m e an ir ra diat ion ( k W h /m 2) A A
global tilted measured global tilted corrected
Fig. 1.14: Comparison of the solar irradiation processed from the HelioClim-2 database, corrected according to the relationship given in Fig. 1.5, and the solar irradiation measured on site on the tilted plane for the year 2004.
Fig. 1.15: RMSE calculated at the monthly level from daily data and at the yearly level from monthly means.
Fig. 1.16: Comparison of the daily solar irradiation processed from the HelioClim-2 database and the daily solar irradiation measured on site on the tilted plane for June 2004.
Fig. 1.17: Comparison of the daily solar irradiation processed from the HelioClim-2 database and the daily solar irradiation measured on site on the tilted plane for November 2004.
Munich Trade Fair Centre Photovoltaic system
This is a 1 MW roof integrated photovoltaic system (Fig. 1.18).
Fig. 1.18: General overview of the Munich Trade Fair Centre roof integrated PV system (Courtesy of Solarenergieförderverein Bayern e.V.).
Detailed data on an hourly basis were available for the years 2002, 2003 and 2004. Thus, the comparison could only be made for 2004. Fig. 1.19 shows the results obtained without any corrections with the related RMSE on monthly and yearly values in Fig. 1.20.
In this case, no correction has been applied to the satellite data. The albedo value, calculated from satellite images, seems very representative of a site which does not suffer from its environment. Here also, Fig. 1.21 and 1.22 give the comparison of the solar irradiation values for the best and the worst months in terms of accuracy.
Fig. 1.19: Comparison of the solar irradiation processed from the HelioClim-2 database and the solar irradiation measured on site on the tilted plane for the year 2004.
Fig. 1.20: RMSE calculated at the monthly level from daily data and at the yearly level from monthly means.
Fig. 1.21: Comparison of the daily solar irradiation processed from the HelioClim-2 database and the daily solar irradiation measured on site on the tilted plane for June 2004.
Fig. 1.22: Comparison of the daily solar irradiation processed from the HelioClim-2 database and the daily solar irradiation measured on site on the tilted plane for December 2004.
The RMSE values obtained during the winter period are much higher for this system than for the two systems installed in the Lyon region. This could come from periods of clear sky with a snow cover which the satellite interprets as a cloudy period. A representative example is shown in Fig. 1.22 between the 13th and the 19th and the 29th and the 31st of December 2004.
1.4
Comments and Further Steps
Remote sensing data from satellites offer an attractive and competitive approach to deliver global data sets of energy resources. Large areas of the earth’s surface can be monitored at high spatial and temporal resolutions using uniform and consistent methodologies. If it is agreed that such data will become more and more widely used to evaluate the potential of a site or to predict the performance of an installation for different purposes such as maintenance or energy optimization, it seems important to quantify their related accuracy and to develop procedures able to give some reliable interval of confidence.
In order to make a first step forward, it was important to compare the value extracted from the HelioClim-2 database, processed at the proper tilt and orientation angles, with some measured values on installation sites. The IEA PVPS Task 2 Performance Database was used to identify systems for which detailed data sets were available during the convenient period of time to make such an analysis possible.
The first results have shown that:
- A correction of the HelioClim2 data is necessary in order to better take into account the albedo value of the corresponding installation site, namely in case of an urban environment.
- The correction applied to a particular site, calculated over a period of time, one year in this case, can be considered as representative of the site and be applied for any other period.
- A RMSE of less than 10 % on yearly values is feasible.
- At the monthly level, a RMSE of less than 10 % can be obtained for sunny periods (spring and summer). For covered seasons, like winter, a 20 % RMSE seems more realistic at the expense of identifying snowy periods when the satellite is not able to calculate the correct site albedo.
These first very satisfying results deserve to be validated on several other sites. The correction to be applied has been determined over a one-year-period. It would be interesting to check if it is possible to reduce this period of adaptation from one year to a few months. Then it seems realistic to replace irradiance measurements by satellite data.
2. PV System Performance Prediction
The PVPS Task 2 Performance Database contains an impressive number of analytically monitored PV sites, which provide additional, relevant insolation values in sufficient time-density and continuity. This chapter aims to investigate what can be readily achieved in terms of PV system performance prediction by using the IEA PVSP Task 2 Performance Database and a model adapted to the type of data at hand. In order to illustrate the confidence that can be given to this approach, the analysis was made for two of the systems previously cited in chapter 1 for which corrected solar irradiation values coming from the HelioClim-2 database are available: - the F1 system: 1 kW rooftop installed in Lyon, France,
- the Munich Trade Fair Centre: 1 MW installed in Munich, Germany.
For each of these systems, the comparison was made on a daily basis allowing for the calculation of the root mean square error (RMSE) for monthly values and the RMSE for yearly values based on monthly means.
2.1
Polynomial Regression Model
A number of different models are presented in Annex C. From these models, a generic polynomial regression model was chosen to simulate the performance of the selected PV systems due to the large amount of operational data already monitored and the lack of availability of many fundamental parameters required by some of the more complex models. This section describes the modeling procedure.
The model consists of a polynomial fit to operational data where the power produced by the system is a function of the incident global irradiance in the plane of the array and the PV array module temperature described by this equation:
P = A + B T
module· H
i+ C H
i+ D H
i2 (1)where: Tmodule is the PV array module temperature,
Hi is the incident global irradiance,
A, B, C and D are polynomial constants determined by least square fits.
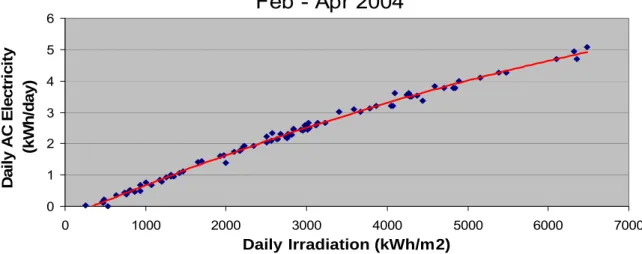
The simulation procedure requires first the calibration of the model to the system under study in order to obtain the polynomial constants that best represent the behaviour of the system. Once the model is well adjusted, the same constants are used along with new temperature and irradiance inputs to predict the power generated by the system. Figure 2.1 shows an example of the curve fit made to the operational data of the F1 PV system in Lyon presented in chapter 1.
Model Calibration for F1 PV System
Feb - Apr 2004
0 1 2 3 4 5 6 0 1000 2000 3000 4000 5000 6000 7000 Daily Irradiation (kWh/m2) D a ily A C E le c tr ic it y (k W h /d ay)Fig. 2.1: Polynomial fit of the F1 PV system output to measured daily irradiation data.
2.2
PV Performance Prediction from Daily Data
The polynomial model was used along with solar irradiation values from the HelioClim-2 database and measured data from the IEA PVPS Task 2 Performance Database to make performance predictions for selected systems. The comparison between model predictions and measured data were made on a daily basis in order to calculate the root mean square error (RMSE) for monthly and yearly values based on monthly means.
Figure 2.2 compares the monthly AC power production figures for the F1 PV system in 2004. As the HelioClim-2 one-hour time step database is only available from February 2004 onwards and the system performance data extends from January to December 2004 with one missing month (July 2004), the model was calibrated using daily measured data from February to April 2004 and predictions were made with the rest of the data (May to December with the exception of July). The measured data is represented by the black curve and the model fit to the data by the blue curve. For the period extending from April to December 2004, the red curve represents the model predictions using measured temperature and measured daily irradiation data as inputs and is an indication of the error introduced by the model alone (free of the uncertainty associated to the HelioClim-2 irradiation data). The green curve represents the forecasts made using the calibrated model and daily HelioClim-2 irradiation data. The HelioClim-2 input data were first corrected for the site of the PV system using the same methodology as what was presented in section 2.2.
F1 PV System Monthly AC power for 2004
0 20 40 60 80 100 120 140 160Jan Feb Mar Apr May Jun Jul Aug Sep Oct Nov Dec
Month
AC po
we
r (
k
W
h
)
Measured Model calibration Model prediction Model + Helioclim 2Fig. 2.2: Comparison of the F1 PV system power production predictions using daily measured irradiation and daily HelioClim-2 irradiation inputs.
The monthly percentage deviations for the model alone were within 13 % and within 9 % for the whole period under study (May-Dec 2004). When HelioClim-2 daily inputs are used, the percent deviation increases to within 24 % on a monthly basis and within 22 % for the period under study (May-Dec 2004).
Figure 2.3 shows the RMSE values for the model predictions for each month calculated from daily measured and predicted results. These values typically range between 7 to 16 % and, as expected, increase to 14 to 25 % when HelioClim-2 data are used. Larger error percentages are also obtained for months with lower irradiation values (November and December). This highlights the difficulty of simulating irradiation and PV system performance under low light conditions where additional non-linear effects (spectral effects, increased charge carrier recombination losses) come into play.
RMSE on Power Predictions for 2004
F1 System
0 10 20 30 40 50 60May-04 Jun-04 Jul-04 Aug-04 Sep-04 Oct-04 Nov-04 Dec-04 Year
R M SE ( % ) Model Model + Helioclim2
Fig. 2.3: Monthly RMSE error for the F1 PV system power production predictions using daily measured irradiation (model) and daily HelioClim-2 irradiation inputs (model + HelioClim-2).
Furthermore, the F1 PV system is a roof integrated system using PV modules as tiles (see Fig. 2.4). Performance analysis showed a decrease of the performance ratio (PR) in summer due to a high cell temperature (see Fig. 2.5). As the parametric model was calibrated using winter months (February to April 2004), it was not able to anticipate the low summer performance observed for August and this is reflected in the RMSE value for August.
Fig. 2.5: Performance analysis for the F1 PV system showing high cell temperature in August and its impact on the performance ratio of the system (from PV-Starlet project NNE5-302-2001).
Figure 2.6 compares the daily predictions made for the months of June (a), the month with the lowest RMSE, and November (b), a month with fine model prediction capabilities that were spoiled once HelioClim-2 irradiation inputs with large RMSE are used. This stresses the importance of accurate radiation forecasts for the performance prediction of PV systems.
Daily AC Power from F1 System for November 2004 0 0.5 1 1.5 2 2.5 1 3 5 7 9 11 13 15 17 19 21 23 25 27 29 Day AC P o w e r (kW h ) Measured Model Model + Hc2 (b)
( Daily AC Power from F1 System in June 2004
0 1 2 3 4 5 6 1 3 5 7 9 11 13 15 17 19 21 23 25 27 29 Day AC P o w e r ( k W h ) Measured Model Model + Hc2 (a)
Fig. 2.6: Comparison of daily measured data with daily predictions made for the months of June (a) and November (b).
2.3
PV Performance Prediction from Monthly Data
The analysis presented in the previous section was based on daily data. However, the majority of the data contained within the IEA PVPS Task 2 Performance Database is provided in a monthly format. Moreover, ambient and module temperature are not always available. This section focuses on the assessment of power predictions based on monthly irradiation data only. The polynomial model is used this time with monthly data from the Munich Trade Fair Center PV system contained in the IEA PVPS Task 2 Performance Database along with corresponding site-corrected solar irradiation values from the HelioClim-2 database. As monthly data represent a smaller dataset than daily data, the calibration period for this analysis varied between 1 to 3 years using 2000-02 data. Year 2004 was used to test the predictions.
Figure 2.7 compares the measured monthly AC power production data with the values obtained from the polynomial model that has been calibrated for periods of one year using 2002 data, two years using 2001-02 data, and three years using 2000-02 data. While intuitively we are led to think that using a longer period for calibration would lead to a model that yields better results, it is not the case here. The monthly percentage deviations for all three models were within 11 % and the yearly RMSE was within 6-10 %. Year 2001 must have been an untypical year for the performance of this system while year 2002 must have been close to that of 2004.
2004 Monthly Power Prediction for MTFC
0 1000 2000 3000 4000 5000
Jan Feb Mar Apr May Jun Jul Aug Sep Oct Nov Dec
Month AC P o w e r ( k W h ) Measured Model 1 yr Model 2 yr Model 3 yr
Fig. 2.7: Comparison of the Munich Trade Fair Centre PV system power production predictions for polynomial models calibrated under different time periods.
With this result in mind, the power production of the system was modeled using the polynomial model calibrated with one year of data along with monthly summed HelioClim-2 irradiation data available for the site. In agreement with the good correspondence between the HelioClim-2 data and the measured data observed for Figure 1.16, Figure 2.8 shows that the HelioClim-2 irradiation data does not introduce a large error in this case.
2004 Monthly Power Prediction for MTFC using
Helioclim 2 input
0 1000 2000 3000 4000 5000Jan Feb Mar Apr May Jun Jul Aug Sep Oct Nov Dec Month AC P o w e r (k W h ) Measured Model 1 Model 1 + Hc2
Fig. 2.8: Comparison of the Munich Trade Fair Centre (MTFC) PV system power production predictions using monthly measured irradiation and monthly HelioClim-2 irradiation inputs.
On a monthly basis, the percentage deviations were within 11 % for the model predictions made from measured irradiation input data and within 15 % the model predictions made from HelioClim-2 irradiation input. The RMSE values for the year under study was 6 % and 7 % for the model predictions using measured and Heliclim2 irradiation input.
Fig. 2.9: General overview of the Munich Trade Fair Centre roof integrated PV system (Courtesy of Solarenergieförderverein Bayern e.V.).
2.4
Comments and Further Steps
As the interest of PV stakeholders in PV system performance prediction grows for an increasing number of applications, it becomes relevant to investigate the type of support the Performance Database of PVPS Task 2 can provide. Selected systems from the Performance database were used as case studies to illustrate the confidence that can be given to a simple approach predicting the output of PV systems requiring no other input data than what is already available within the Performance and the HelioClim-2 databases.
The first results showed that a simple polynomial model calibrated for the selected system and daily input data from the HelioClim-2 irradiation database could yield monthly predictions within 24 % (22 % on an annual basis) of the measured PV system output with monthly RMSE values ranging from 14 % to 55 % (17 % for the annual value). As the vast majority of the datasets from the Task 2 database contain data compiled on a monthly basis, a similar study was conducted on another system using monthly input data. The results yielded monthly predictions within 15 % of the measured monthly output and within 7 % for the yearly output.
The analysis stressed the importance of the accuracy of the irradiation input data and revealed the limitations of the simple polynomial model and the HelioClim-2 irradiation database for months with low insolation values. Although the approach taken yields interesting results given its simplicity, it may not meet the needs of sophisticated stakeholders who require PV system output predictions to fall within 5 % of the actual output. Further work would be required to assess the potential of the Task 2 Performance Database for performance predictions on well characterized PV systems.
Conclusion
Delivering secure and reliable power while managing uncertainties related to fluctuations and intermittency of the energy source as well as to the full energy conversion process is one of the major challenges faced by the PV industry today. Meeting this challenge requires accurate and timely information on the present and future availability of the solar resource as well as other data on parameters affecting the energy yield of PV systems. Remote sensing data from satellites offer an attractive and competitive approach to deliver global data sets of energy resources. Large areas of the earth’s surface can be monitored at high spatial and temporal resolutions using uniform and consistent methodologies. As such data will become more and more widely used to evaluate the potential of a site or to predict the performance of an installation for different purposes such as maintenance or energy optimization, it seemed important to quantify their related accuracy and to develop procedures able to give some reliable interval of confidence.
As a first step, values of irradiation from the HelioClim-2 database were processed and compared to field data contained in the IEA PVPS Task 2 Performance Database. The first results have shown that an RMSE of less than 10 % on yearly values was reachable if the HelioClim-2 data could be corrected from measured data on the same site. During spring and summertime an RMSE of less than 10 % on monthly values has been achieved while 20 % was achieved during winter time with corrected values.
In a second stage, selected systems from the Performance database were used as case studies to illustrate the confidence that can be given to a simple approach predicting the output of PV systems which requires no other input data than temperature and irradiation from the HelioClim-2 irradiation database. The first results showed that a simple polynomial model calibrated for the selected system and monthly input data from the HelioClim-2 irradiation database could yield monthly predictions within 15 % of the measured output and within 7 % of the yearly output.
References
King DL, Boysen WE and Kratochvil JA, (2002) Analysis of Factors Influencing the Annual
Energy Production of Photovoltaic Systems. Proc. 29th IEEE PV Specialists Conference, 19-24
May 2002, New Orleans, USA.
King DL, Kratochvil JA, Boyson WE and Bower WI (1998) Field experience with a new
performance characterization procedure for photovoltaic arrays. Proc. 2nd World conference and
exhibition on photovoltaic solar energy conversion, 6-10 July 1998, Vienna, Austria.
Whitaker C, Townsend TU, Newmiller JD, King DL, Boyson WE, Kratochvil JA, Collier DE, Osborn DE (1997) Application and Validation of a New PV Performance Characterization
Method. Proc. 26th IEEE PV Specialist Conference, Anaheim, USA.
Kenny RP, Dunlop ED, Ossenbrink HA, Müllejans H, (2005) A Practical Method for the Energy
Rating of c-Si Photovoltaic Modules Based on Standard Tests. Prog. in Photovolt. Res. Appl.
2006; 14:155-166.
Minister of Natural Resources Canada (2003). RETScreen Engineering & Cases Textbook. Varennes, Canada.
Eicker U, Pietruschka D, Schumacher J, Fernandes JdC, Feldmann T, Bollin E (2005) Improving
the Energy Yield of PV Power Plants through Internet Based Simulation Monitoring and
APPENDIX A: Examples of Ongoing Activities in the Field of
Photovoltaic Performance Prediction
The geographical dependency and distributed nature of solar electricity generation has lead to the development of different tools able to tackle questions which, in their respective domain, require specific location dependent answers on the performance of PV systems.
Two examples are given below to highlight the type of on-going activities in the field of PV performance prediction considering the whole problem through different aspects: a global analysis approach (PVGIS), and a performance check and error detection service (PVSAT-2).
A. 1 PVGIS
Since 2002, the Photovoltaic Geographic Information System (PVGIS) has been developed at the Joint Research Centre of The European Commission. This tools combines the long-term expertise from research laboratory, monitoring and testing with geographical knowledge.
Support systems, such as PVGIS, contribute to collecting and improving knowledge of solar energy technology that is needed in decision making. It is designed to show the geographical diversity of the solar energy resource and the aspects of distributed electricity generation from solar energy systems at the continental level. As a research tool, it improves understanding of the performance of PV technology in regions of Europe.
The results show that proper appraisal of the technology has to take into consideration national and regional particularities. The current system contains only the basic information and more detailed analyses would need data with higher spatial and temporal resolution. The implementation of the HelioClim1 data (containing time series for the period 1985-2005) allows for the analysis of the variability of the solar resource by means of probabilistic approach. PVGIS brings a beneficial added value into existing systems with enhanced visualisation and integration of geographical and socioeconomic aspects. The web interface provides an access to the basic data, maps and tools to decision makers, professionals from manufacturing industry, installation and maintenance companies, and the PV owner as well as the general public.
PVGIS consists of specificly developed programmes and two databases integrated into the GIS software GRASS (http://grass.itc.it). Public access to the subset of data and tools is provided via internet using a PHP written interface:
- a Database of the European subcontinent was created from solar radiation data collected at the meteorological ground stations,
- a Database of the Mediterranean basin, Africa and southwest Asia developed in collaboration with École des Mines de Paris at Sophia Antipolis (FR) where the solar radiation was derived from the Meteosat satellite.
Nevertheless, the database from the Meteosat satellite is not fully operational regime, therefore the analyses presented relate mainly to the use of the European database where the evaluation of the solar irradiation is interpolated from ground measurements.
Some examples are presented here showing how PVGIS can be used to tackle issues on performance of PV systems such as:
- How much electricity does a PV system generate in different regions?
- How much electricity can be produced by various technology options?
- What is the theoretical potential, and how does it compare to the present use of land? - What is the technical potential that could be exploited in the coming years?
- What are the PV generation costs, and how are they modulated by technical parameters such as system efficiency and lifetime?
- How does the PV technology fit to the needs of the present electricity generation and consumption patterns?
Estimation of PV electricity generation potential
Inclining the PV modules from the horizontal position towards south (in the northern hemisphere) increases yearly energy yield significantly. The optimal angle of the PV module is determined by geographical latitude, and the location’s share of diffuse to global irradiation. In locations with strong terrain-shadowing, the optimum orientation of the PV modules might be slightly offset towards east or west.
Fig. A.1: Optimum tilt angle of PV modules, oriented south to maximize the yearly energy yield.
Fig. A.2: Annual sum of global irradiation received by optimally-tilted PV array (kWh/m2) and the annual PV electricity generation from a typical 1 kW crystalline silicon system (kWh/kW).
This application calculates the yearly potential electricity generation E [kWh] of a PV configuration with defined modules inclination and orientation using a formula:
E = 365 Pk PR Hh,I
where Pk (kW) is the peak power installed, PR is the system performance ratio (typical value for
roof mounted system with modules from mono- or polycrystalline silicon is 0.75) and Hh,i is the
monthly or yearly average of daily global irradiation on the horizontal or inclined surface. The calculator can suggest the optimum inclination/orientation of the PV modules to harvest maximum electricity within a year.
PV electricity potential
Fig. A.3: Module area (m2) per capita needed to satisfy 1 % of the national electricity consumption. For comparison, the dashed line represents a surface of a TV satellite dish with diameter 0.85 m.
PV electricity costs
As PV systems proliferate, the decision on whether to install a new system will increasingly be made on purely economic grounds and grid-connected systems have to face competition from other electricity generation means. For small domestic systems normally installed on roof tops and owned by individual persons, the comparison should be made on the basis of the end user electricity price. For larger power systems, normally with central installations and multiple owners, the comparison must be based on market pricing and cost. Since the PV generation cannot supply base load capacity, the costs in terms of the so-called peak load can be considered.
Fig. A.4: PV electricity costs for large power system and small domestic system sizes.
Both case studies assumed PV module lifetime of 20 years with overall system performance ratio of 0.75. These are two of the determining factors in the cost calculation of solar electricity calculation:
- Extending the expected lifetime to 30 years would consist in a monthly system cost reduction of 23 %. Evidence exists that such a target is realistic.
- Increasing the today observed values to get closer to the theoretical performance ratio limits (0.88 to 0.95).
Summary
Support systems such as PVGIS look at the notion of performance prediction of PV systems at a global level giving information on the PV potential with a beneficial added value due to the integration of geographical and socio-economic aspects. The kind of results delivered can be used as the first step of a decision making process at a local and regional level. Then more detailed tools, especially regarding the consideration of the system operation, are necessary to enter the design phase of a project.
A.2 PVSAT 2
A large number of small grid connected PV systems is in operation in Europe today and a strong increase in installed capacities is expected for the coming years. Generally these PV systems range in power from 1 to 10 kW and do not include any long-term monitoring mechanism. As most system operators are not PV specialists, system faults or decreasing performance will not be recognized and the individual plant owner will face financial losses. Considering the new existing feed-in tariffs in some European countries, the cost argument becomes more and more important for plant owner as well as for the PV industry. Therefore there is a need for methods which allow for a cheap and reliable performance check of the power production of grid-connected PV systems.
Overview of the PVSAT 2 service
PVSAT 2 aims at assembling a fully automated service for both performance check and error detection. A daily surveillance should detect malfunctions, e.g. drop out of single module strings, shading by surroundings objects or inverter failures that lead to energy losses on a daily basis. To determine the expected energy yield of a PV system, satellite data and a small number of ground based irradiance measurements give information about the solar resource at the site of the PV system. The satellite data are used because local measurements by pyranometers are costly and need periodic maintenance.
Fig. A.5: PVSAT-2 surveillance procedure.
First, surface irradiance is derived from the MSG (Meteosat Second Generation) satellite with an improved version of the Heliosat method. For MSG, the pixel size refers to a resolution of 2 km x 2 km at the ground in Europe. The irradiance values are input for a PV simulation. According to the plant description (orientation, tilt, type and configuration of the modules, type of inverter), the PV simulation determines the expected daily energy yield. The central decision support tool carries out the daily performance check. It compares the expected and measured hourly and daily energy yields for each PV system and decides on the occurrence of a failure. In the case of failure, a footprint algorithm and a failure detection routine are processed and, if a significant malfunction is identified, the operator of the PV system is informed automatically.
Experience from the PVSAT
The accuracy of the monthly sums of global irradiation gained from the Heliosat procedure is shown in Fig. A.6. Both values for the horizontal and tilted module plane are shown. The errors for the module plane have a maximum magnitude of about 10 kWh/m² (i.e., about 10 % in summer and 30 % in winter). The errors in the radiation sum are almost proportionally transferred to errors in the estimated monthly yields of the systems (Fig. A.6).
Fig. A.6: Deviations of the monthly sums of global irradiation (horizontal and for a tilted plane of the PV array) as calculated by the Heliosat procedure for 2001 and for the respective measured PV systems data in Magdeburg (see Fig. A.7).
-30 -20 -10 0 10 20 30 ma y ju n jul au g se p oc t nov dec jan feb ma r ap r E _AC( P VS AT) E _AC( m ea s. ) [k W h] s1 s2
Fig. A.7: Deviations of the simulated and calculated monthly energy gain from the two PV systems in Magdeburg – labelled as s1 and s2.
The errors of the estimated irradiation sum for the summer month could be partly traced back to problems due to the localization of the satellite pixel and the inherent inaccuracy of the satellite method due to the comparison of the spatially averaged satellite data with point data from the ground measurements. For the winter months, the analysis revealed the inaccurate performance of models that were used to recalculate the horizontal plane data to the inclined plane of the PV array. Especially the division of the global irradiance data into its direct and diffuse components causes problems.
Combining satellite data with ground measurements
An additional measure to improve the accuracy of the information on irradiance is the combination of the satellite data with a small amount of ground data. For this purpose the geostatistical method kriging-of-the-differences is applied (see e.g. Beyer and Wald, 1996). To validate this procedure, tests using data from the meteorological services of Germany, Ireland and Sweden were performed (Table A.1).
Table A.1: Configuration of the ground station networks used for the test of the of the kriging-of-differences procedure to improve the information on the irradiance.
Data set
No. of
stations
Average
distance
[km]
Ireland 7
120
Sweden 10
160
Germany
32 67
The results of a cross validation for monthly data from a yearly set are given in Fig. A.8. It is remarkable that the bias can be almost completely suppressed. The root mean square error may also be reduced, but only slightly.
As important by-product of the kriging procedure, an estimate of the uncertainty of the modelled irradiance data at each site is offered. These uncertainties may now be taken into account within the error detection routine. This knowledge is a necessary prerequisite for determining the significance of deviations between the expected and the real energy yield and therefore, for the exact determination of malfunction that may have occurred. The next section gives a presentation of the error detection and decision support routine of PVSAT-2.
0 5 10 15 20
Ireland Sweden Germany
rR
M
SE [
%
]
Heliosat KoD -4 -2 0 2 4Ireland Sweden Germany
rM
B
E
[%
]
Helios at KoDFig. A.8: Results from the application of the kriging-of-differences procedure to the quality of the modelled global irradiance. The monthly relative mean bias (rMBE) and relative root mean square errors (rRMSE) for the raw Heliosat procedure and the Heliosat plus kriging procedure are given for three ground station networks (Table A.1).
Decision support system
The footprint algorithm is based on the reliable identification of the occurrence of malfunctions. For this purpose the monitored AC power Pmon is compared with the respective simulated power
Psim. Taking into account the uncertainties of the simulated values, significant deviations of
measured and simulated power are marked. The aim of the footprint algorithm is to identify typical patterns for the occurrence of the error marks depending on the type of malfunction. Error types as e.g. 'string error', 'MPP tracking error' or 'snow coverage' may be considered.
The footprint method works in two steps. The first step contains a pre-sorting algorithm that prepares the calculated and the monitored yields to take the errors from the satellite data into account. The second step is the identification of the error source.
In general, normalised signals are considered: Psim/Pmon = simulated power/monitored power;
Pmon/Pinst = monitored power/installed power.
Since the individual calculated yield values with hourly time resolution are expected to be provided with large errors, the signals Psim/Pmon will be pre-sorted as interval averages P* in
different domains as described below. Interval average P* shows in general a smaller variance than the variances of the individual signals. Thus, P* exhibits more stability and allows an improved detection of errors.
Summary
PVSAT 2 looks at the performance prediction of PV systems with a monitoring approach in order to ensure the user of the proper operation of the systems. Such a process is fully appropriate for small distributed systems. The extension to big power stations has to be elaborated and will need to increase the accuracy of the evaluation of the solar resource through satellite images.
APPENDIX B: The Heliosat 2 Method
The principle of the Heliosat 2 solar radiation estimation method is that a difference in global radiation perceived by the sensor aboard the satellite is due only to a change in apparent albedo, which is itself due to an increase in the radiation emitted by the atmosphere toward the sensor. Heliosat 2 is based on the fundamentals of its predecessor, the Heliosat method, that is, computation of a cloud index n from apparent albedo (ρa), ground albedo (ρg) and albedo from
very bright clouds (ρn). The modification included in the current version of Heliosat has improved
such features as image calibration for any change in the satellite sensor; the adoption of a clear-sky radiation model; computation of basic albedo (ρa, ρg and ρn); use of the clear-sky index and
the relationship between the cloud index n and the clear-sky index.
In Heliosat 2, global horizontal irradiance, G, is estimated (1) using the clear sky index, KC , and
global horizontal irradiance for clear skies, GC, using the ratio:
C C
G
G
K
=
(1)where GC is calculated using the clear sky model accepted in the most recent version of the
European Solar Radiation Atlas. Index KC is related to cloud index, n, by the following parametric
expression:
2
.
0
−
<
n
, KC =1.28
.
0
2
.
0
≤
<
−
n
, KC = 1−n1
.
1
8
.
0
≤ n
<
, KC =2.0667−3.6667n+1.6667n21
.
1
≥
n
, KC =0.05 (2)This study on uncertainty concentrates in the linear range, , because most cloud situations produce a n value in it. The cloud cover index in each pixel in the image, n, is estimated using apparent albedo ρ
8
.
0
2
.
0
≤
<
−
n
a, the albedo for the very bright clouds, ρn, and the ground
reference albedo, ρg, expressed as:
g n g n
ρ
ρ
ρ
ρ
α − − = (3)The albedo necessary are evaluated using radiance received by the satellite sensor (L) and certain outside information, such as the calibration constant of the sensor itself (CC); total irradiance the satellite sensor can detect on the visible channel ( ); the Linke turbidity index (T
met
I
0L) and the geographic variables that define the pixel of interest (latitude, longitude and
altitude). This information is used to estimate the atmospheric contribution by its reflectance (Ratm) and the transmittance (T) is calculated, keeping in mind that it appears both in the path of
solar radiation from the Sun to the Earth and from the Earth to the satellite sensor. Attenuation in this second path is written as Tsat, and is estimated from the same expressions as T, but applied
at the elevation angle of the satellite with regard to the observer, θsat.
The ground albedo is the contribution to apparent albedo that is attributed exclusively to the Earth’s surface. Its value is selected from a series of apparent albedo following both the restrictions for acceptable threshold and for the maximum permissible change from one image to the next. Several strategies are possible to compute ρg.
0 W/m2 500 W/m2 1000 W/m2 0 W/m2 500 W/m2 1000 W/m2
clear sky model:
Gclearsky (turbidity,sun elevation) global irradiance: clearsky G k G= *
cloud index images:
ground cloud ground n ρ ρ ρ ρ − − =
clear sky index: transmission through the
atmosphere n n f G G k clearsky − ≈ = = ( ) 1 *
Fig. B.1: Sketch of the Heliosat scheme to derive the global irradiance from METEOSAT images as described by Hammer et al. (2003).
New procedures like Heliosat3 will use the Meteosat Second Generation with 3 km spectrally resolved channels and additionally the broad band visible channel with 1 km nominal resolution.