HAL Id: hal-01921334
https://hal.archives-ouvertes.fr/hal-01921334
Submitted on 26 Nov 2018
HAL is a multi-disciplinary open access
archive for the deposit and dissemination of sci-entific research documents, whether they are pub-lished or not. The documents may come from teaching and research institutions in France or abroad, or from public or private research centers.
L’archive ouverte pluridisciplinaire HAL, est destinée au dépôt et à la diffusion de documents scientifiques de niveau recherche, publiés ou non, émanant des établissements d’enseignement et de recherche français ou étrangers, des laboratoires publics ou privés.
Energy and material flow modelling of additive
manufacturing processes
Mazyar Yosofi, Olivier Kerbrat, Pascal Mognol
To cite this version:
Mazyar Yosofi, Olivier Kerbrat, Pascal Mognol. Energy and material flow modelling of additive manufacturing processes. Virtual and Physical Prototyping, Taylor & Francis, 2018, 13 (2), pp.83 -96. �10.1080/17452759.2017.1418900�. �hal-01921334�
Energy and material flow modelling of additive manufacturing
processes
Mazyar Yosofi*, Olivier Kerbrat, Pascal Mognol
Institut de recherche en génie civil et mécanique, Ecole normale supérieure de Rennes, Université Bretagne-Loire, Avenue Robert Schuman 35170 Bruz, France
M. Yosofi is with the Institut de recherche en génie civil et mécanique, Ecole normale supérieure de Rennes, Université Bretagne-Loire, Avenue Robert Schuman 35170 Bruz, France (phone: +330290091182; e-mail: [email protected]).
O. Kerbrat is with the the Institut de recherche en génie civil et mécanique, Ecole normale supérieure de Rennes, Université Bretagne-Loire, Avenue Robert Schuman 35170 Bruz, France (phone: +330299055275; e-mail: [email protected]).
P. Mognol is with the the Institut de recherche en génie civil et mécanique, Ecole normale supérieure de Rennes, Université Bretagne-Loire, Avenue Robert Schuman 35170 Bruz, France (+330299059301; e-mail: [email protected]).
Energy and material flow modelling of additive manufacturing
processes
Additive manufacturing processes allow fabrication of 3 dimensional complex parts. Due to the exact amount of material used during the manufacturing step, these new manufacturing processes offer great opportunities for sustainable manufacturing. However, existing studies on these processes focus mainly on energy consumption and information about resources consumptions and waste flows are still lacking. This study aims to quantify with accuracy inventory data of additive manufacturing processes during the manufacturing step of the life-cycle of a products. In order to accurately assess the environmental impact of a product, a generic method for acquisitions and characterizations of inventory data for parts made by additive manufacturing processes is proposed. This methodology not only focuses on the electrical energy consumption but also on material consumption. This paper also describes the development of a parametric process model, which provide to an operator, an accurate estimations of the environmental performances of fused deposition modeling process.
Keywords: Additive manufacturing; life-cycle inventory; fused deposition modeling; energy and resource efficiency; environmental sustainability
1. Introduction
The life-cycle assessment of products is increasingly common today in the development activities and industrialization of products (Wohlers 2015). This is indeed a major strategic issue for manufacturing industries. In this way, the knowledge of the level of environmental performance of manufacturing processes is a necessary step before considering action for improvement.
This knowledge is essentially based on the inventory data of manufacturing processes contained on databases where the quantification of consumption and emissions to air, water and soil are informed. These data are process-dependent and are insufficiently informed today for innovative processes (such as additive manufacturing technologies). Indeed, these “3D-printing” processes could be seen as mature from a technical point of view (Lee et al. 2017; Lee et al. 2016) but the environmental analysis of the processes are still lacking.
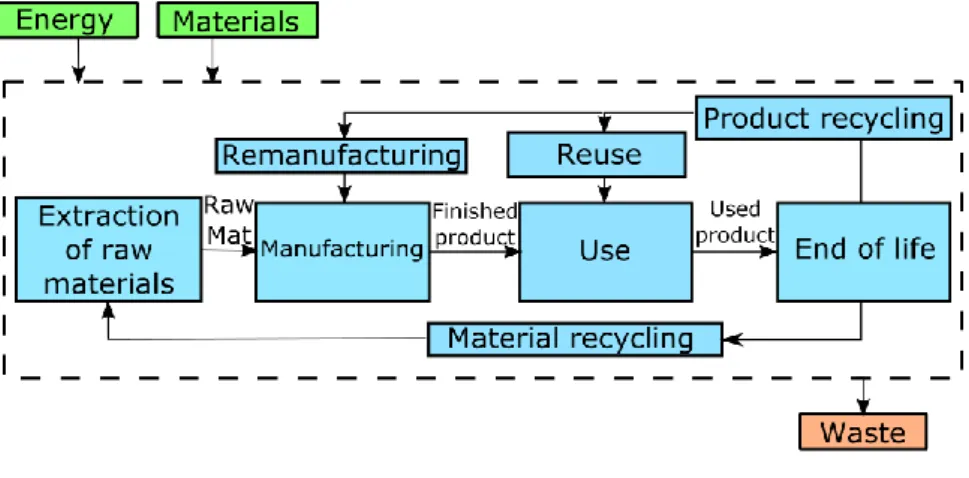
In this paper, the research focus on the acquisition of the inventory data of Additive Manufacturing (AM) processes. Depending on the AM process studied, there are sometimes no details about other resources consumptions such as material used during the manufacturing step, process emissions or waste flows. Indeed, existing studies on AM processes are mainly focused on energy consumption. Nowadays, Life-Cycle Analyses (LCA) experts realize LCA of parts made by additive manufacturing processes even if the flows during the manufacturing step are not well informed. However, in order to be the most realistic as possible, an LCA should take into account all the input and output flows during the life-cycle of products (Figure 1).
Figure 1. Life-cycle of a product
Because of those reasons, it seems important to evaluate with accuracy the inventory data during the manufacturing step considering all the input and output flows. In this paper, the considered flows during the manufacturing step are the electrical energy consumption, primary material and support material consumption (waste material). Process emissions during the manufacturing step, environmental impact of all the provisions and facilities use during the recycling of waste materials during the manufacturing step and raw material transformation are not taken into account. Thus, this paper focus on the development of a generic method to assess the life cycle inventory of additive manufacturing processes during the fabrication step in order to take into account all the inputs and outputs flows.
2. State of the art
Nowadays, AM techniques have been applied in various domains such as biomedical, aerospace and automotive industry. The capacity of AM to build parts directly from a Computer Aided Design (CAD) model with only one manufacturing step makes it an excellent alternative compared to Conventional Manufacturing (CM) processes such as machining, thermoforming and injection molding (Bourell et al. 2009). Indeed, one of the many advantages of AM process is the possibility to manufacture products with complex geometry that would be difficult or impossible with CM processes. Some AM processes
have also the capability to repair and remanufacture tooling in order to eliminating the supply chain operation of materials. Those new manufacturing processes are generally more environmentally friendly because they only use the exact amount of material to build product. That makes AM technologies good for reducing the life-cycle material mass and energy consumed. Other environmental advantages can be found in the reduction of extracting raw materials and its transportation.
The first study on the environmental analysis of AM processes were performed by Luo et al. (1999). Their works focused on the energy consumption of three AM processes: vat photopolymerization, powder bed fusion and material extrusion. The authors reported the processes energy consumption in terms of Specific Energy Consumption (SEC). The concept of SEC was used to facilitate comparisons between manufacturing processes and its units are kWh/kg. These studies took into account the energy consumption of the manufacturing process by considering only the machine. Indeed, all the parameters that can modify the SEC like the shape or the position of the part were not considering. Electrical energy comparison between machines of the same process has been done for one part.
Baumers et al. (2011) explored the SEC of material extrusion and four powder bed fusion processes. They studied the effect of the part geometry and the packing density of the space machine on the electrical energy consumption of these AM processes. They determined that the SEC decreased when multiple parts are manufactured in the same time. In another study, Baumers et al. (2010) compared the energy consumption of selective laser melting (SLM) and electron beam melting (EBM) processes for two different materials, respectively stainless steel and titanium, with a focus on manufacturing stage. In their studies, EBM process had lower energy consumption due to differences in material and layer thickness.
Mognol et al. (2006) analyzed the energy consumption of three AM processes: material jetting (Thermojet), material extrusion (FDM 3000) and a powder bed fusion (EOS M250) process. In this case, the authors studied the influence of the part orientation on the build platform. Thus, it was possible to save 43 % of electrical energy for the EOS, 45 % for the Thermojet and 61 % for the FDM 3000 with a good set of parameters. They also determined that the heating system of each process is the largest energy consumer. The work realized by Baumers et al. and Mognol. et al bring to light the importance of the consideration of the manufactured part in the electrical energy consumption analysis of AM processes.
Junk and Côté (2012) compared the energy consumption of material extrusion and material jetting. Compared to some authors, they did not study the SEC only during the stage of fabrication but they considered the entire energy consumption cycle. Indeed, they included the preparation and the post-processing steps to calculate the SEC. They also studied the influence of the position of one part on the build platform and on the energy variation (Junk and Côté 2013). They found that the energy consumption of a manufactured part is lower when the part is built near the machine zero point.
Sreenivasan and Bourell (2009) studied the energy consumption of a powder bed fusion process during the fabrication stage. Then they translate the energy measured into environmental impact. In a second study, Sreenivasan et al. (2010) worked on a way to reduce the energy consumption in SLS of porous non-polymeric materials. The method consisted of mixing a binder with material, to create an SLS part and then to remove the connected porosity. Finally the part was densified by chemical deposition within the pore network.
Balogun et al. (2014) compared the energy consumption of three material extrusion machines with different hardware. They noted that the energy required for the manufacturing step changes for the three machines.
The authors mentioned above studied exclusively the energy consumption of AM processes. There are also available studies of multiple processes comparison.
Yoon et al. (2014) compared the SEC of a same part build with AM (material extrusion) and CM (machining and injection molding) processes. They show that for one part, the SEC of AM process is lower than CM processes for fifteen parts, the SEC of CM processes are a hundred times lower than AM processes.
Morrow et al. (2007) compared an AM process (Direct Metal Deposition, DMD) with machining. They studied for both processes the electrical energy consumption for a mold insert and a mirror. Their work revealed that the energy consumption between DMD and machining is influenced by the solid-to-cavity volume ratio. At high ratios, the Computer Numerical Control (CNC) machining pathway minimizes energy consumption and emission while at low ratios DMD pathway minimizes energy consumption and emission. Telenko and Seepersad (2012) studied the comparison of energy consumption between SLS and injection molding of nylon parts. They concluded that manufacturers can save energy using SLS process for parts with small production volume. For the part they studied, the volume production at which SLS and injection molding consumed equivalent amounts of energy ranged from approximately 150 to 300 parts. Other studies can be found in (Burkhart and Aurich 2015; Huang et al. 2015; Wilson et al. 2014; Wittbrodt et al. 2013).
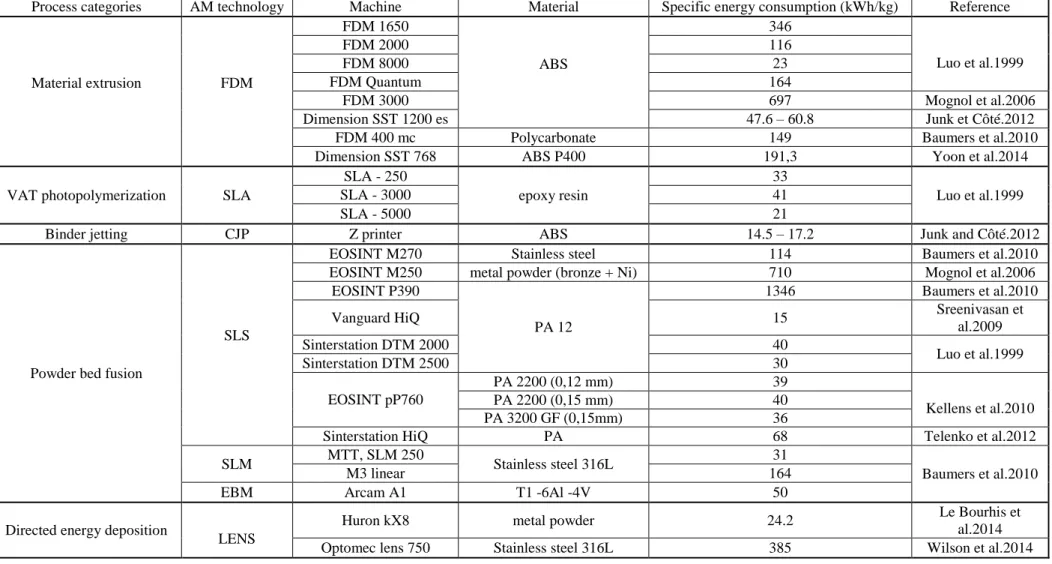
Based on this literature review, Table 1 does a comparative review of the different SEC. In this table, the large difference between the values, even for similar machines with the same technology, cannot lead to a conclusion on what technology is best from an
environmental point of view. In this table, five technologies have been studied and shows the electrical energy consumption due to the manufacturing phase of each process. It is difficult to know which machine has the lower environmental impact, considering that these machines may have different set of parameters during the manufacturing of parts, the material used is different and most importantly, the parts are not the same between studies.
A lot of articles focus mainly on the energy consumption during the manufacturing step. But the SEC is not enough to predict the environmental impact caused by processes. Some data such as resource consumption, emissions, waste flows or recycling are still lacking. For some years, the authors have tended to a more global vision of environmental impact. Meteyer et al. (2014) created a binder jetting process model to predict the electrical and material consumption during a manufacturing process.
Le Bourhis et al. (2014) made a predictive model for the environmental assessment of a laser cladding process. Besides the electric consumption, they took into account the atomization of the raw material, fluid and material consumption and the recycling of lost powder.
Kellens et al. (2012a) used the UPLCI methodology to study the environmental impact of two powder bed fusion processes. This methodology allows an accurate environmental assessment for manufacturing processes (Kellens et al. 2012b).
Characterizations of the environmental performances of AM processes have many times focused on electric energy consumption. However, it is important to take into account all the flows through the process in order to assess the environmental performance of a machine precisely. It is more true for material deposit processes (Fused deposition modeling, Material jetting) and material projection processes (directed energy deposition) where most of the studies are focused on energy consumption. That is why this paper
focuses on the development of a generic method to assess the life cycle inventory of additive manufacturing processes during the fabrication step in order to take into account all the inputs and outputs flows.
Table 1. SEC for various additive manufacturing processe
Process categories AM technology Machine Material Specific energy consumption (kWh/kg) Reference
Material extrusion FDM FDM 1650 ABS 346 Luo et al.1999 FDM 2000 116 FDM 8000 23 FDM Quantum 164 FDM 3000 697 Mognol et al.2006 Dimension SST 1200 es 47.6 – 60.8 Junk et Côté.2012
FDM 400 mc Polycarbonate 149 Baumers et al.2010
Dimension SST 768 ABS P400 191,3 Yoon et al.2014
VAT photopolymerization SLA
SLA - 250 epoxy resin 33 Luo et al.1999 SLA - 3000 41 SLA - 5000 21
Binder jetting CJP Z printer ABS 14.5 – 17.2 Junk and Côté.2012
Powder bed fusion
SLS
EOSINT M270 Stainless steel 114 Baumers et al.2010
EOSINT M250 metal powder (bronze + Ni) 710 Mognol et al.2006 EOSINT P390
PA 12
1346 Baumers et al.2010
Vanguard HiQ 15 Sreenivasan et
al.2009 Sinterstation DTM 2000 40 Luo et al.1999 Sinterstation DTM 2500 30 EOSINT pP760 PA 2200 (0,12 mm) 39 Kellens et al.2010 PA 2200 (0,15 mm) 40 PA 3200 GF (0,15mm) 36
Sinterstation HiQ PA 68 Telenko et al.2012
SLM MTT, SLM 250 Stainless steel 316L 31
Baumers et al.2010
M3 linear 164
EBM Arcam A1 T1 -6Al -4V 50
Directed energy deposition
LENS
Huron kX8 metal powder 24.2 Le Bourhis et
al.2014 Optomec lens 750 Stainless steel 316L 385 Wilson et al.2014
3. Methodology
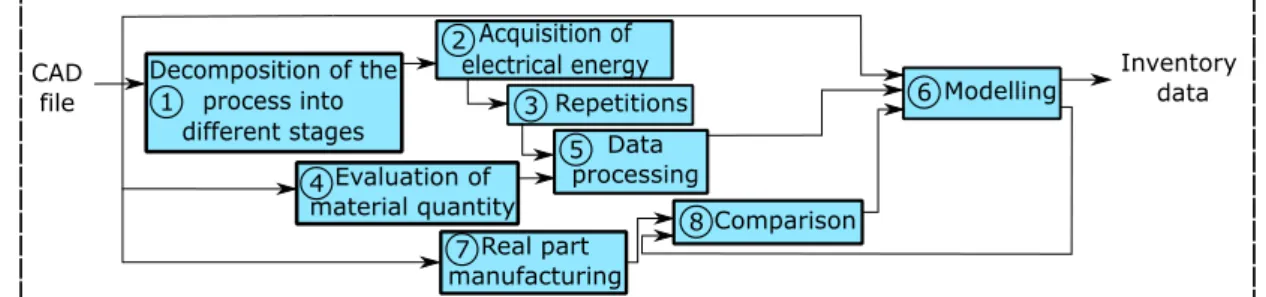
This section presents the methodology developed to assess the environmental performance of AM processes. This methodology is divided into several major steps. Firstly, the manufacturing process is decomposed into different stages, including the CAD file preparation, the heating stage, the forming stage and the finishing process. Secondly, the electrical energy is measured for each stage of the manufacturing process. Thirdly, the electrical measurement is performed many times to have reliable data. Fourthly, the material and support quantity of the part are evaluated mathematically. Fifthly, data processing. Sixthly, all these acquired and calculated data are used to create a predictive model of the inventory data for any part geometry. Finally, in step 7 and 8, comparison between the estimated and measured inventory data for different parts is conducted. Figure 2 shows the methodology used in this paper to characterize the inventory data.
Figure 2. Methodology proposed
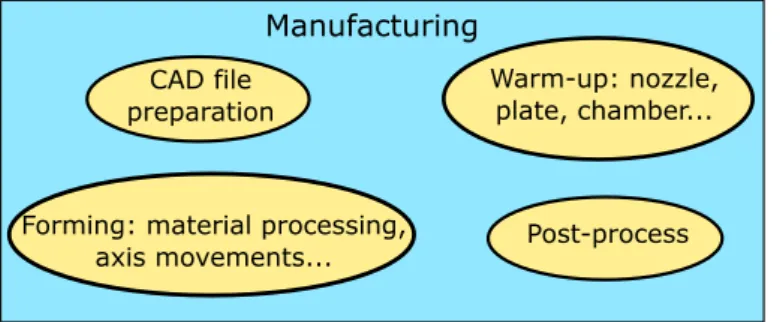
One of the main original point of the methodology in this approach is to combine a global view of the manufacturing process and local analyses of the different production stages. Thus, the manufacturing process is not divided into different features (motors, nozzle, etc.) but into different manufacturing stages (Figure 3).
Figure 3. The four manufacturing stages
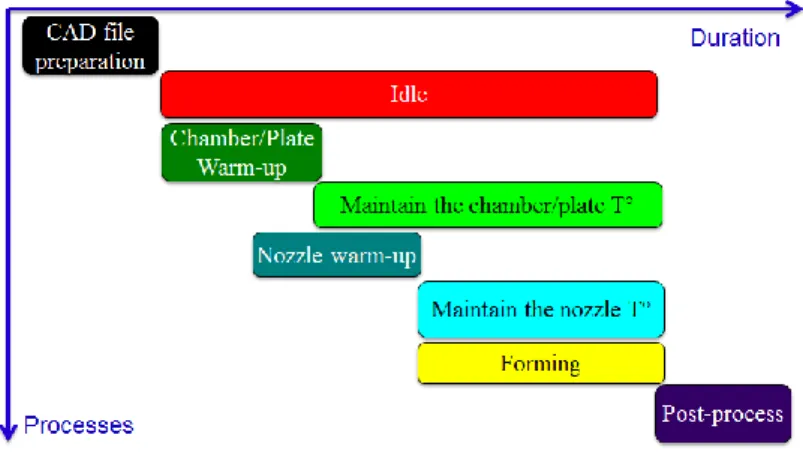
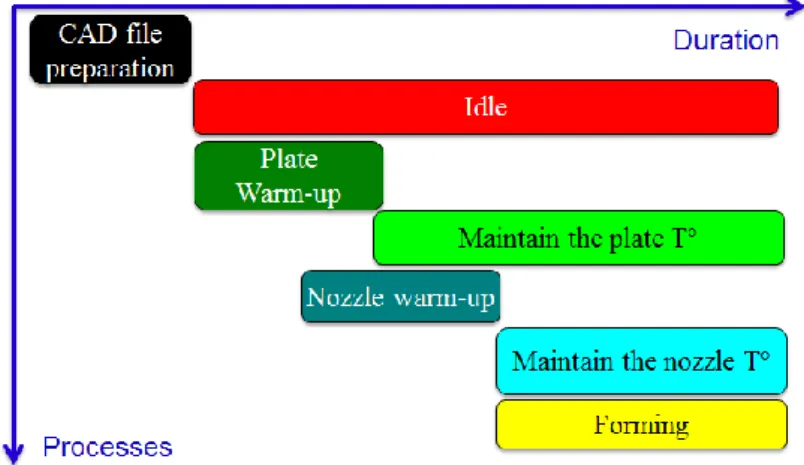
The first stage of the manufacturing process is the CAD file preparation. In this stage, the CAD file is prepared and sends in the machine. The warm-up stage initiates the manufacturing of parts. This second stage can be assimilated to a preparation mode. Indeed, before proceeding with parts fabrication, some components like the chamber, the plate, the nozzles need to be heated for the material processing. If the machine is equipped with a chamber or a plate, generally, it is up first. Then, the nozzles are warmed-up. Their temperatures are then maintained during the forming stage. Finally, when the temperature set points are reached, the forming stage can start to build the part layer by layer. Some parts may require a post-treatment after the build. This last production stage is for most of AM processes done by an external device. For all the AM processes, these four stages are always present regardless of the machine. Thus, this methodology is applicable to any AM machine. In every AM machine, there is also an idle mode. In this mode, the machine is switched on but all the components that participates in the material processing are powered off. Figure 4 shows the different manufacturing stages of AM process in the chronological order as well as the duration of each stage.
Figure 4. Manufacturing stages of AM processes
Once the decomposition of the process into different stages is done, the second step of the methodology is to acquire the electrical energy consumption. The acquisition is made by an external device plugged into the machine for measurement and a computer for saving data. The electrical study for each stage of AM processes is divided into two points. First a power study for all stages is realized and then a time study is conducted. Power study consists in the calculation of an average power of each stage and time study is performed only for warm-up stages because times of other stages are depending on the forming stage. In the third step of the methodology, these measurements are repeated several times in the same initial conditions to have reliable data. In the meantime, information about material and support quantity is calculated with equation (1) and (2) in step 4.
𝑀
𝑝𝑎𝑟𝑡=
𝜌𝑝𝑎𝑟𝑡 .𝑉𝐻𝑙𝑎𝑦𝑒𝑟 .𝐻𝑝𝑎𝑟𝑡𝑙𝑎𝑦𝑒𝑟 (1)
𝑀
𝑠𝑢𝑝𝑝𝑜𝑟𝑡=
𝜌𝑠𝑢𝑝𝑝𝑜𝑟𝑡 .𝑉𝑙𝑎𝑦𝑒𝑟 .𝐻𝑝𝑎𝑟𝑡𝐻𝑙𝑎𝑦𝑒𝑟 (2)
In these two equations, ρpart and ρsupport represent respectively the material density used for the part and the support processing. Vlayer represents the volume of material used per layer, Hpart is the total height of the part and Hlayer is the layer thickness. These two
equations have been taken from previous work made by Meteyer et al. (2014). There are a lot of studies in the literature that give an accurate estimation of the material quantity during the manufacturing step of AM processes. However, we choose this study because of the versatility of these two equations. Indeed, they are applicable for all the AM processes.
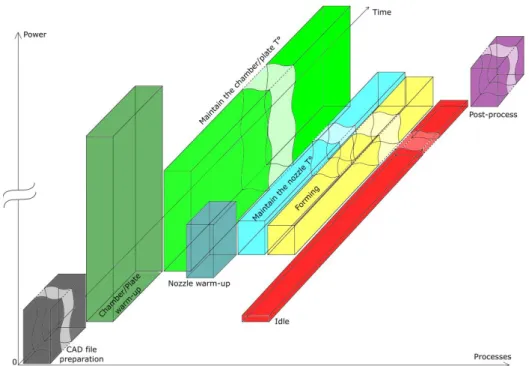
Once steps three and four of the methodology are finished, an average power and duration is associated to each stage as well as an estimated material and support quantity for the part. Figure 5Erreur ! Source du renvoi introuvable. shows an overview of the type of results obtained for the energy study after the data processing (step 5). Power values of all these manufacturing stages can vary because each power level stage will depend on the process and the machine used. Concerning the duration of each stage, only warm-up stages are not part-dependent and well known thanks to measurements. CAD file preparation and post-process stages require a human intervention. The two maintaining temperature stages and the idle stage are depending on the geometry of the manufactured part. Thus, the duration of these stages can vary.
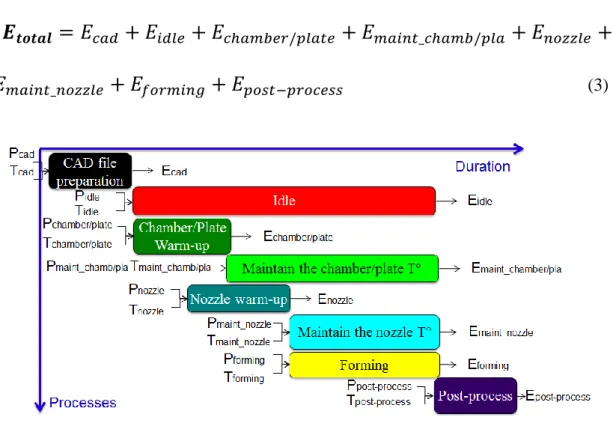
With the power and the duration of each stage known, total electrical energy is calculated in kilowatt hour with equation (3)Erreur ! Source du renvoi introuvable.. Figure 6 shows how electrical energy of each stage is obtained.
𝑬
𝒕𝒐𝒕𝒂𝒍= 𝐸
𝑐𝑎𝑑+ 𝐸
𝑖𝑑𝑙𝑒+ 𝐸
𝑐ℎ𝑎𝑚𝑏𝑒𝑟/𝑝𝑙𝑎𝑡𝑒+ 𝐸
𝑚𝑎𝑖𝑛𝑡_𝑐ℎ𝑎𝑚𝑏/𝑝𝑙𝑎+ 𝐸
𝑛𝑜𝑧𝑧𝑙𝑒+
𝐸
𝑚𝑎𝑖𝑛𝑡_𝑛𝑜𝑧𝑧𝑙𝑒+ 𝐸
𝑓𝑜𝑟𝑚𝑖𝑛𝑔+ 𝐸
𝑝𝑜𝑠𝑡−𝑝𝑟𝑜𝑐𝑒𝑠𝑠 (3)Figure 6. Electrical energy of each stage
Considering also the total amount of material used during the manufacturing of parts, the SEC of the couple part/process is calculated thanks to the equation (4).
𝑆𝐸𝐶 (𝑘𝑊ℎ/𝑘𝑔) =
𝐸𝑡𝑜𝑡𝑎𝑙 (𝑘𝑊ℎ)𝑚𝑎𝑠𝑠 𝑜𝑓 𝑡ℎ𝑒 𝑝𝑎𝑟𝑡 (𝑘𝑔) (4)
Then the sixth step of the methodology is a modelling step. With all these information about the electrical and material consumption during the manufacturing of a part, a predictive model of the inventory data is set up thanks to all the power and stage duration measurements. This model estimates the electrical energy and the material consumption of each manufacturing strategy. The operator has to inform the computational demonstrator about the total manufacturing time and the amount of material for parts and
for support. Information about build duration is given by the preparation software for the parts. Indeed, the software estimates a manufacturing time after placing the part on the virtual machine space of the software and selecting all the manufacturing parameters. From these estimated values of build duration and material quantity, it is possible to compute, before starting a build, the expected specific energy consumption.
Finally, in step 7 and 8 of the methodology, comparison of values between the predictive model and part manufactured are done to check the robustness of the model.
In this paper, the methodology is applied to the Fused Deposition Modeling (FDM) process. Thus, following sections present the methodology on this process.
4. Fused deposition modeling process
FDM is an additive manufacturing process that allows the fabrication of complex three dimensional parts directly from a computer-aided design model. The process was widely used for prototyping but following several years of development, FDM process has evolved from application used in rapid prototyping to functional parts of polymeric objects. This process is based on the extrusion of heated plastic filaments through a nozzle which deposits the melted polymeric material onto a platform to build parts layer by layer. Thermoplastic filament is pushed from a spool into the extruder by motors and rolls. The filament is heated into a semi-liquid state and then is extruded on a build platform. If necessary, support material is pushed from another spool into another extruder and is deposited on the build platform. Different kind of thermoplastic filaments are currently existing, going from the most used Acrylonitrile Butadiene Styrene (ABS) to Polylactic Acid and even Polyamide. Architecture of FDM machines is often the same: a three-axis machine which each axis is controlled by one motor. The nozzle moves thanks to position information directly read in the CNC program. Build chamber can be heated at a certain temperature depending on the machine. Entry level FDM machines have heated bed plate
instead of a heated chamber, some do not have a heated bed. When the part is finished, it is removed from the build plate. If there is a support structure, it can be removed by breaking it away from the part or dove into a chemical solution that separate it from the part without damaging the main part.
5. Results and discussion
5.1 Decomposition of the process into different stages
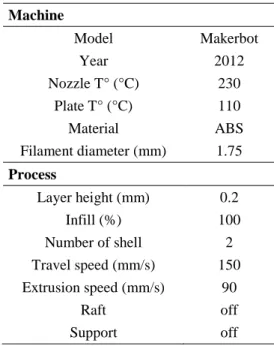
This methodology has been applied to a middle-range open source machine, Makerbot Replicator 2X (Makerbot Industries, 2009). Two stepper motors displace the nozzle. Each axis is controlled by one motor. This machine is also equipped with a movable (up and down) heat bed plate and a heating resistor on the extruder that rise respectively their temperature to 110 °C and 230 °C. Table 2 lists the parameters used in this study.
Machine Model Makerbot Year 2012 Nozzle T° (°C) 230 Plate T° (°C) 110 Material ABS Filament diameter (mm) 1.75 Process Layer height (mm) 0.2 Infill (%) 100 Number of shell 2 Travel speed (mm/s) 150 Extrusion speed (mm/s) 90 Raft off Support off
Table 2. FDM machine parameters
The part used in this study is a parallelepiped of 30 mm x 30 mm x 10 mm made in ABS (Figure 7).
Figure 7. Studied academic parallelepiped
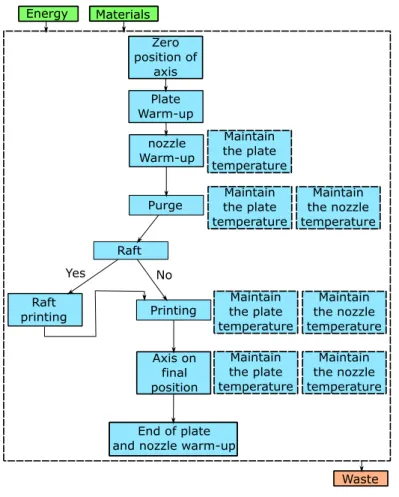
According to FDM machine manufacturers, different machines may have different configuration than that of the Makerbot one. Indeed, the material and the equipment vary from a machine to another. Sometimes, the heat bed plate is replaced by a heat chamber or nothing for low-cost machine. Thus the order of the different stages during the manufacturing steps can change depending on the machine. The different manufacturing stages of the Makerbot replicator 2X are represented inFigure 8. The figure below is a mono material representation. Only one nozzle is heated during the process.
Figure 9represents the different manufacturing stages in the chronological order as well as the duration of each stage. The post-process stage does not appear because the part studied (Figure 7) does not require post-treatment.
Figure 9. Manufacturing stages
After the CAD file is sent to the machine, the warm up stage starts with the rising temperature of the heat bed plate. When the temperature set point of the plate is reached, the nozzle begins to heat. While the nozzle is heating, the warm up of the heat bed plate continue for a few seconds and then its temperature is maintained during the rest of the manufacturing step. After the nozzle reached its temperature set point, the material extrusion starts. During the whole forming stage, the nozzle is maintained to its set point temperature. The environmental performance of the whole process can be now acquired starting by the electrical energy consumption and then the material consumption.
5.2 Acquisition of electrical energy
Electrical energy measurements were performed with a Norma 4000 power measurements three-phase power analyzer. Voltage probe was plugged in power socket in order to measure the voltage value in real time. Current clamp was plugged directly in the stripped supply power cable in power socket exit. This current sensor has an accuracy
of 1 % of reading ± 2 mA and a resolution of ± 1 mA. Hence, energy loss due to the electric transformer was taken into account for the electrical energy study. Instant power is calculated directly by the power meter by multiplying the rms-voltage, rms-current and power factor value. Then all the data were saved and processed to the power meter software on a computer. Figure 10shows the electrical assembly diagram.
Figure 10. Electrical assembly diagram
Figure 11shows a representative power measurement from the Makerbot replicator 2X cycle without the CAD file preparation. The electrical consumption of the CAD file preparation stage was measured separately on the computer where the file is prepared.
Figure 11: Manufacturing cycle for the academic part
The power measurement started while the machine is in standby mode. In this mode, the machine is not printing, however a little amount of electrical power is consumed because of the LCD screen and LEDs. Then, the operator process the cycle start button and the warm up stage begins. The first level of power corresponds to the rising temperature of the heat bed plate. The second level of power corresponds to the nozzle warm up. During this second level, the heat bed plate continues to warm up until is temperature set point is reached. After all the components have finished their warm up stage, the forming stage starts. A lot of oscillations can be observed during this last stage. These oscillations are not generated by the stepper motors. Indeed, values of current and voltage are the same all the time during the forming stage because of the nature of the motors. Oscillations are generated by the maintain of the heat bed plate. Indeed, during its warm up stage, its temperature set point is exceeded by 4 °C. Therefore the machine stops heating bed plate and its temperature decreases under its temperature set point. Then the machine detects that the heat bed plate is below its temperature set point and starts heating it again. Figure 12shows a zoom during the forming stage. This physical phenomenon last only one to two seconds and is repeated during all the forming stage.
Figure 12: Zoom during the forming stage
5.3 Repetitions
Considering the machine studied is open source, the access of each stage can be selected manually. Thus, it was not necessary to launch a build to studying the desire stage. For both studies, all measurements were realized with the same initial condition. The workshop temperature was 20 °C for all the measurements but also the initial temperature of the heat bed plate and the nozzle was the same all the time. All the stage measurements were realized five times. The heat bed plate initial temperature was 20 °C and the power consumption was measured during its warm up to its set point temperature (110 °C). After each measurement, the heat bed plate was cooled down to its initial temperature and the experiment was realized again. The nozzle temperature and the heat bed plate were at 20 °C, the power is measured during the warm up to its temperature set point of 230 °C. For the heat bed plate and the nozzle maintaining temperature stages, measurements were performed during 30 minutes. Variation of power during idle state was very low, thus
measurements were performed only for 15 minutes. Knowing the power consumption for all stages, the average power of the forming stage could be easily calculated. Time study has been realized only for heat bed plate and nozzle warm up. Time of others stages depend on the forming stage duration and the forming stage depends on part geometry. Thus the heat bed plate and nozzle warm up duration were measured from their initial to their temperature set point five times. The duration of other stages is calculated after the print finishing knowing the entire build time and the warm up duration of the heat bed plate and the nozzle.
The most important consuming element for this machine is the heat bed plate with a peak of 138 W during the warm up stage and power ranging from 74 W to 75 W during the maintain of the plate temperature. Power usage during nozzle warm up ranges from 39 W to 40 W, is less than the heat bed plate because of its single heating resistor. During the maintain of the nozzle temperature, power varies from 25 W to 26 W forming stage has a constant power level of approximately 21 W. The average power of each stage for five measurements is listed in Table 3. Average power of each stage
.
Stage Average power (W)
Standard deviation
(W)
CAD file preparation 31.6 0.34
Idle state 4.40 0.28
Plate warm-up 137.39 1.19
Maintain the plate temperature 74.15 0.81
Nozzle warm up 39.57 1.06
Maintain the nozzle temperature 25.14 0.72
Forming stage 21.28 0.59
A breakdown of the duration of the different stages is presented in Table 4. Duration of the different stage
.
Stage Time(s)
CAD file preparation 300
Idle state 2280
Plate warm-up 525
Maintain the plate temperature 1755
Nozzle warm up 150
Maintain the nozzle temperature 1710
Forming stage 1710
Table 4. Duration of the different stage
For this specific part (Figure 7), the entire manufacturing time was 2280 seconds (38 minutes). Duration of plate and nozzle warm up has been measured five times separately of the entire cycle and for the five measures, the time for reaching their temperature set point for both components was the same. Forming stage duration is the same as the duration of the maintaining temperature stage of the nozzle and is calculated by subtracting the total warm up stage from the entire cycle duration.
5.4 Evaluation of material quantity
Estimation of material quantity is evaluated with equation (1). The part used in this study does not require support material due to its simple shape. Complex parts may require support material, equation (2) will be used to estimate the total amount of support quantity. Table 5 shows the difference between the calculated mass, the real mass obtained by a precision scale and the mass estimated by the Makerbot software. The same part was manufactured five times and the real mass was exactly the same when measuring with a 0.1 g precise machine.
Material ρABS (kg/m3) Vlayer (mm3) Hpart (mm) Hlayer (mm) Calculated mass (g) Real mass (g) Mass estimated by the software (g) 30 x 30 x 10 parts 1080 163,6 10 0,2 8.6 8.7 12.2
Table 5. Material evaluation
Vlayer is calculated thanks to equation (5). Others information are given by the CAD file and the software.
𝑉
𝑙𝑎𝑦𝑒𝑟=
𝑉𝑡𝑜𝑡𝑎𝑙𝑁𝑢𝑚𝑏𝑒𝑟 𝑜𝑓 𝑙𝑎𝑦𝑒𝑟 (5)
More accurate results are obtained by using the equation than the estimation made by the software. The error in percentage between the calculated mass and the real mass is 1.1 % and between the real mass and the mass estimated by the software is 40 % for this specific part.
5.5 Data processing
Figure 13 represents the power and the duration associate to each manufacturing stage. This figure shows a picture of the Makerbot machine where the weight of each stage in terms of power consumption and duration are put forward. Compare to the forming stage, the warm-up stages including both heat bed plate and nozzle heat is much energy consuming. However the duration of the maintain of temperature for the two devices are depending to the forming stage duration. Considering that heat bed plate is the most consuming component, one way to enhance the environmental performance of this
machine is to reduce the forming stage duration. Another way is to reduce the power of the warming-up system of the machine. Average power and time of each stage are now well known, electrical energy consumption is calculated thanks to equation (3). Knowing also the mass of the part (8.7 g), the specific energy consumption (kWh/kg) is calculated as 9.51 kWh/kg.
Compare to the SEC values for FDM process investigated by other authors, the SEC in this paper scores significantly lower. This difference is justified by the type of machine studied by the other authors. Indeed, all the FDM machines studied in Table 1 are industrial machines. The powers involved in this kind of machine are greater than in low-cost open-source machines.
5.6 Modelling
Step 2, 3, 4 and 5 of the methodology (Figure 2) allow manufacturers to collect data about electrical and material consumption during parts fabrication. Thanks to all the measurements, a predictive model can be set up in order to estimate the electrical energy and material consumption for any manufacturing strategy.
Figure 14and equation (Erreur ! Référence non valide pour un signet.6) show how the total energy is calculated in this model. The average power of each stage is known due to the previous measurements (green inFigure 14). The known duration (green inFigure 14) before starting the printing are TIdle,Tplate, Tnozzle and a total warm up time that combine Tplate and Tnozzle calledTwarm-up. However, some durations depends on the geometry of the part (red in Figure 14). Thus, it is not possible to associate with these durations an average value that remain constant.
Figure 14. Method of calculation
𝑬
𝒕𝒐𝒕𝒂𝒍= (
𝑃
𝑐𝑎𝑑𝑥
𝑇
𝑐𝑎𝑑) + (
𝑃
𝑖𝑑𝑙𝑒𝑥
𝑇
𝑖𝑑𝑙𝑒) + (
𝑃
𝑝𝑙𝑎𝑡𝑒𝑥
𝑇
𝑝𝑙𝑎𝑡𝑒) +
(
𝑃
𝑚𝑎𝑖𝑛𝑡_𝑝𝑙𝑎𝑥
𝑇
𝑚𝑎𝑖𝑛𝑡_𝑝𝑙𝑎) + (
𝑃
𝑛𝑜𝑧𝑧𝑙𝑒𝑥
𝑇
𝑛𝑜𝑧𝑧𝑙𝑒) +
(
𝑃
𝑚𝑎𝑖𝑛𝑡_𝑛𝑜𝑧𝑧𝑙𝑒𝑥
𝑇
𝑚𝑎𝑖𝑛𝑡_𝑛𝑜𝑧𝑧𝑙𝑒) + (
𝑃
𝑓𝑜𝑟𝑚𝑖𝑛𝑔𝑥
𝑇
𝑓𝑜𝑟𝑚𝑖𝑛𝑔)
(Erreur ! Référencenon valide pour un signet.6)
Duration that are depending on the part geometry are calculated in the following way.
𝑇
𝑀𝑎𝑖𝑛𝑡_𝑃𝑙𝑎= 𝑇
𝑓𝑜𝑟𝑚𝑖𝑛𝑔+ (𝑇
𝑊𝑎𝑟𝑚−𝑢𝑝− 𝑇
𝑝𝑙𝑎𝑡𝑒)
(7)𝑇
𝑓𝑜𝑟𝑚𝑖𝑛𝑔= 𝑇
𝑀𝑎𝑖𝑛𝑡_𝑛𝑜𝑧𝑧𝑙𝑒= 𝑇
𝐼𝑑𝑙𝑒− 𝑇
𝑊𝑎𝑟𝑚−𝑢𝑝 (8) Figure 15presents the different stage duration in the manufacturing cycle of the machine for a better understanding.Figure 15. Stage duration in the manufacturing cycle
Once the operator has informed the numerical tool about the total manufacturing time, all the unknown times are calculated with equations (7) and (8). Thus, the total energy consumption is estimated. To evaluate of the material quantity, the operator has to inform
about the total volume of the part and the total height for an accurate estimation of the mass.
5.7 Comparison between the real and the model for several parts
New parts has been designed in order to apply the predictive model to different geometry (Table 6. SEC of various parts
). For this cylindrical part, the total manufacturing time estimated by the software is 780 seconds and the real time is 846 seconds. This difference between the estimated and the real manufacturing time cause an error of 7.8 %. Electrical energy consumption was also calculated not with estimation but with the real time and the percentage of error between these two values are 7.68 %. Same parts of 30 mm x 10 mm x 10 mm dimension were manufactured with different orientations. The first one was built according to Z axis direction and the other one was built according to X, Y plan.
Part Dimension s Estimate d time (s) Real time (s) Time error (%) SEC (kWh/kg) Energy error (%) R = 15 h = 4.25 780 846 7.87 7.64 7.61 10 x 10 x 30 1410 1483 4.92 13.01 4.88 30 x 10 x 10 1020 1067 4.39 9.38 4.16
The specific energy consumption of the part built in the Z axis direction is higher than the other one. It is because FDM process build time is primary influenced by Z height, therefore a taller part will result in a longer build time. Considering that the manufacturing time of these two parts is different but their masses are the same, their specific energy consumption is therefore different. For the manufactured parts studied in the model, the energy error varies approximately from 4 % to 8 % between the estimated and the measured energy. This percentage of error is satisfying for low dimension parts. However, other studies for bigger parts and functional parts have to be done to improve the model.
Table 7. Mass of the different parts
represents the mass of the parts obtained by the tree different methods. For the cylindrical part, the error in percentage between the calculated mass and the real mass is 6.8 % and between the real mass and the mass estimated by the software is 38 %. . For the rectangular shape, the error in percentage between the calculated mass and the real mass is 3.3% and between the real mass and the mass estimated by the software is 37.3 %. Equation (1) and (2) used in this methodology are more accurate to estimate the mass of a part than the Makerbot software for all the parts studied in this article.
Material ρABS (kg/m3) Vlayer (mm3) Hpart (mm) Hlayer (mm) Calculated mass (g) Real mass (g) Mass estimated by the software (g) 1080 115.5 4.25 0.2 2.7 2.9 4
20 30
2.9 3 4.12
54.5 10
Table 7. Mass of the different parts
The previous studied parts have a pretty basic shape and are not representative of the capability of AM processes. To overcome this situation, two parts with more complex shape has been designed and manufactured in order to show that the developed model is predicting reliable data for any part geometry. Figure 16 represents an impeller present in cars engine to the left and a cup holder optimized topologically to the right.
Figure 16.
Table 8 represents the estimated and the real values of the electrical energy consumption and Table 9 shows the estimated and real masses for the impeller and the cup holder. Even if the studied parts in this case are more complex, the difference between the model and the real remains acceptable.
Electrical energy (estimated Wh) Electrical energy (real Wh) Gap (%)
Impeller 180.6 191 5.5
Cup holder 109.8 118.1 7
Table 8.
Mass of the part (estimated g) Mass of the part (real g) Gap (%) Mass of the support (estimated g) Mass of the support (real g) Gap (%) Impeller Cup holder Table 9. 6. Conclusion
The proposed methodology asses, with accuracy, the life cycle inventory of FDM process during the manufacturing step. This methodology not only focuses on the electrical energy consumption but also on material consumption which is often forgotten when environmental impacts of these processes are realized. Future work on the inventory data of this additive manufacturing process will be to take into account the process emission and the creation of the feedstock filament. There are actually no life cycle inventory data on these features. This paper also describes the development of a parametric process model, which provide to an operator, an accurate estimations of the environmental performances of FDM process. This model allows users to quantify the environmental footprint of their FDM parts during the product design stage. Thus, it is possible for the designer to change the product design for a better ecofriendly part. With this
methodology, it is possible to compare the environmental performances of all kind of AM machine.
Future work will use this methodology on others AM machine for the purpose of making a comparison of the environmental performances of machines. Different parts will be made to improve the model for a better accuracy.
References
Balogun, V. A., Kirkwood, N. D., & Mativenga, P. T. (2014). Direct Electrical Energy Demand in Fused Deposition Modelling. Procedia CIRP, 15, 38–43.
Baumers, M., Tuck, C., Hague, R., Ashcroft, I., & Wildman, R. (2010). A comparative study of metallic additive manufacturing power consumption. Solid Free Fabr
Symp, 278–288.
Baumers, M., Tuck, C., Wildman, R., Ashcroft, I., & Hague, R. (2011). Energy inputs to additive manufacturing: Does capacity utilization matter? Solid Free Fabr Symp, 30–40.
Bourell, D. L., Beaman, J. J., Leu, M. C., & Rosen, D. W. (2009). A Brief History of Additive Manufacturing and the 2009 Roadmap for Additive Manufacturing: Looking Back and Looking Ahead, (2).
Burkhart, M., & Aurich, J. C. (2015). Framework to predict the environmental impact of additive manufacturing in the life cycle of a commercial vehicle. Procedia CIRP,
29, 408–413.
Huang, R., Riddle, M., Graziano, D., Warren, J., Das, S., Nimbalkar, S., Masanet, E. (2015). Energy and Emissions Saving Potential of Additive Manufacturing: The Case of Lightweight Aircraft Components. J Clean Prod, 1559-1570.
Junk, S., & Côté, S. (2012). A practical approach to comparing energy effectiveness of rapid prototyping, Proc of AEPR'12, 17th eur forum on rapid prototyp and manuf, 12–14.
Junk, S., & Côté, S. (2013). Influencing variables on sustainability in additive
Kellens, K., Dewulf, W., Overcash, M., Hauschild, M. Z., & Duflou, J. R. (2012a). Methodology for systematic analysis and improvement of manufacturing unit process life cycle inventory (UPLCI) CO2PE! initiative (cooperative effort on process emissions in manufacturing). Part 1: Methodology description . Int J Life
Cycle Assess, 17(2), 242–251.
Kellens, K., Dewulf, W., Overcash, M., Hauschild, M. Z., & Duflou, J. R. (2012b). Methodology for systematic analysis and improvement of manufacturing unit process life cycle inventory (UPLCI) CO2PE! initiative (cooperative effort on process emissions in manufacturing). Part 2: Case studies. Int J Life Cycle Assess,
17(2), 242–251.
Kellens, K., Yasa, E., Dewulf, W., & Duflou, J. R. (2010). Environmental assessment of selective laser melting and selective laser sintering. Going Green - CARE Innov, (Section 4).
Le Bourhis, F., Kerbrat, O., Dembinski, L., Hascoet, J.-Y., & Mognol, P. (2014). Predictive Model for Environmental Assessment in Additive Manufacturing Process. Procedia CIRP, 15, 26–31.
Lee, J., An, J., & Chua, C. K. (2017). Fundamentals and applications of 3D printing for novel materials. Applied Materials Today, 7, 120–133.
Lee, J., See, W., An, J., Kai, C., Tang, C. Y., Fane, A. G., & Haur, T. (2016). The potential to enhance membrane module design with 3D printing technology. Journal of
Membrane Science, 499, 480–490.
Luo, Y. L. Y., Ji, Z. J. Z., Leu, M. C., & Caudill, R. (1999). Environmental performance analysis of solid freedom fabricationprocesses. Proc of the 1999 IEEE Int Symp
on Electron and the Environ (Cat. No.99CH36357).
Makerbot Industries. (2009). Makerbot replicator 2X. Retrieved from http://store.makerbot.com/replicator2x
Masood, S. H. (2014). Advances in Fused Deposition Modeling. Comprehensive
Materials Processing (Vol. 10). pp 69-91.
Meteyer, S., Xu, X., Perry, N., & Zhao, Y. F. (2014). Energy and Material Flow Analysis of Binder-jetting Additive Manufacturing Processes. Procedia CIRP, 15, 19–25. Mognol, P., Lepicart, D., & Perry, N. (2006). Rapid prototyping: energy and environment
Morrow, W. R., Qi, H., Kim, I., Mazumder, J., & Skerlos, S. J. (2007). Environmental aspects of laser-based and conventional tool and die manufacturing. J Clean Prod,
15(10), 932–943.
Sreenivasan, R., & Bourell, D. L. (2009). Sustainability study in selective laser sintering – An energy perspective. Solid Free Fabr Symp, 257–265.
Sreenivasan, R., Goel, A., & Bourell, D. L. (2010). Sustainability issues in laser-based additive manufacturing. Phys Procedia, 5, 81–90.
Telenko, C., & Seepersad, C. C. (2012). A comparative evaluation of energy consumption of Selective Laser Sintering and Injection Molding of Nylon parts. Solid Free
Fabr Symp, 41–54.
Wilson, J. M., Piya, C., Shin, Y. C., Zhao, F., & Ramani, K. (2014). Remanufacturing of turbine blades by laser direct deposition with its energy and environmental impact analysis. J Clean Prod, 80, 170–178.
Wittbrodt, B. T., Glover, A. G., Laureto, J., Anzalone, G. C., Oppliger, D., Irwin, J. L., & Pearce, J. M. (2013). Life-cycle economic analysis of distributed manufacturing with open-source 3-D printers. Mechatron, 23(6), 713–726. Wohlers, T. (2015). Additive manufacturing and 3D printing state of the industry. Yoon, H.-S., Lee, J.-Y., Kim, H.-S., Kim, M.-S., Kim, E.-S., Shin, Y.-J., … Ahn, S.-H.
(2014). A comparison of energy consumption in bulk forming, subtractive, and additive processes: Review and case study. Int J Precis Eng and Manuf-Green