HAL Id: hal-01618294
https://hal.archives-ouvertes.fr/hal-01618294
Submitted on 7 Feb 2018
HAL is a multi-disciplinary open access
archive for the deposit and dissemination of
sci-entific research documents, whether they are
pub-lished or not. The documents may come from
teaching and research institutions in France or
abroad, or from public or private research centers.
L’archive ouverte pluridisciplinaire HAL, est
destinée au dépôt et à la diffusion de documents
scientifiques de niveau recherche, publiés ou non,
émanant des établissements d’enseignement et de
recherche français ou étrangers, des laboratoires
publics ou privés.
Controlling the Structure of a Porous Polymer by
Coupling Supercritical CO2 and Single Screw Extrusion
Process
Clémence Nikitine, Élisabeth Rodier, Martial Sauceau, Jean-jacques
Letourneau, Jacques Fages
To cite this version:
Clémence Nikitine, Élisabeth Rodier, Martial Sauceau, Jean-jacques Letourneau, Jacques Fages.
Con-trolling the Structure of a Porous Polymer by Coupling Supercritical CO2 and Single Screw Extrusion
Process. Journal of Applied Polymer Science, Wiley, 2010, 115 (2), pp.981-990. �10.1002/app.31031�.
�hal-01618294�
Controlling the Structure of a Porous Polymer by Coupling
Supercritical CO
2
and Single Screw Extrusion Process
Cle´mence Nikitine,1,2Elisabeth Rodier,1,3Martial Sauceau,1,3Jean-Jacques Letourneau,1,3 Jacques Fages1,3
1
Ecole des Mines d’Albi, RAPSODEE research centre, Albi F-81013, France
2Universite´ de Lyon, CPE-LGPC, UMR 2214, Villeurbanne F-69100, France 3
Universite´ de Toulouse, Mines Albi, CNRS, Albi F-81013, France
ABSTRACT: A study on the extrusion of Eudragit E100 was carried out using supercritical carbon dioxide (scCO2)
as plasticizer and foaming agent. ScCO2modifies the rheo
logical properties of the material in the barrel of the extruder and acts as a blowing agent during the relaxation when flowing through the die. For experiments, a single screw extruder was modified to be able to inject scCO2
within the extruded material. The aim is to determine a cor relation between operating conditions and foam structure. The effect of three parameters was studied: the temperature in the die and in the metering zone, the screw speed, and the volumetric flow rate of CO2. An increase in temperature
enhances the expansion rate and the average pore diameter
and appears to be the most significant parameter. The effect of CO2concentration is significant at small concentrations
only: the higher the CO2concentration, the lower the pore
density and the higher both the pore diameter and the expansion rate. The effect of the screw speed is tricky because a variation of this speed involves a decrease of CO2
weight ratio. This study shows that the structure of the extrudates does not evolve with a coupling of screw speed increase and a subsequent CO2weight ratio decrease.VC2009
Wiley Periodicals, Inc. J Appl Polym Sci 115: 981 990, 2010
Key words: extrusion; polymer; supercritical carbon dioxide; Eudragit E100; foams
INTRODUCTION
Although many different materials can be extruded, which means forced through a die, polymers are nowadays the main industrial application of such process. Among the three categories of polymers, thermoplastics, thermosets, and elastomers, the thermoplastics are, by far, the most processed by extrusion since their chemical nature and structure remained unchanged by undergoing extrusion.1
Manufacturing polymeric foams has more recently drawn researchers interest due to their multiple applications in acoustic dampening, thermal insula-tion, microelectronic applications as well as con-trolled release pharmaceutical formulations and scaf-folds for living tissue in biomedicine. Conventional foams are produced using either chemical or physical blowing agents. Various chemical blowing agents, which are generally low molecular weight organic compounds, are mixed with a polymer matrix and decompose when heated beyond a threshold temperature. This results in the release of a gas, and thus, the nucleation of bubbles. This
implies, however, the presence of residues in the porous material and the need for an additional stage to eliminate them.
An alternative lies in the use of a supercritical fluid (SCF). SCFs allow fast mass transfers due to their gas-like diffusivity, liquid-like density, low vis-cosity, and surface tension.2 In particular,
supercriti-cal carbon dioxide (scCO2), which is considered as a
green solvent in spite of its effect on the global warming, has emerged as an important SCF. In addition to its non-toxicity, non-flammability, and chemical inertia, it displays accessible supercritical conditions (Tc ¼ 31.1"C, Pc ¼ 7.38 MPa). In the
supercritical domain, it is relatively easy to fine tune its physicochemical properties from vapor-like to liq-uid-like limits by varying pressure and/or tempera-ture. ScCO2 is also known for being soluble in large
proportions in many polymers and has already been used in polymer processing.3–6Dissolved scCO2 acts
as a plasticizer leading to changes in mechanical and physical properties which in turn would decrease the constraints undergone by the material. The glass transition temperature, the interfacial tension, or the viscosity of various polymers could be lowered by scCO2, without changing the viscoelastic behavior of
the polymer matrix.7
Presence of scCO2 in extrusion process modifies
rheological properties of the polymer in the barrel of
the extruder and acts as a blowing agent during the relaxation when flowing through the die.8 Thus, its relatively high solubilisation in the polymer results in extensive expansion at the die. The reduction of viscosity decreases the mechanical constraints and the operating temperature within the extruder. Thus, coupling extrusion and scCO2 would allow the use
of fragile or thermolabile molecules, like pharmaceu-tical molecules. The absence of residues in the final material is also an advantage for a pharmaceutical application.
In classical theory, the homogeneous nucleation rate (i.e., the number of cells created per unit of time and volume) can be expressed as a function of the Gibbs free energy barrier for the formation of a criti-cal bubble nucleus and temperature.9 The theory suggests that the surface tension diminution or the saturation pressure increase will result in the increase of nucleation rate and the number of bub-bles created. Moreover, the power 3 of the surface tension in the expression of the free energy will involve a higher influence on nucleation. The interfa-cial tension decreasing with the pressure,10 scCO
2
allows thus the bubbles to appear at lower energy threshold. Consequently, the homogeneous nuclea-tion rate increases and a large number of small cells is obtained. In fact, controlling supercritical CO2
quantity allows the modification of the cell density and the cell size in microcellular foaming.
Our lab has developed a supercritical carbon diox-ide-assisted extrusion process, which has been applied to the polymer Eudragit E100. This polymer was chosen because of its pharmaceutical applica-tion and high enough CO2 solubility to generate a
substantial porosity (this was observed visually for a preliminary choice of the polymer). Moreover, Eudragit E100 has been already implemented by extrusion to produce solid dispersions of itracona-zole11,12 and also to design porous extrudates with
injection of scCO2.13
In a first stage, the residence time distribution (RTD) of a dye with and without the injection of scCO2 was studied.14 In this study, the aim is to
observe the effects on the structure of polymeric foams of three operating parameters: the tempera-ture in the metering zone and in the die, the screw speed and the mass flow rate of CO2. This study has
been performed to understand the different phenom-ena implied in extrusion process and to determine correlations between the operating conditions and the expansion, the cell size, and the cell density in macro or microcellular foaming. Some tests of com-pressive strength have also been carried out, but the extrudates were very fragile and they were crushed instantaneously. However, this research is not aimed at making scaffolds but rather matrices for solid dis-persions of active molecules.
MATERIALS AND METHODS Extrusion process
Eudragit E100 (SPCI, France) was used in different experiments. Eudragit polymers are copolymers derived of acrylic acid and methacrylate. Because of their multifunctional nature, unique properties, and good biocompatibility, these polymers are consid-ered to be of pharmaceutical grade.15
Figure 1 shows a monomer of Eudragit polymer. In Eudragit E, the –alkyl group is an ethyl group (C2H6) and the –R group a aminoethyl/methacrylate
(ACOOCH2CH2N(CH3)2). Eudragit E are soluble in
digestive fluids and are currently used as coating in solid pharmaceutical dosage forms for taste masking and protection.16
It is an amorphous polymer. Its glass transition temperature, measured by DSC (Differential Scan-ning Calorimetry, ATG DSC 111, SETARAM), is around 45–52"C. The solid density q
E, determined
by helium pycnometry (Micromeretics, AccuPYC 1330) is 1104 kg/m3. A rheological study at atmos-pheric pressure has been performed (ARES, Rheo-metric Scientific). The polymer viscosity decreases when shear rate increases, which is a characteristic behavior of a pseudoplastic fluid.17 In addition, the viscosity is similar to those of molten polymers (%103 Pa s). This characterization step helped in
choosing the operating conditions to process Eudra-git E100 by extrusion. These conditions have to ensure that the polymer flows well enough through the barrel without being thermally degraded and that CO2 is dissolved enough in the polymer to
create porosity.
Figure 2 shows the experimental set up (Escamex, France). The single-screw extruder used in this study has a 30 mm-screw diameter and a length to diame-ter ratio (L/D) of 35, that is to say a 1.05 m length (Rheoscam, SCAMEX). The screw is divided into three parts. The first one has a length to diameter ra-tio of 20 and the two others have a length to diame-ter ratio of 7.5. Between each part, a restriction ring has been fitted out to obtain a dynamic gastight (it prevents scCO2from backflowing). The first part has
conical geometry to allow the transport of solid pol-ymers and then, their melting and their plasticizing. Finally, the screw has a cylindrical geometry from the first gastight ring to the die. The temperature inside the barrel is regulated at five locations: Taand
Tbbefore the CO2injection, Tcand Tdafter the
injec-tion, and Tein the die. Only the temperature of the
metering zone Td and Te were changed at each
experiment. Four other temperatures were kept con-stant at 130"C.
Eudragit E100 is introduced into the feed hopper, and then flows through the barrel, begins to melt in the first part, is pressurized in the last two parts and is then forced through the die. There are three pres-sure sensors and two temperature sensors: P1 after
the CO2 injector, P2 and T1 before the second
gas-tight ring and P3 and T2 by the die. This allows
measuring the temperature and the pressure of the polymer inside the extruder. Errors associated to pressure and temperature sensors were about 0.2 MPa and 3.3"C, respectively.
Carbon dioxide (N45, Air liquide) is pumped from a cylinder by a syringe pump (260D, ISCO), which allows small flow rates (i.e., 1 mm3/s). The pump runs in a constant volumetric flow rate mode and CO2was introduced at the same pressure as the one
inside the extruder. The CO2injector is positioned at
a length to diameter ratio of 20 from the feed hop-per. It corresponds to the beginning of the metering zone, that is to say the part where the channel depth is constant and equal to 1.5 mm. The pressure, the temperature, and the volumetric CO2 flow rate are
measured within the syringe pump. CO2 density,
obtained by Peng Robinson equation of state,18 is used to calculate mass flow rate.
Experiments and structure analysis
For each experiment, carbon dioxide was then intro-duced at constant volumetric flow rate. The pressure in the CO2 pump is kept slightly higher than the
pressure P1, measured at the injection point within
the barrel. Once steady state conditions are reached, extrudates were collected and water-cooled to freeze the extrudate structure. Cooling was done at ambi-ent temperature. About 10 samples were collected during the experiment to check the homogeneity of the extrudates.
The operating conditions, easily tuneable and sus-pected to be the most influent on the extrudates structure, are the die temperature Teand the
meter-ing zone temperature Td(during all the experiments,
Td¼ Teand will be referred as die temperature), the
screw speed and the CO2 volumetric flow rate. The
temperatures in the zones of feeding and melting (corresponding to Ta, Tb, and Tc) were fixed at
130"C. Table I shows the operating parameters for each experiment. Extrusion tests were performed at die temperature ranging from 110 to 130"C on the
basis of the rheological studies, to have molten poly-mer. The range of the screw speed was fixed by the constructor’s parameters. Finally, it was necessary to have a permanent flow rate of polymer in the die; the maximum of the CO2 flow rate was determined
by the steady flow. Higher CO2content than studied
range usually causes unstable polymer flow with oscillating pressure. The 15 first experiments corre-spond to an experimental design and the following ones were carried out to complete the data.
Cylinders of Eudragit E100, 0.8–1.2 mm of diame-ter, were obtained. To calculate the apparent poros-ity qapp, they were weighed (METTLER TOLEDO,
AT400) and their volumes were evaluated by mea-suring their diameter and length with a vernier (Facom). To obtain this apparent density with a good enough precision, an average of 10 measure-ments was carried out. Expansion rate, defined as
the ratio of the extrudate volume (after extrusion) to the Eudragit E100 volume (before extrusion) is calcu-lated by eq. (1).
e ¼ qE
qapp
(1) qE is the Eudragit E100 density and qapp the
appa-rent density of the extrudate.
To complete the characterization of the porosity structure, samples were examined by environmental scanning electron microscopy (ESEM, FEG, Philips). An image analysis software using the Image Process-ing ToolboxTM of MatlabVR
, has been designed in the laboratory to estimate the cell size and the cell den-sity. This image processing task is mainly a watershed segmentation and can be declined in three main steps: first the enhancement of the image contrast and an exaggeration of the gaps between the pores are obtained by adding the ‘‘top-hat’’ filtered image and subtracting the ‘‘bottom-hat’’ filtered image to the original ESEM image. Then, the core of each pore is detected by computing the extended-minima trans-form19 of the image that corresponds to a particular
thresholded image of connected pixels less than a spe-cific intensity value. Finally, a ‘‘watershed
segmenta-tion’’20is accomplished using both the thresholded
bi-nary image and the enhanced one. The labeled regions so obtained give a good representation of the pore distribution in a section of an Eudragit extru-date. For each section, the number of pores, their area, average diameter, and Euler number are calculated. Then, from the analysis of successive sections of extrudates, the pore density has been extrapolated to a 3D value, in number of pores per cubic centimeter. This allowed us to compare our results to literature ones. As for ESEM observations, sample preparation is important since image analysis quality is closely linked to the sample preparation. This is delicate because Eudragit E100 extrudates are very fragile and brittle. For example, if the pore edges are not sharp enough, the detection of pores by threshold search becomes difficult and small pores created by gradient of colors are taken into account that do not corre-spond to a true porosity. Thus, the pore size distribu-tion obtained by the watershed segmentadistribu-tion may be artificially widened, average diameters underesti-mated and cell density overestiunderesti-mated.
Finally, we determine the maximum total time required for complete solubilization of CO2into the
fluid/melt phases and comparing with the residence time inside the extruder previously determined.14
The total mixing time required for complete homog-enization of the CO2/polymer melts divides in two
parts: the distributive mixing time tmand the
diffu-sion time td21,22defined by eqs. (2) and (4).
td¼S 2
D (2)
S¼hc_0 (3)
where D is the diffusivity of the fluid in the melt, _c the shear rate, x the volume fraction of the minor component, and h0is the original striation thickness
equal to the channel depth, constant at 0.15 cm. tm¼ h0 _ clm (4) with, lm¼ h0D 2 _c 3 s (5)
RESULTS AND DISCUSSION Torque evolution
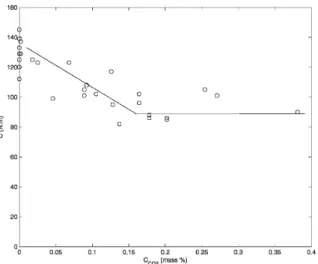
Figure 3 shows the torque C evolution versus the CO2 mass percent in the extruder. Torque first
decreases while the CO2 concentration increases, TABLE I
Operating Conditions of the Experiments
No. T ("C) N (rpm) Q CO2 (cm 3/min) C CO2 (%) 1 110 40 0.05 0.126 2 130 40 0.05 0.089 3 110 80 0.05 0.068 4 130 80 0.05 0.046 5 110 40 0.15 0.381 6 130 40 0.15 0.271 7 110 80 0.15 0.202 8 130 80 0.15 0.137 9 120 60 0.1 0.164 10 120 60 0.1 0.164 11 120 60 0.1 0.164 12 130 40 0.05 0.089 13 110 80 0.15 0.202 14 125 50 0.07 0.105 15 115 70 0.12 0.128 16 130 40 0.001 0.002 17 130 40 0.01 0.018 18 110 40 0.001 0.002 19 110 40 0.01 0.025 20 110 40 0.1 0.254 21 130 20 0 0 22 130 40 0 0 23 130 40 0 0 24 130 60 0 0 25 130 80 0 0 26 140 40 0 0 27 150 40 0 0 28 130 40 0.1 0.178 29 130 40 0.1 0.178 30 130 40 0.05 0.092
and then, beyond 0.15% of CO2, it remains roughly
constant, equal to 80 N/m.
The torque reflects the required motor power to fix the screw speed and to flow the polymer inside the extruder. The polymer opposes a resistance to its flow because of its viscosity. Thus, the torque reflects the processed material viscosity. Increasing the CO2 concentration decreases this viscosity and
consequently, decreases the torque value. Gourgouil-lon et al.7and Areerat et al.23have shown that a dis-solved supercritical fluid into a polymer implies the decrease of the melt viscosity.
From 0.15% of CO2, the viscosity evolves no
more. Even though the CO2 quantity is probably
smaller than the saturation concentration in the polymer at the injection conditions, dissolved CO2
quantity does not increase. We can notice that the pressure evolves between the CO2injection part and
the die (from 13 to 5.8 MPa; Fig. 4). Consequently, there is a decrease of the CO2solubility in the
poly-mer. Moreover, the mixing time (tm þ td) of CO2
-Eudragit E100 blend must be considered (Table II). Whatever the experiment, the diffusivity of the fluid in the melt, D, is considered as constant at 1.04 $ 10%10 m2/s and the shear rate is calculated by the eq. (6).
_
c ¼ 2pD2N
60ðD1 D2Þ (6)
Figure 3 Torque according to the CO2concentration.
Figure 4 Pressure drop ratio between the entrance of pump ing zone and the die according to the CO2concentration.
TABLE II
Mixing Times, Expansion, Mean Surface Equivalent Diameters, and Cell Density for Different Experiments
No. tm(s) td(s) e Diameter eq. (lm) Pores number (m 3)
1 221 110 6.72 161( 11 9.88$ 1013 ( 3.23 $ 1013 2 279 139 10.85 About 1200 <2.57$ 1012 3 211 106 6.65 155( 11 1.02$ 1014 ( 2.99 $ 1013 4 274 137 9.80 About 1200 <4.56$ 1011 5 106 53 2.99 148( 16 1.13$ 1014( 4.35 $ 1013 6 133 66 8.20 About 1200 <4.30$ 1012 7 102 51 3.21 154( 22 1.0$ 1014 ( 3.30 $ 1013 8 132 66 7.72 9 141 70 5.91 10 141 70 5.69 11 141 70 5.98 About 800 <7.30$ 1013 12 276 138 9.43 13 102 51 3.26 14 215 107 6.82 15 150 75 4.61 16 176 88 6.33 67( 16 2.57$ 1015 ( 0.58 $ 1015 17 816 408 7.28 18 174 87 2.80 47( 8 1.80$ 1016 ( 9.43 $ 1015 19 645 323 3.64 168( 12 2.60$ 1013 ( 1.40 $ 1013 20 139 70 3.79 163( 13 7.45$ 1013( 2.95 $ 1013
where N is the value of screw speed, D1and D2are
diameters of screw and extruder, respectively. Whatever CO2 concentrations, the residence time
in extruder (i.e., about 200 s) is smaller than the eval-uated mixing time and consequently, CO2-Eudragit
E100 blend would not be at thermodynamic equilib-rium. Thus, thermodynamic and kinetic phenomena may explain why the torque evolves no more above a CO2concentration of 0.15%.
Pressure evolution
To observe only the effect of CO2 on the pressure,
we have calculated a ratio of pressure drop with CO2or without CO2, defined by the eq. (7).
DP1!3¼ ðP1
P3ÞwithCO2
ðP1 P3ÞwithoutCO2
(7) Figure 4 shows the pressure drop between the CO2 injection part and the die versus the CO2
con-centration. Like for the torque, pressure drop first decreases while the CO2 concentration increases,
and then, from 0.18–0.2% of CO2, it remains roughly
constant, equal to 1. The decreasing of the pressure drop with the rise in CO2 concentration reflects the
dissolution of CO2into the polymer.
We can notice that mainly, the pressure drop with CO2 is higher than without CO2. Inside the barrel,
near the die, the main flow is governed by the sum-mation of two flows. The first is a shear flow and the second a Poiseuille flow.24 The shear flow is created by the screw speed and the Poiseuille flow by the pressure through the die. Consequently, the velocity profile uZ(n) evolves with a pressure gradient along
the pumping zone, i.e., between P1and P325:
uzðnÞ ¼ vFzn þP2gZ1 P3
p nðn 1Þ (8)
vFz is the relative speed of the barrel, Zp the length
of the channel, n the position of the particle accord-ing to the channel height (equal to y/H, y the posi-tion on y-axis and H the depth of the channel),g the viscosity of the polymer. For a given temperature and screw speed, the parameters vFz, Zp, and n are
constant. It is possible to express the pressure drop ratio according to the parameters of eq. (9).
½P1 P3*withCO2 ½P1 P3*withoutCO2 ¼ ½uzðnÞ vFzðnÞ*withCO2 ½uzðnÞ vFzðnÞ*withoutCO2 gwithCO2 gwithoutCO2 (9) However, the viscosity of the polymer decreases with the CO2concentration. Thus, the ratio of
viscos-ity is lower than 1. The relative velocviscos-ity of the barrel vFz remains constant with and without CO2, thus,
the speed ratio will be higher than 1. Consequently, it seems that at low CO2concentration, the pressure
drop is governed rather by the speed evolution than by the viscosity ratio. When CO2 concentration
increases, the lowering of the viscosity becomes con-sequent. Finally, there is an equilibrium between the two ratios and we obtain the same pressure drop with and without CO2in the process.
Reproducibility
Table II shows the obtained results: the characteristic times (mixing and diffusion), expansion rate e, the mean surface equivalent diameter of the pores, and the density of the cells.
To check the results reproducibility, an experiment with a die temperature of 120"C, a screw speed of 60 rpm, and a CO2volumetric flow rate of 0.1 cm3/
min, has been repeated three times (experiments 9, 10, and 11). Pressure, temperature, and torque within the extruder were the same for each experiment. The expansion rate was 5.84 ( 0.15. The standard devia-tion obtained on the expansion rates is roughly the same as the experimental one linked to the apparent and the solid density measurements. We can con-clude that the experiments are reproducible.
Effect of screw speed
First, we measured the evolution of expansion rate with the screw speed. The expansion rate remained nearly constant when screw speed increases from 40 to 80 rpm. A 1% increase in porosity was obtained which was not significant and consequently, the screw speed is not an influent operating parameter for the polymer expansion.
Yet, it is difficult to study only the effect of the screw speed. Indeed, an increase of screw speed implies a decrease of CO2 weight ratio (for a fixed
volume flow rate of CO2). And both have opposite
effects on viscosity; a screw speed increase means higher shear rates and lower viscosities and a CO2
ratio decrease means higher viscosities. However, we can notice that at 110"C and at 130"C (i.e.,
experi-ments 1 to 4), the average diameters do not evolve (i.e., 0.158 mm at 110"C and about 1.2 mm at 130"C) whatever the screw speed. This is confirmed by the structure of the samples which is the same (Fig. 5). Thus, we can conclude that the structure of the extrudates does not evolve by increasing the screw speed increase (in the range 40–80 rpm) because of the subsequent CO2weight ratio decrease.
Effect of the die temperature
Figure 6 shows that expansion increases with the temperature of the matter T2, inside the die (the
evolution is the same with Te) whatever the screw
speed and the CO2 concentration. Sauceau et al.26
found the same results with polystyrene, but Park et al.27found that the expansion rate decreases with the increase of polymer temperature. They suggest that the CO2diffusion towards outside the extrudate
is faster when the polymer surface cools slowly. This implies a high shrinkage at the die outlet. As the polymer is different and the temperatures used are lower than those of Park et al.,27the contraction phe-nomenon is limited in this study. Moreover, a rise in temperature lowers the polymer viscosity, and thus, favors the growth of the bubbles, leading to an increase of the expansion rate.28 Finally, at 130"C,
the time necessary to freeze the structure of the polymer is longer than at 110"C, and consequently,
the expansion rates are higher.
Figure 7 shows the evolution of the pore equiva-lent diameter dpaccording to the temperature, for all
experiments of Table II. Whatever the screw speed and the CO2 concentration, the cell size increases
with temperature, even for experiments carried out at the lowest CO2 concentrations, i.e., at 0.002%.
Pore equivalent diameter of 47 and 67 lm at 110"C
and 130"C, respectively are obtained. This confirms
the significant effect of temperature on the growth phenomenon. Figure 8 shows typical pictures taken from two typical samples processed at 130"C and 110"C (above 0.002% of CO
2). The sample picture
shows porous heterogeneity. Indeed, there are more pores on the exterior section and they are smaller than those located in the center of the extrudate. The first phenomenon occurring is nucleation, and then growth, which is inhibited on the exterior section by the peripheral water-cooling, leading to smaller pores. We can also notice that the surface of the central cells is not smooth and has some cavities. This may be due to a coalescence phenomenon
Figure 5 SEM pictures of samples processed at T 110"C, (a) N 40 rpm and 0.126% of CO
2, (b) N 80 rpm and
0.068% of CO2(Experiments 1 and 3).
simultaneous to the growth one. The thick outside wall on picture 8(a) is due to the fast water-cooling. It increases the material viscosity and consequently the retractile force restricting cell growth to increase.29,30
Moreover, the cell density according to the die temperature is given in Figure 9. This one appears roughly constant between 110"C and 120"C, then
lowers with an increasing temperature up to 130"C.
At low CO2concentration, the cell density is higher,
but follows the same evolution.
Finally, an increase of the temperature favors the pore expansion and the cell size and decreases the cell density. We can conclude that growth and coa-lescence phenomena are favored when temperature increases and lead to larger porosity.
Effect of CO2weight ratio
Figure 10 shows the influence of CO2 concentration
on the expansion rate. For both temperatures, the evolution of the expansion rate is the same. It
increases with CO2 up to 0.1%, and then it
decreases. The relationship between CO2
concentra-tion and expansion rate is complex because many physical properties of Eudragit/CO2 blends depend
on this concentration.
Increasing the CO2 concentration reduces the
interfacial tension and consequently favors the homogeneous nucleation. This leads in turn to a decrease of the Weber number defined as the ratio between surface forces that prevents the break-up and shear forces that are responsible for the break-up of a bubble. Thus, it prevents the coalescence phenomenon.
Increasing the CO2 concentration diminishes the
viscosity of the polymer, and hence, favors growth and coalescence phenomena.18 Yet, this decrease lowers the residence time of the polymer inside the extruder.14These complex influences reflect itself on the structure of the extrudates.
Generally, the porosity obtained was rather a mac-roporosity with a mean diameter higher than the
Figure 8 SEM pictures of samples (a) T 110"C and (b) T 130"C (experiments 16 and 18).
order of magnitude given in the literature for poly-mers foams, i.e., 10lm.31
The cell density is smaller than those given in the literature, i.e., from 1015 to 1021 pores/m3,21 excepted for small CO2
concentra-tions. Indeed, for experiments 12 and 18, cell density is similar to those in literature, i.e., 2.1015 and 2.1016 pores/m3. At higher CO
2 concentrations (above 0.1
%), the small cell density and the macroporosity may be explained by an outmost predominant growth phenomenon but also probably a heterogene-ous polymer-CO2 blend in the extruder for some
CO2 concentrations where CO2 could be present in
excess. Consequently, this favors nucleation around the existing bubbles and their growth and this enhances the macropores development to the detri-ment of the small pores.32
At low CO2 concentration, the structure of
sam-ples was homogeneous (Fig. 11). Only in the center of the sample, there were larger pores. This is an effect of the peripheral water-cooling and confirms the significant effect of the temperature.
Finally, Table II shows that whatever the tempera-ture, the cell diameter increased with CO2 up to
0.05% and then remained constant. Moreover, the cell density declines with CO2 up to 0.05%, then it
rose and finally stayed constant (Fig. 12). Conse-quently, there are three steps in the evolution with the CO2 concentration. First, expansion and cell size
increased while cell density decreased. That means that a small amount of CO2 favors growth and
coa-lescence phenomena. Second, expansion and cell density went up, but the pores diameter remained constant. Only a nucleation phenomenon can explain an increase in the cell number. The quantity of CO2
was high enough to modify the physical properties
Figure 11 SEM pictures of samples at 110"C, 40 rpm, and 0.002% of CO
2(experiment 18).
Figure 12 Cell density according to the CO2 concentra
of Eudragit/CO2 melts (interfacial tension and
vis-cosity) and hence, the homogeneous nucleation was favored. Third, the expansion lessened and cell size and density were constant. When the CO2
concentra-tion was higher than 0.15%, CO2/Eudragit melt
might not be in single-phase. Excess CO2 may
explain the lower expansion by shrinkage of the polymer at the die.
CONCLUSION
A process based on the extrusion in a single-screw extruder coupled with supercritical carbon dioxide (scCO2) was implemented. ScCO2modifies the
rheo-logical properties of the polymeric material in the barrel of the extruder and acts as a blowing agent during the relaxation at the passage through the die. It allows the injection of scCO2 into the melt, the
mixing of both components and the creation of po-rosity into the extruded polymer. In this work, it was applied to Eudragit E100, a biocompatible poly-mer. The effects of screw speed, die temperature, and CO2 concentration on material porosity were
studied. Eudragit E100 foams with porosity from 65– 90% were obtained. Screw speed showed no signifi-cant effect on the structure of the material. On the contrary, temperature reveals to be the most signifi-cant parameter. A higher temperature enhances the growth phenomenon, consequently, the expansion rate and the average diameter increase. Moreover, coalescence phenomenon is favored by high temper-ature. The effect of CO2 concentration is far more
complicated because several physical properties of Eudragit/CO2 blends depend on this concentration.
At low concentrations (i.e., around 0.002% weight), much denser microcellular foams were obtained, with smaller pores (around 50–60lm) and high cell densities (1015–1016cells/m3). This research is aimed at making matrices for solid dispersions of active molecules. This study shows that it is possible to work at milder operating conditions than usual extrusion process. A temperature of 110"C is not a
very hard condition and allows the addition of an active drug in further studies.
References
1. Rauwendaal, C. Polymer Extrusion; Hanser Publishers: Mu¨n chen, 2001.
2. Eckert, C.; Knutson, B.; Debenedetti, P. Nature 1996, 383, 313. 3. Kazarian, S. G. Polym Sci 2000, 42, 78.
4. Nalawade, S. P.; Picchioni, F.; Janssen, L. P. B. M. Prog Polym Sci 2006, 31, 19.
5. Aubert, J. H. J Supercrit Fluids 1998, 11, 163.
6. Sato, Y.; Fujiwara, K.; Takikawa, T.; Takishima, S.; Masuoka, H. Fluid Phase Equilib 1999, 162, 276.
7. Gourgouillon, D.; Avelino, H. M. N. T.; Fareleira, J. M. N. A.; Nunes Da Ponte, M. J Supercrit Fluids 1998, 13, 177.
8. Sauceau, M.; Ponomarev, D.; Nikitine, C.; Rodier, E.; Fages, J. Improvement of Extrusion Processes Using Supercritical Car bon Dioxide. Supercritical Fluid and Materials; Vandoeuvre: France, 2007.
9. Han, J. H.; Han, C. D. J Polym Sci B Polym Phys 1990, 28, 711. 10. Li, H.; Lee, L. J.; Tomasko, D. L. Ind Eng Chem Res 2004, 43,
509.
11. Six, K.; Leuner, C.; Dressman, J.; Verreck, G.; Peeters, J.; Blaton, N.; Augustijns, P.; Kinget, R.; Van Den Mooter, G. J Therm Anal Calorim 2002, 68, 591.
12. Six, K.; Murphy, J.; Weuts, I.; Craig, D. Q. M.; Verreck, G.; Peeters, J.; Brewster, M.; Van Den Mooter, G. Pharm Res 2003, 20, 135.
13. Verreck, G.; Decorte, A.; Tomasko, D.; Arien, A.; Peeters, J.; Rombaut, P.; Van Den Mooter, G.; Brewster, M. E. J Supercrit Fluids 2006, 38, 383.
14. Nikitine, C.; Rodier, E.; Sauceau, M.; Fages, J. Chem Eng Res Des 2009, 87, 809.
15. Dittgen, M.; Durrani, M.; Lehmann, K. S. T. P. Pharma Sci 1997, 7, 403.
16. Rowe, R. C.; Sheskey, P. J.; Owen, S. C. American Pharmaceu tical Association and Pharmaceutical Press: London, 2006, 52, p 1.
17. Nikitine, C.; Sauceau, M.; Le´onardi, F.; Rodier, E.; Fages, J. 42e`me Colloque du Groupe Franc¸ais de Rhe´ologie; Clermont Ferrand: France, 2007.
18. Peng, D. Y.; Robinson, D. Ind Eng Chem Fundam 1976, 15, 59. 19. Soille, P. Morphological Image Analysis: Principles and Appli
cations; Springer Verlag: New York, 1999; p 170. 20. Meyer, F. Signal Processing 1994, 38, 113.
21. Kemmere, M. F.; Meyer, T. Supercritical Carbon Dioxide in Polymer Reaction Engineering; Wiley vch: New York, 2005; Chapter 12.
22. Singh, B.; Rizvi, S. J Food Process Eng 1998, 21, 91.
23. Arrerat, S.; Nagata, T.; Ohshima, M. Polym Eng Sci 2002, 42, 2234.
24. Vergnes, B.; Puissant, S. Techniques de l’inge´nieur 2002, p 1. 25. Rauwendaal, C. M. Dekker, Inc.: 1991, Chapter 7, p 365. 26. Sauceau, M.; Nikitine, C.; Rodier, E.; Fages, J. J Supercrit
Fluids 2007, 43, 367.
27. Park, C.; Behravesh, C.; Venter, R. Polym Eng Sci 1998, 38, 1812.
28. Han, C. Multiphase Flow in Polymer Processing; Academic Press: New York, 1981.
29. Arora, K. A.; Lesser, A. J.; Mccarthy, T. J. Macromolecules 1998, 31, 4614.
30. Arora, K. A.; Lesser, A. J.; Mccarthy, T. J. Polym Eng Sci 1998, 38, 2055.
31. Fleming, O. S.; Kazarian, S. G.; Kemmere, M. F. Meyer, T., Ed.; Wiley VCH: Weinheim, 2005; Chapter 10, p 565. 32. Nalawade, S. P.; Nieborg, H. J.; Picchioni, F.; Janssen, L. P. B.