HAL Id: hal-01404594
https://hal.inria.fr/hal-01404594
Submitted on 29 Nov 2016
HAL is a multi-disciplinary open access
archive for the deposit and dissemination of
sci-entific research documents, whether they are
pub-lished or not. The documents may come from
teaching and research institutions in France or
abroad, or from public or private research centers.
L’archive ouverte pluridisciplinaire HAL, est
destinée au dépôt et à la diffusion de documents
scientifiques de niveau recherche, publiés ou non,
émanant des établissements d’enseignement et de
recherche français ou étrangers, des laboratoires
publics ou privés.
Deploying Distributed Cloud Infrastructures: Who and
at What Cost?
Adrien Lebre, Anthony Simonet, Anne-Cécile Orgerie
To cite this version:
Adrien Lebre, Anthony Simonet, Anne-Cécile Orgerie. Deploying Distributed Cloud Infrastructures:
Who and at What Cost?. Proceedings of the fifth IEEE International Workshop on Cloud
Comput-ing Interclouds, Multiclouds, Federations, and Interoperability, Apr 2016, Berlin, Germany. pp.6,
�10.1109/IC2EW.2016.48�. �hal-01404594�
Deploying Distributed Cloud Infrastructures:
Who and at What Cost?
Adrien Lebre, Anthony Simonet
Inria, Mines de Nantes, LINA Nantes, France Email: firstname.lastname@inria.fr
Anne-C´ecile Orgerie
CNRS, IRISA Rennes, France Email: anne-cecile.orgerie@irisa.frAbstract—Academics and industry experts are now advocating for going from large-centralized Cloud Computing (CC) infras-tructures to smaller ones massively distributed at the edge of the network. Referred to as “fog/edge/local computing”, such a dawning paradigm is attracting growing interest as it improves the whole services agility in addition to bringing computing resources closer to end-users. While several initiatives investigate how such Distributed Cloud Computing (DCC) infrastructures can be operated, the economical viability of such solutions is still questionable, especially if the objective is to propose attractive prices in comparison to those proposed by giant actors such as Amazon, Microsoft and Google.
In this article, we go beyond the state of the art of the current cost model of DCC infrastructures. First, we provide a classification of the different ways of deploying DCC platforms. Then, we propose a versatile cost model that can help new actors evaluate the viability of deploying a DCC solution. We illustrate the relevance of our proposal by instantiating it over three use-cases and compare them according to similar computation capabilities provided by the AWS solution. Such a study clearly shows that deploying a DCC infrastructure makes sense for telecom operators as well as new actors willing to enter the game.
I. INTRODUCTION
Cloud Computing (CC) is a victim of its own success: in order to answer the ever growing demand for computing resources, CC providers must build Data Centers (DCs) of ever-increasing sizes. As a consequence, besides facing the well-known issues of large platforms management such as scalability and reliability, CC providers now have to deal with energy considerations that limit the number of physical resources that one location can host. The current answer to address such a limitation consists in deploying Mega DCs (i.e., DCs composed of hundreds of thousands resources) in strategic locations presenting energy advantages such as in the vicinity of nuclear power plants in Western North Carolina, USA or close to the polar circle in order to leverage free cooling techniques [1].
Unfortunately, the above solution also comes with a number of drawbacks:
• The externalization of private applications/data often faces legal issues that restrain companies from outsourc-ing them on external infrastructures, especially if they are located in foreign countries;
• The availability of application/data requires multiple DCs (sites) located in different geographical areas;
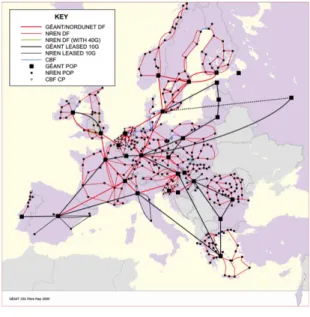
Fig. 1. Topology of GEANT
Each black square corresponds to one network point of presence (a.k.a. a PoP) that can host a nano/micro DC.
• The distance between users and DCs creates a wasteful and costly network overhead in many applications that have a local scope or that manipulate a large amount of data. Such a distance can even prevent the use of CC solutions by mobile computing or Internet of Things (IoT) applications as the interactivity is a predominant factor. The concept of micro/nano DCs at the edge of the backbone [2], [3] is a promising solution to address the aforementioned concerns. However, operating multiple small DCs breaks somehow the idea of mutualization to drive economies of scale and administration simplicity, making this approach questionable. While few initiatives such as the Discovery consortium [4] are investigating how such Distributed Cloud Computing (DCC) infrastructures can be operated, there is no study that analyzes whether DCC solutions can compete in terms of economical viability with the industry references (Amazon, Microsoft, Google. . . ). From our point of view, the cost model that has been introduced with the concept of micro/nano DC [2], [3] does not study the variety of implementation possibilities, making the decision of deploying
a DCC difficult for potential actors.
In this article we propose to address such a shortfall by pro-viding a detailed and versatile cost analysis of DCC infrastruc-tures. Because deployment and management constraints differ greatly between actors, our cost analysis considers several scenarios depending on the initial capital of possible investors in terms of buildings, servers, network devices and human forces. We consider actors ranging from small companies that can afford only a small investment and rent resources hosted by third party providers, to network operators that own and operate a backbone network with geographically distributed Points of Presence (POPs), like those of the GEANT net-work as depicted by Figure I. GEANT is the federation of all National Research and Education Networks (NRENs) in Europe. Each black square on the figure represents a POP where computing resources can be added in order to create nano/micro DCs in a relative short time as well as an attractive cost. We compare these actors qualitatively against a set of common criteria, such as the locality of resources and the induced latency, the elasticity of the infrastructure and the opportunities that each deployment offers, such as the possibility to use local renewable energy sources.
We illustrate the relevance of our cost model by instantiating it on three scenarios, enabling us to compare them to each other but also to the Amazon offers in terms of VM prices.
We believe that such a study is valuable for the community as it can serve as a guideline for anyone trying to evaluate whether they can deliver competitive CC offers, at which cost, and with which advantages compared to a centralized solution. The remaining of the article is structured as followed. Section II discusses related works in the literature; Section III classifies the possible actors and proposes a detailed cost model for deploying a DCC infrastructure. Section IV instan-tiate the cost model on three scenarios and compares them to the offers of AWS. Finally, Section V draws conclusions and gives several perspectives.
II. RELATEDWORK
In [3], Greenberg et al. examine the main costs of traditional data centers and propose ways to reduce them. One option in particular is to consider the whole DC as a single failure unit to avoid most redundancy-related costs, and to build more smaller DCs. However they do not propose an actual model for estimating the cost of operating a DC. Church et al. [2] go further into this idea of breaking large data centers into smaller ones. They describe a model of DCC infrastructure composed of micro-DC deployed in condominiums. They detail a cost model for hosting 48 servers per condo and demonstrate that this model can compete with large DCs, even making additional revenue by renting the condos. However, they examine only one possible deployment scenario of DCC infrastructure. In [5], Narayanan et al. express more moti-vations for the nano/micro-DC model, arguing it will reduce the excess capacity compared to larger DCs, and thus reduce operating costs. They propose to optimize the capacity of DCs to reduce waste with a linear model, taking latency and
Level of control Outsourced Controlled 1 2 3 4 5 Inter-DC network 7 7 3 7 3 Compute/storage/ intra-DC network 7 3 3 3 3 Building 7 7 7 3 3 TABLE I
LEVEL OF CONTROL ON ELEMENTS OF THE INFRASTRUCTURE,FROM FULLY OUTSOURCED TO FULLY CONTROLLED.
availability into consideration.
The cost of ownership and operation of centralized data centers has been extensively studied in the literature; [6] proposes a detailed cost model for centralized DCs, as well a as revenue model to maximize cloud operator profit. Li et al. also propose a very detailed model along with a calculation tool in [7], taking cloud utilization in consideration. However the inherent differences between centralized and distributed CC infrastructures impact all DC expenses, and models need to be adapted to this new paradigm. Both of them also only study how design choices impact the cost of infrastructures.
Overall, a study of the impact of these choices on other properties such as latency, elasticity or power usage is paramount for understanding the potential of the nano/micro DC approach.
III. DCC INFRASTRUCTURES
In this section, we first classify the different ways of deploying a DCC infrastructure and discuss their implication regarding the resulting infrastructures. Then we provide a versatile model that defines the different costs related to such deployments.
A. Deployment Classification
There are multiple motivations to deploy a DCC infrastruc-ture and many ways to achieve it. These concerns will later drive the cost model of the infrastructure. Constructing our cost model, we reviewed many actors such as CC providers, Internet Access Providers (ISPs), telecom operators, or small companies that want to join the CC market. As a result, we found that most of them do not fit well in any predefined category. Quite the opposite, they all seem specific enough to require their own category. In the light of this, we decided to construct a scale rather than a taxonomy by considering that DCC infrastructures can be seen as three independent el-ements. Table I presents this scale, from 1 (“fully outsourced”) to 5 (“fully controlled”). The “Inter-DC network” element describes whether the actor manages their own backbone network to connect their nano/micro DCs, or if they are renting it from an ISP/telecom operator. The “Compute/storage/intra-DC network” element refers to IT devices inside a “Compute/storage/intra-DC e.g., is the actor renting hosted servers from providers, or do they buy them? Finally the “building” element indicates the control that actors have on DC facilities, from colocation inside existing network centers to the construction of new buildings.
Level of control
Outsourced Controlled
1 2 3 4 5
Use-case New market actor Deployment over existing facilities
Networking operator lever-aging existing DC
Deployment of a new DC Deployment of a new DC and network
Infrastructure
elasticity Resources can be added/removed on demand Resources can be added/removed by a technician on site Resources can be added/removed by a technician on site
Time to delivery depends on the time required to de-ploy a new DC
Same as level 4 + deploy-ment on the interconnect Network supervision
(monitoring/control) No control No control Full control Control inside DCs Full control Maintenance
(Hard-ware) Outsourced Computation, storage, intra-DC network Computation, storage, intra/inter-DC network Computation, storage, intra-DC network Computation, storage, intra/inter-DC network Power No control Limited control No control Renewable and choice of
provider possible
Renewable and choice of provider possible Cooling/PUE No control Limited control Limited control PUE can benefit from
latest achievements (free cooling, etc.)
PUE can benefit from latest achievements (free cooling, etc.)
Security (Human
presence) Outsourced (managed by provider)
Outsourced (managed by provider)
Varying: depends on exist-ing infrastructure and hu-man presence in POP
Costly (need to secure a new POP)
Costly (need to secure a new POP)
Network cost Monthly based Monthly based Leveraging existing Monthly based/outsourced Initial investment Reliability/
resiliency High especially if using several tenants (computa-tion, storage, network)
Single tenant for network Single tenant Several network tenants Single tenant
Coverage ratio Few locations Deployed according to the demand
Numerous locations Deployed according to the demand
Maximum coverage
TABLE II
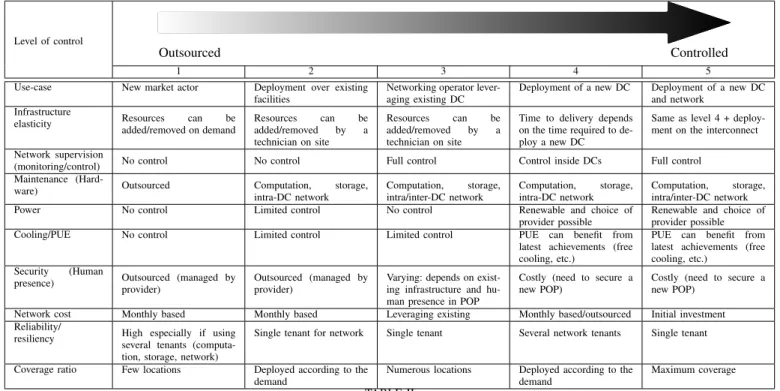
QUALITATIVE METRICS FOR ACTORS DEPENDING ON THEIR LEVEL OF CONTROL ON MULTIPLE PARTS OF THE INFRASTRUCTURE.
At the lowest level of control, we find actors who decide to outsource the whole infrastructure to one or more providers. The servers are hosted in existing data centers, so there is no facility cost, and both the servers and network are managed by third party providers. At level 2, we find actors that own and manage servers and intra-DC networks, and nothing else. This might be the case of companies that buy servers and place them in colocation inside third party DCs, as it is common for cloud gaming applications. Another example might be companies promoting the data furnaces [8] concept: they deploy compute servers in water heaters installed in private homes, and must thus manage the compute and storage servers, as well as the network between servers. However, the network connecting the homes being the public Internet, it is managed by a third party provider. At level 3, we find actors that operate their own network, but install servers in colocation (like telecom operators such as Interoute) or in universities (like NRENs). Thus, they outsource facilities, but fully manage the servers and the network inside data centers and between data centers. At level 4 we find actors that manage the buildings for their DCs as well as the resources inside DCs, but still rely on an ISP to interconnect them. This corresponds to the condo scenario investigated in [2] or more recently to the Amazon CloudFront service1 that relies on small DCs near the edge of the network, but outsources the interconnect between them. Finally at the highest level of control, nothing is outsourced and the actor manages every part of the infrastructure. This level of control can be found amongst network providers: they install and maintain many
1http://aws.amazon.com/cloudfront/
POPs that can be easily transformed into DCs, manage the servers, the network inside the DCs and between the DCs.
Table II presents a set of qualitative metrics regarding multiple aspects of the infrastructure produced by the actors at all levels of our scale. These metrics include the elasticity of the infrastructure, how close servers can be deployed from users, the power profile of the infrastructure, and more. For example, telecom operators and ISPs will cover more population and be closer to users, offering IoT applications the lower latencies they need. Controlling power sources will allow to build new “green” infrastructures based on renewable energy sources. However, in terms of elasticity and time to delivery, the advantage is on the outsourced side of the scale. Considering this classification, we detail in the next subsec-tion an exhaustive cost model that covers all possible costs for operating a DCC infrastructure, independently of how much of the infrastructure is outsourced.
B. Cost Model
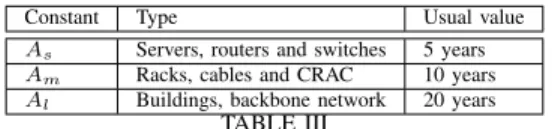
The model we present now represents the cost of adding a single DC (i.e., one site) to a DCC infrastructure. We consider seven categories of expenses that any actor will be subject to: servers, storage, network, power, cooling, building and main-tenance. For each category, we give an equation of its monthly cost. The costs of different purchased material are amortized over different periods of time. Thus, we start by defining an amortization function Am(time) = 1
time where time is the amortization period in months. time will take value in the three constants that are summarized in Table III. When resources are rented/outsourced, As= Am= Al= time = 1.
Constant Type Usual value As Servers, routers and switches 5 years
Am Racks, cables and CRAC 10 years
Al Buildings, backbone network 20 years
TABLE III
AMORTIZATION CONSTANTS FOR DIFFERENT KINDS OF RESOURCES AND USUAL VALUES.
a) Servers and storage: The first cost is for IT devices, for which we consider three kinds of servers: 1) controllers that host the cloud management services and interact with users, 2) compute servers that host VMs, and 3) storage servers that store VM images and user data. We compute their costs separately in Equations 1 to 3 to account for price discrepancies between different server configurations (e.g., the more storage a server has, the most expensive it is). In these equations, Ncontr, Ncomp and Nstorage are respectively the number of controllers, compute and storage servers. Each depends on the needs of a particular situation and as such they are inputs of the model. Pcontr, Pcomp and Pstorage are the unit prices of controller, compute and a storage servers respectively.
Costcontr= Ncontr× Pcontr× Am(As) (1)
Costcomp= Ncomp× Pcomp× Am(As) (2)
Coststorage= Nstorage× Pstorage× Am(As) (3) b) Network: Equation 4 computes the cost corresponding to the monthly cost of the interconnect inside and between servers and DCs composing the infrastructure. This includes the cost of the backbone network, of routers and switches.
Costnetwork= Costintranet+ Costinternet (4) Equations 5 and 6 detail these two costs:
Costintranet= Nswitch× Pswitch× Am(As) (5)
Costinternet= Pbackbone× Am(Al) (6) Nswitch, the number of switches in each DC, is given by
Nswitch= SN IC× PN IC × Nserver/Nport (7) where SN IC and PN IC are the number of NIC per server and the number of port per NIC respectively, and Nport is the number of ports on a switch. Nserveris the number of servers i.e., Ncontr+ Ncomp+ Nstorage.
c) Power: This is the cost of powering the infrastructure, i.e., servers and network devices. Equation 8 computes the peak power draw of the infrastructure: it sums the power consumption of the controller, compute and storage servers, of switches and racks (respectively Econtr, Ecomp, Estorage,
Eswitch and Erack) based on the data sheets provided by manufacturers, assuming a CPU usage of a 100%.
Etotal = Econtr× Ncontr +Ecomp× Ncomp +Estorage× Nstorage +Eswitch× Nswitch +Erack× Nrack (8) Costpower= Etotal 1, 000× 24 × 30 × PKW (9) The total power draw is then used in Equation 9 to compute the cost of power in our infrastructure where PKW is the price of a KW of electricity.
d) Cooling: To cool the servers and all other devices, we consider both the cost of cooling equipment and the electricity necessary to power them. It is commonly admitted that close to all energy consumed by computing devices is converted to heat [7], [9]. As such, Equation 10 estimates the cost of the power required to cool down our infrastructure by multiplying the cost of power by a Cooling Factor L, as defined by Fichera et al. in [10].
Costcooling= NCRAC× PCRAC+ Costpower× L (10) where PCRAC is the price of a single CRAC, and where the number of CRAC NCRAC is given by
NCRAC = dEtotal/1, 000/CKWe (11) where CKW is the capacity of a single CRAC in KW. We fix L at 0.8, which seems to be a reasonable assumption for state of the art data centers [11], meaning that approximately 0.8W of power is required to dissipate 1W of heat.
e) Maintenance: The human cost of installing and main-taining the infrastructure is composed of two different costs. The first one is for regular and occasional interventions that require a technician to travel to the DC, which we estimate at the equivalent of a full day of pay for a technician each month. The second cost is for administrating the whole infrastructure, to which we assign a full-time engineer. Hence the maintenance cost depends on NDC the number of DCs in the infrastructure.
Costmaintenance= Cen/NDC+ Ctech (12) In Equation 12, Cen is the monthly cost of an engineer, and Ctechis a full day of pay for a technician, plus travel expenses. f) Facilities: This category of cost corresponds to build-ings and to devices that have the longest amortization period of 20 years: buildings, racks, cables and PDUs (bundled in racks). We compute a fixed real-estate price for buildings. The rest of the costs depends on the number of servers in our resource pool and on the number of switches to interconnect them. These costs also include the rack to host the servers and switches.
Costf acilities= Pbuilding× Am(Al)+ Nracks× Prack+ Nswitch× Pcables× Am(Am)
In Equation 13, Pbuildingis the real-estate cost (or rent) of the building hosting the DC, and Nswitchis given by Equation 7. This cost model is intended to work for any deployment, as classified in Subsection III-A. The next section demonstrates its versatility with three use-cases.
IV. USE-CASES
We now instantiate our model to analyze the cost of setting up a DC in three scenarios: a company that would decide to outsource management as much as possible (level 1), a NREN (level 3) and a Telco (level 5).
A. Cost analysis
Table IV presents the results of our cost analysis. We size each DC to host approximately 100 VMs that are equivalent to Amazon’s “m3.medium” instances (1 VCPU, 3.75 Gb of RAM and 4 GB of storage). These costs are to be compared to the 0.075e hourly fee for Amazon instances (54e per month); for 100 VMs, used over a full month, Amazon will bill 5,400e. For correctly computing maintenance costs per DC as given by Equation 12, we fix NDC at 10.
1) Instantiation over outsourced resources: We first instan-tiate our cost model for an actor renting resources hosted by providers in existing DCs. In this context, the facilities, power, cooling and maintenance costs are transparent: they will be charged as part of the monthly cost of resources. We have compared the offers of different French providers for similar server configurations and found CPU cores to be the scarcest resources of servers. From Table V, we have selected providers that offer a cost per core of 12.5e.
At current market cost, servers that satisfy (and exceed) our requirements are charged approximately 100e per month and allow to host 8 VMs. Thus, to host at least 100 VMs, we consider renting 14 servers per data center (13 for hosting VMs and one for hosting controller services). For storage, we start by renting an entry-level server with 48 TB of storage, a 6-core CPU and 64 GB of RAM for 320e a month. Applying Equations 1, 2 and 3, we estimate the cost of all servers to 1,720e per month.
These servers come with a default guaranteed bandwidth of 500 Mbps maximum. In case it is desirable to offer more bandwidth to customers, we can decide to rent 1 Gbps guaranteed bandwidth between our servers and the Internet. This option costs 250e per month and per server in our case. Table IV shows the costs with and without this option. In the second case, we account for this in our model by transferring this extra cost on servers to the network column.
Maintenance only accounts for a tenth of the cost of the engineer supervising the infrastructure. With this solution, we can host exactly 104 VMs (8 VMs per server × 13 servers) for 2,720e, which amounts to 26.15e per VM per month. With extra bandwidth this solution gives a cost per VM of 62.21e, higher than Amazon’s 54e. However, our scenario allows to offers guaranteed bandwidth for VMs (which Amazon does not) and to get revenue from storage. Amazon would charge about 1,500e per month for 48 TB of storage. Considering this charge, an Amazon VM would amount to 69e.
2) Instantiation over a NREN: We now consider the cost of installing a pool of resources in some of the POPs of a NREN. The POPs are all interconnected by (at least) a gigabit network. As such, we consider network traffic to be free: the additional traffic will comfortably fit in the overcapacity of the network and not have a significant impact on the current services. The cost of buildings is transparent because we focus on POPs hosted in universities.
To host 100 VMs per DC, we consider 10 servers (9 computes and 1 controller) featuring two 6-core CPUs, 48 Gb of RAM, two mirrored 500 Gb hard-drives and two Dual-port 10 Gb NICs. With this configuration, each VM has 1 VCPU, 4 Gb of RAM and 40 Gb of storage, which exceeds the “m3.medium” configuration from Amazon. An additional server per site is purchased to host the controller. We estimate this configuration around 3150e at current market price, and compute the monthly amortized cost of 525e per month per DC.
As for storage, we buy a server with 8 TB of storage per site, allowing to incrementally grow by adding servers when demand for storage grows. The storage server also features two 6-core CPU, 16 Gb of RAM and two Dual-port 10 Gb NIC, which can be purchased around 2,700e at current market price, leading to an amortized monthly cost of 45e.
Network traffic being free, we only account for the cost of connecting the new servers to the network, which requires 3 additional switches, according to Equation 7, which accounts 315e per month.
According to Equation 8, the resources we add to each POP is estimated at a total of 4,020 W. Further, we fix PKW the price of a KW of electricity at a reasonable 0.14e and apply Equation 9, which estimates the cost of power at 405e per month.
For cooling, a single CRAC of 6,500 W capacity can be bought for 4,700e, which amounts to 39e per month. Then we add the cost of powering the CRAC (the second factor in Equation 10), which amounts for 324e per month. Facilities amount to 44e per month. These costs include the rack to host the servers and switches (1,780e per rack) and cables (1,200e per switch); they are amortized over 10 years, according to Equation 13. Finally, the cost of maintenance is a full day of pay for an engineer plus travel expenses, which we estimate at 500e, in addition to the cost of supervision.
This scenario allows to host 108 VMs for 29.60e per VM per month, way below the cost of Amazon.
3) Instantiation over a Telecom Operator: Finally, we instantiate our model to compute the cost of deploying a DCC infrastructure for a Telecom Operator. As Table I suggests, the cost will be the same as for a NREN, except for infrastructure and network expenses: adding a micro/nano DC will require building the DC and bringing the backbone to it.
Regarding building expenses, we follow Church et al. that estimate this cost around 100K$ [2], which currently equals about 95Ke amortized over 20 years. For the cost of connect-ing the DC to the backbone network, Equation 14 gives the cost of connecting a new nano/micro DC to an access point
Facilities Servers Storage Network Power Cooling Maintenance Total Cost/VM Outsourced 0e 1,400e 320e 0e 0e 0e 1,000e 2,720e 26.15e Outsourced+BW 0e 1,400e 320e 3,750e 0e 0e 1,000e 6,470e 62.21e NREN 44e 525e 45e 315e 405e 363e 1,500e 3,197e 29.60e Telecom Operator 44e 525e 45e 1354e 405e 363e 1,500e 4,236e 39.22e TABLE IV
MONTHLY ESTIMATED COST FOR OPERATING ADCIN ADCCINFRASTRUCTURE AND COMPARISON OF THE COST OF AVMWITHAMAZON’S54e.
Provider Cores One server 1 Gbps Total Cost/VM2 OVH 8 100e 150e 250e 12.50e Online 12 150e N/A 150e 12.50e Netissime 12 135e N/A 134e 11.25e Amen 12 178e 60.20e 238e 14.83e TABLE V
COST COMPARISON OF MULTIPLEFRENCH PROVIDERS
depending on the distance D between the DC and said access point.
Costbackbone= D × Pkm (14) In France, the cost Pkm of deploying a black fiber over a kilometer is 65Ke in average. In dense areas, we assume that a network access point will be less than 5km away from the DC, hence leading to a maximum backbone cost of 325Ke, which amounts to 1,354e per month.
This scenario, which requires the most expensive invest-ment, amounts to a monthly cost of 4,236e for 108 VMs, or 39.22e per VM.
4) Discussion: It seems that all actors that fall into the three scenarios that we have instantiated will be able to compete with AWS prices (comparing the last column of Table IV with Amazon’s 54e per month for an equivalent VM). At this game, NRENs seem to be the best players, but this situation seems unfair in the sense that for NRENs many costs are supported by universities. Similarly, the approach is more viable for a telecom operator that would only use existing POPs instead of building new ones. Moreover, for several actors on our scale, reusing facilities for other services e.g., providing Internet services or renting spare room in DCs, can be an additional source of revenue.
In all scenarios, maintenance represents an important cost; however, increasing the number of VM will reduce the cost of maintenance per VM. To this end, we can either increase the number of DCs or increase the number of VMs per DC. In our case, with 10 DCs, this cost represents 10e per VM. From 20-30 DCs, this cost will be negligible.
Another consideration is that the infrastructures built by the different actors have different characteristics (we study them in the next subsection). Some of these characteristics will be turned into features (e.g., reduced latency, reduced communication cost between DCs, green energy use) that once monetized may counterbalance some of the cost discrepancies we observed. For example, an outsourced solution is more viable when guaranteed bandwidth and storage are monetized. Thus, it seems that most deployment scenario allow to host VMs at a cost inferior to the price of Amazon’s VMs, and that the viability of deploying a DCC infrastructure strongly
depends of a particular actor’s assets. Nonetheless, the choice of how to do it will also be guided by the properties that are expected from the resulting infrastructure.
V. CONCLUSION ANDFUTUREWORK
Distributing cloud computing infrastructures is a promising solution to face legal issues, for latency-critical applications, for availability and for optimal use of networks. Leaving the benefits of this approach aside, the question of the economical viability remains. To address the question of who could deploy a DCC infrastructure and at what cost, we proposed a classi-fication of possible actors in the DCC market and a detailed cost model for providing virtual machines in nano/micro data centers near the edge of the Internet. We instantiated the cost model for three representative actors and compared the result to the price charged by Amazon for similar appliances. We found the approach to be viable under some conditions, and that design choices have an effect on different properties of the resulting infrastructure e.g., elasticity, PUE, resiliency.
This work opens perspectives for the commercialization of DCC, allowing potential actors to develop cost models that account for the novel services these infrastructures will offer.
REFERENCES
[1] J. V. H. Gary Cook, “How dirty is your data?” Greenpeace International Report, 2013.
[2] K. Church, A. Greenberg, and J. Hamilton, “On Delivering Embarrass-ingly Distributed Cloud Services,” in HotNets, 2008.
[3] A. Greenberg, J. Hamilton, D. A. Maltz, and P. Patel, “The Cost of a Cloud: Research Problems in Data Center Networks,” SIGCOMM Comput. Commun. Rev., vol. 39, no. 1, pp. 68–73, Dec. 2008. [4] A. L`ebre, J. Pastor, and . The DISCOVERY Consortium, “The
DISCOVERY Initiative - Overcoming Major Limitations of Traditional Server-Centric Clouds by Operating Massively Distributed IaaS Facilities,” Inria Rennes Bretagne Atlantique, Research Report RR-8779, Sep. 2015. [Online]. Available: https://hal.inria.fr/hal-01203648 [5] I. Narayanan, A. Kansal, A. Sivasubramaniam, B. Urgaonkar, and
S. Govindan, “Towards a leaner geo-distributed cloud infrastructure,” in Proceedings of the 6th USENIX conference on Hot Topics in Cloud Computing. USENIX Association, 2014, pp. 3–3.
[6] T. Thanakornworakij, R. Nassar, C. B. Leangsuksun, and M. Paun, “An economic model for maximizing profit of a cloud service provider,” in Seventh International Conference on Availability, Reliability and Security, ser. ARES, Aug 2012, pp. 274–279.
[7] X. Li, Y. Li, T. Liu, J. Qiu, and F. Wang, “The method and tool of cost analysis for cloud computing,” in IEEE International Conference on Cloud Computing, 2009, ser. CLOUD ’09, Sept 2009, pp. 93–100. [8] J. Liu, M. Goraczko, S. James, C. Belady, J. Lu, and K. Whitehouse,
“The Data Furnace: Heating up with Cloud Computing,” in Proceedings of the 3rd USENIX conference on Hot topics in cloud computing, ser. HotCloud’11, 2011, pp. 15–15.
[9] N. Rasmussen, “Calculating total cooling requirements for data centers,” White Paper, vol. 25, pp. 1–8, 2007.
[10] R. Fichera, L. Koetzle, and T. Powell, “Power and cooling heat up the data center,” Forrester Research, 2006.
[11] C. D. Patel and A. J. Shah, “Cost model for planning, development and operation of a data center,” 2005.