HAL Id: hal-01204751
https://hal-univ-rennes1.archives-ouvertes.fr/hal-01204751
Submitted on 24 Sep 2015
HAL is a multi-disciplinary open access
archive for the deposit and dissemination of
sci-entific research documents, whether they are
pub-lished or not. The documents may come from
teaching and research institutions in France or
abroad, or from public or private research centers.
L’archive ouverte pluridisciplinaire HAL, est
destinée au dépôt et à la diffusion de documents
scientifiques de niveau recherche, publiés ou non,
émanant des établissements d’enseignement et de
recherche français ou étrangers, des laboratoires
publics ou privés.
Arrays Mounted on PCBs
Abdullah Haskou, Sylvain Collardey, Ala Sharaiha
To cite this version:
Abdullah Haskou, Sylvain Collardey, Ala Sharaiha. Measuring Superdirective Electrically Small
An-tenna Arrays Mounted on PCBs. Microwave and Optical Technology Letters, Wiley, 2015, 57 (10),
pp.2269-2274. �10.1002/mop.29363�. �hal-01204751�
Measuring Superdirective Electrically Small Antenna
Arrays Mounted on PCBs
Abdullah Haskou, Sylvain Collardey and Ala Sharaiha
IETR UMR CNRS 6164- Université de Rennes 1, Rennes, France
abdullah.haskou@univ-rennes1.fr, sylvain.collardey@univ-rennes1.fr, ala.sharaiha@univ-rennes1.fr
Abstract—This paper addresses the problem of measuring
superdirective Electrically Small Antennas (ESAs) mounted on Printed Circuit Broads (PCBs). Different configurations for con-necting the excitation system (SMA connector and coaxial cable) to an array of 31× 25mm2integrated in a PCB of 110× 70mm2 are studied. This configurations are evaluated based on the cable effect on the array’s input reflection coefficient and radiation pattern. Obtained results show that properly connecting the cable with the array mitigates its effect, and hence, it can be measured.
Keywords—Superdirectivity, PCB, current distribution, directiv-ity, cable effect
I. INTRODUCTION
Recent wireless technologies require compact-size antennas. However, Electrically Small Antennas (ESAs) have low effi-ciencies and omni-directional radiation patterns. Consequently, ESAs are not easy to be measured due to the severe effect of the coaxial cable, even though such a cable may not be present in the final application of the antenna. A poorly balanced antenna can result in common mode currents flowing on the feeding cable surface, which radiates and distorts the true radiation pattern of the Antenna Under-Test (AUT) [1]. There have been many reports about the influence of the coaxial cable on measured characteristics of ESAs (refer to [2] and the references therein). Furthermore, superdirective ESAs add the additional challenge of maintaining the superdirective pattern with the presence of the coaxial cable. This problem was highlighted in multiple works [3-5].
This paper investigates measuring superdirective ESAs mounted on PCBs. Even though, the array with the PCB is not electrically small, simulation and measurement results show that the effect of the excitation system (SMA connector and coaxial cable) can be severe. These results also show that this effect can be minimized and hence, the array can be easily measured.1
The rest of the paper is organized as follows: section II presents the simulation results. The results are validated via measurements in section III. Finally, section V provides some concluding remarks.
1This work was done with the funding of the French National Research
Agency as part of the project "SOCRATE" and the support of the "Images et Reseaux" cluster of Brittany region, France.
II. SIMULATION ANDRESULTS
A. Reference Scenario
In a previous work we presented a method for designing superdirective ESAs [5]. This method was used to design a parasitic two-element superdirective ESA on a PCB for the 837M Hz frequency band. The unit-element used in this array is a miniaturized printed spiral antenna excited with a coplanar transmission line [7]. The unit-element is printed on FR4 substrate and it has total dimensions of 25× 14.3 × 0.8mm3.
The inter-element distance is set to 16.7mm(0.05λ), hence, the array initial dimensions are 31× 25 × 0.8mm3 and it is integrated in a PCB with total dimensions of 110× 70mm2.
Figure 1 shows the array geometry and surface current dis-tribution.2 The figure shows that the current on the two
elements is directive and out of phase (which is the condition for having a superdirective radiation pattern for very small inter-element distances). The array simulated input reflection coefficient is given in Figure 11 and it shows that the array is impedance matched at 837M Hz.3Figure 2 illustrates the array
3D directivity radiation patterns at the resonance frequency. The figure reveals a superdirective radiation pattern with a maximum total directivity of 7.2dBi. The figure also shows that the co-polar directivity is comparable to total directivity with a maximum of 7.2dBi, while the cross-polar directivity is negligible with a maximum of−2.9dBi. The array 2D total directivity radiation patterns are given in Figure 12. The Half Power Beamwidth (HPBW) in horizontal and vertical planes (XOY and XOZ) are respectively 74oand 108o and the Front to Back Ratio (FBR) is equal to 6.1dB. In the following section we will investigate different geometries for connecting the excitation system to this antenna for the measuring process.
2In order to facilitate the comparison between the different scenarios, the
same color-bar scale (0− 10[Amp/m]) is used for all cases.
Fig. 1. Antenna geometry and surface current distribution in the reference scenario.
Fig. 2. Simulated 3D directivity radiation pattern in reference scenario. (a) Total, (b) co-polar and (c) cross-polar.
B. Scenario One
In this scenario, the excitation system is directly connected to the array driven element as shown in Figure 3. Due to the excitation proximity to the radiating element the cable radiation affects the array radiation pattern. Hence, the array has equal radiation in both end-fire directions. Figures 11 compares the array input reflection coefficient in this scenario to the reference scenario one. As it can be noticed, the array original resonance frequency of 837M Hz did not change. Figure 4 shows the array directivity radiation patterns. The figure shows that the superdirectivity effect is disturbed and the array maximum total directivity is reduced to 5.7dBi. The figure also shows that the array co-polar directivity is reduced to 5.1dBi while the cross-polar one is augmented to 1dBi. The HPBW in horizontal and vertical planes are respectively 82o and 106o and the FBR is equal to 3.2dB (Figure 12).
Fig. 3. Antenna geometry with the excitation system in scenario one.
Fig. 4. Simulated 3D directivity radiation pattern in scenario one. (a) Total, (b) co-polar and (c) cross-polar.
C. Scenario Two
In order to reduce the the excitation system effect, the array excitation is extended to the extreme-side of the PCB where a minimal surface current distribution is observed. Figure 5 shows that the current distribution is maximal around the excitation line and the slot between the two ground planes. On the other side, the rest of the ground plane has negligible contribution in the array radiation. Figure 11 shows that the array resonance frequency is shifted to 835M Hz and its matching is lost. This can be attributed to the high coupling between the slot between the two PCB parts and the excitation line, which results in changing the characteristic impedance of the coplanar excitation line. Figure 6 shows that the array superdirective radiation pattern is also lost and the array has a maximum total directivity of 3.7dBi. The figure also shows a comparable co-polar and cross-polar directivity (about 2.5dBi). The HPBW in horizontal and vertical planes are respectively 322o and 208o and the FBR is equal to 2.1dB (Figure 12).
Fig. 5. Antenna geometry with the excitation system in scenario two.
Fig. 6. Simulated 3D directivity radiation pattern in scenario two. (a) Total, (b) co-polar and (c) cross-polar.
D. Scenario Three
In this scenario, the array excitation line is extended to the left-side of the PCB where also a minimal current distribution on the array surface is observed. Figure 7 shows the array geometry in this scenario and the surface current distribution. The Figure shows that the current distribution is approximately the same as in the reference scenario. Consequently, the cable radiation is mitigated and the array both input reflection coeffi-cient and radiation pattern are preserved. Figure 11 shows that the array original resonance frequency of 837M Hz is shifted to 840M Hz. Furthermore, Figure 8 shows that the array is superdirective with a maximum total directivity of 6.8dBi. The array co-polar directivity is 6.6dBi while the cross-polar one is−1dBi. The HPBW in horizontal and vertical planes are 76o and 110o respectively and the FBR is equal to 6.4dB (Figure 12).
Fig. 7. Antenna geometry with the excitation system in scenario three.
Fig. 8. Simulated 3D directivity radiation pattern in scenario three. (a) Total, (b) co-polar and (c) cross-polar.
E. Scenario Four
This scenario is similar to the previous one, however, a hor-izontal the excitation system is connected to the array. Figure 9 shows the array geometry and surface current distribution. The figure also shows that the current distribution is similar to the reference scenario’s one. Hence, as it can be noticed from Figure 10 the array original superdirective radiation pattern is maintained with a maximum total directivity of 6.8dBi. It can also be noticed that the array co-polar directivity is about 6.8dBi while the cross-polar one is about−1dBi. The HPBW in horizontal and vertical planes are respectively 72oand 118o and the FBR is equal to 6.8dB (Figure 12). Figure 11 shows that the array resonance frequency is shifted to 841M Hz.
Fig. 9. Antenna geometry with the excitation system in scenario four.
Fig. 10. Simulated 3D directivity radiation pattern in scenario four. (a) Total, (b) co-polar and (c) cross-polar.
800 820 840 860 880 −30 −25 −20 −15 −10 −5 0 Frequency [MHz] S11 [dB] Ref. Scen. Scen. 1 Scen. 2 Scen. 3 Scen. 4
Fig. 11. Simulated input reflection coefficient magnitude for all scenarios.
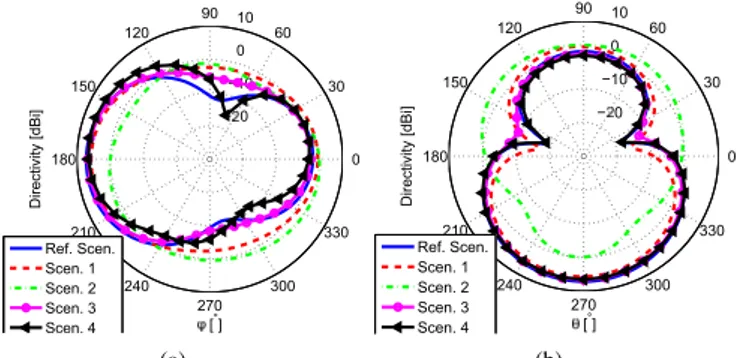
− 0 −10 0 10 30 210 60 240 90 270 120 300 150 330 180 0 [°] D ire ct ivi ty [d Bi ] Ref. Scen. Scen. 1 Scen. 2 Scen. 3 Scen. 4 (a) − 0 −10 0 10 30 210 60 240 90 270 120 300 150 330 180 0 [°] D ire ct ivi ty [d Bi ] Ref. Scen. Scen. 1 Scen. 2 Scen. 3 Scen. 4 (b)
Fig. 12. Simulated 2D total directivity radiation pattern for all scenarios. (a) Horizontal plane and (b) vertical plane.
III. RESULTSVALIDATION VIAMEASUREMENTS
To validate the simulation results, prototypes of scenarios one, three and four were fabricated and measured. Photographs of the prototypes are given in Figure 13. The measured input reflection coefficient for different scenarios is given in Figure 14. The obtained resonance frequencies are in very
good agreement with simulated ones. A difference less than 2% is noticed for all scenarios. This difference is probably due to the dispersion of the commercial SMD loads. The measured resonances are wider than the simulated ones while the measured resonances are weaker than the simulated ones. This can be due to higher dielectric losses in measurement than simulation . The 3D far-field radiation patterns are measured in SATIMO stargate (SG 32) near-field measurement system and shown in Figure 15. There is a good agreement with the simulation results in the main beam direction. The difference in the backward direction can be attributed to the measuring system and environment. The measured HPBW in horizontal and vertical planes are respectively 84oand 118o for scenario one, 79o and 136o four scenario three and 68o and 89o for scenario four. The maximum total directivity for the three scenarios are respectively 5.6dBi, 5.9dBi and 7.3dBi. Finally, Figure 16 shows the measured 3D total directivity radiation patterns for scenarios one, three and four.
(a) (b) (c)
Fig. 13. Photographs of the fabricated prototypes. (a) Scenarios one, (b) scenarios two and (c) scenarios three.
800 810 820 830 840 850 860 870 −14 −12 −10 −8 −6 −4 −2 Frequency [MHz] S11 [dB] Scen.1 Scen.3 Scen.4
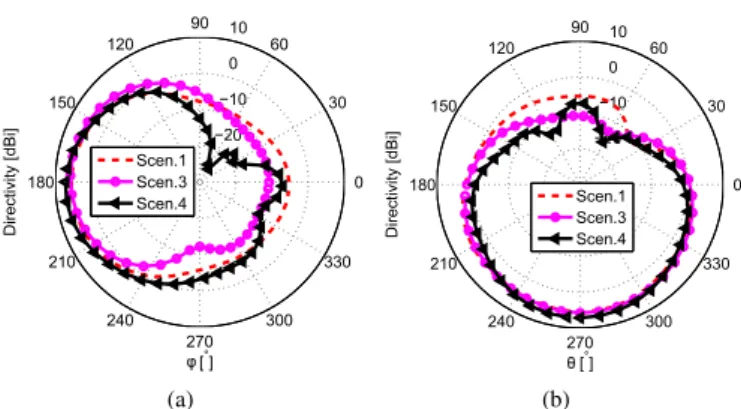
Fig. 14. Measured input reflection coefficient magnitude for different scenarios. − 0 −10 0 10 30 210 60 240 90 270 120 300 150 330 180 0 [°] D ire ct ivi ty [d Bi ] Scen.1 Scen.3 Scen.4 (a) − 0 −10 0 10 30 210 60 240 90 270 120 300 150 330 180 0 [°] D ire ct ivi ty [d Bi ] Scen.1 Scen.3 Scen.4 (b)
Fig. 15. Measured 2D total directivity radiation pattern for different scenarios. (a) Horizontal plane and (b) vertical plane.
Fig. 16. Measured 3D total directivity radiation patterns for different scenarios. (a) Scenario one, (b) scenario three and (c) scenario four.
Table I lists the antenna simulated and measured resonance frequency (fc) and maximum total directivity (Dmax) for all scenarios.
TABLE I. ASUMMARY OF THE SIMULATED AND MEASURED RESULTS.
Scenario Simulation Measurement
fc[M Hz] Dmax[dBi] fc[M Hz] Dmax[dBi]
Reference 837 7.2 - -One 837 5.7 818 5.6 Two 835 3.7 - -Three 840 6.8 830 5.9 Four 841 6.8 832 7.3 IV. CONCLUSION
In this paper, measuring superdirective ESAs integrated in PCBs was investigated. Different scenarios for connecting the excitation system to the antenna were evaluated. The obtained results showed that a proper connection of the excitation system can reduce its negative effects, and hence, the antenna can be measured.
REFERENCES
[1] J. T. Bernhard, J. J. Adams, M. D. Anderson, and J. M. Martin, Measuring electrically small antennas: details and implications, IEEE International Workshop on Antenna Technology (iWAT 2009), pp.1,4, 2-4 March 2009.
[2] P. J. Massey, and K. R. Boyle, Controlling the effects of feed cable in small antenna measurements, 12th International Conference on Antennas and Propagation (ICAP 2003), Vol. 2, pp.561,564, 31 March-3 April 2003.
[3] B. Sentucq, A. Sharaiha, and S. Collardey, Superdirective metamaterial-inspired electrically small antenna arrays, 7th European Conference on Antennas and Propagation (EuCAP 2013), pp.151,155, 8-12 April 2013. [4] M. Pigeon, A. Sharaiha, and S. Collardey, Miniature and superdirective two elements endfire antenna array, 8th European Conference on Antennas and Propagation (EuCAP 2014), 6-11 April 2014.
[5] A. Haskou, A. Sharaiha, S. Collardey, M. Pigeon, and K. Mahdjoubi, A design methodology for electrically small superdirective antenna arrays, 2014 Loughborough Antennas and Propagation Conference (LAPC 2014), 10-11 November 2014.
[6] ANSYS HFSS, Pittsburg, PA 15219, USA.
[7] B. Jannier, M. A. C. Niamien, A. Sharaiha, and S. Collardey, DVB-T reception test with ultra miniature CPW antenna, 5th European Con-ference on Antennas and Propagation (EuCAP 2011), pp.1842,1845, 11-15 April 2011.