Introduction
Cochlear implants (CIs) are advanced hearing aids with an electrode that is directly placed in the cochlea, and that electrically stimulates the auditory nerve. CIs are indicated for profoundly deaf persons, and provide acoustic information that sometimes enables use of the telephone.1 Many studies have documented improvement in auditory discrimi-nation and speech intelligibility after CI implantation.2-4 This improvement largely depends on the age of the recipient at implan-tation and their mode of commu-nication. The earlier patients are implanted, the better the results.5-11 Several years of audio-phonatory training are mandatory to obtain optimal gain in auditory percep-tion and speech ability.3,8
This study retrospectively com-pares speech perception skills and
the evolution of auditory capacity and speech intelligibility of con-genitally deaf children who have been fitted with either a CI or a conventional hearing aid (HA).
Materials and methods
1. Population characteristics All children in the study were fol-lowed by the multi-disciplinary team of the Centre Médical d’Audiophonologie, Montegnée-Liège, Belgium.The study con-sists of a sample of 36 children with very severe 2nd or 3rd degree deafness. According to the Bureau International d’Audiophonologie (BIAP),12a very severe 2nd degree deafness is defined as a a pure tone hearing loss (average at 500, 1000, 2000, and 4000 Hz in dB re normal hearing level – ISO stan-dards) between 101 and 110, and a very severe 3rddegree deafness is
defined as a loss between 111 and 120. They all received audio-phonological training during one-hour per day. The deafness was congenital and stable for 35 chil-dren and progressive for one child. The origin of deafness was genet-ic in 39%, viral in 11%, syndro-mal in one case (2%), and unknown in 48% of the cases.The subjects’ parents were French-speaking (76%), or are Arabic- or Turkish-speaking (19%). The par-ents of two of the subjects were also congenitally deaf, and used only sign-language. All the 36 children were fitted with a con-ventional hearing aid (HA) and received audio-phonological train-ing since the age of two. In our retrospectively studied sample, fourteen children kept their con-ventional HA (HA group) while twenty-two children switched to a CI (CI group). At the moment of retrospective analysis, the mean
Speech discrimination and intelligibility: outcome of deaf children fitted with
hearing aids or cochlear implants
B. Lejeune* and L. Demanez*, **
*Centre Médical d’AudioPhonologie, Montegnée-Liège, Belgium; **Department of Otorhinolaryngology, CHU Sart Tilman, Liège, Belgium
Key-words. Child; deafness; cochlear implant; speech intelligibility; speech perception; outcome
Abstract. Speech discrimination and intelligibility: outcome of deaf children fitted with hearing aids or cochlear
implants. We retrospectively studied outcome of a sample of 36 congenitally deaf children who were fitted with either a
conventional hearing aid (HA, N = 14) or a cochlear implant (CI, N = 22), and who received many years of audio-phona-tory training by our multi-disciplinary team. In order to rate speech discrimination perception, we developed a new met-ric of speech discrimination performance based on several existing discrimination tests for the French language. Speech perception skills were measured with and without lip-reading cues. We also studied the evolution of auditory capacity in real-life situations, and the evolution of the intelligibility of spoken language during a five year period. To rate auditory capacity and speech intelligibility, we used commonly used metrics: CAP and SIR. During the five successive years of observation, CAP and SIR scores improve for both the HA and CI children. Improvement, however, is more pronounced for the CI children. At the end of the 5-years period, CAP and SIR scores of CI children are significantly higher than those of HA children. Our study is one of few that evaluates outcome of HA and CI fitting with age matched congeni-tally deaf children anno 2000.
age of the HA group was 9 years (range 3-14 years; SD: 3.44), and of the CI group 7 years (range 3-14 years; SD: 3.36). The differences in ages of the two groups were not statistically significant (Mann-Withney test: P = 0.1). In the HA group, 8 children had a very severe 2nddegree deafness, and 6 children a very severe 3rd degree deafness. In the CI group, 6 children had a very severe 2nd degree deafness, and 16 children a very severe 3rd degree deafness. The differences in degree of hearing loss of the two groups were not statistically sig-nificant (c2 = 2.08, P = 0.15). The mean duration of audio-phonatory training was 95 ± 38 months for the HA group and 66 ± 44 months for the CI group (Mann-Withney test: P = 0.03).
At the moment of retrospective analysis, the time after CI activa-tion was 5 years for four children, 4 years for seven, 3 years for seven, and 2 years for four chil-dren. Children were implanted with the Nucleus 24 (N = 20), or Nucleus 22 (N = 2) multichannel device (Cochlear Ltd, Sydney, Australia). The coding strategy was either Advanced Combined Encoder (ACE) (N = 19) or Spectral peak (SPEAK) (N = 3). The stimulation mode was always monopolar except for one case where common ground stimula-tion was used.
Up to the age of four, psycho-motor development of all children was evaluated using the Guide Portage d’Intervention Précoce.13 All children had a psycho-motor age equivalent to their actual age. After the age of four, intelligence quotient (IQ) was measured with the Wechsler Intelligence score for children (WISC III) or the Wechsler intelligence score for preschool children (WIPPSI).
The average performance IQ levels of children in the HA group and CI group were 100 (SD: 19) and 104 (SD: 13), respectively. The differences in IQ level of the two groups were not statistically significant (Mann-Whitney test: P = 0.7).
2. Outcome measurements Speech discrimination skills The primary outcome measure for any type of auditory prosthesis is the score on a speech discrimina-tion task. At the moment of retro-spective analysis, we tested speech discrimination skills of all the children using five speech dis-crimination tests. At the time of these tests, the children fitted with a CI had activated implants for a variable duration ranging from 1 to 87 months, with an average of 19 months. The tests were con-ducted by the patient’s own speech therapist in the quiet atmosphere of the familiar re-edu-cation room. The therapist’s voice was at roughly 60 dB SPL, and the patient’s CI or HA was switched on. The words and sentences were presented twice as an open list, first without and next with lip-reading. The first test consisted of 10 bi-syllabic words from the Boorsma14children’s list. The sec-ond test contained twelve words of 1, 2 or 3 syllables from the Speech Perception and Intelli-gibility Evaluation Test (Test d’Evaluation des Perceptions et de la Production de la Parole [TEPPP]).15For this test, the score represents the percentage of cor-rectly recognized words.
A third test consisted of a list of 50 mono-syllabic words taken from the Lafon cochlear lists.16 Each mono-syllable had one char-acteristic phoneme and the score
represented the percentage of cor-rectly recognized characteristic phonemes.
Two final speech discrimination tests used a series of sentences from the French TEPPP. Ten sen-tences of 3 to 4 words were classi-fied as simple (Subject-Verb; total = 32 words) and twenty sentences of 6 to 8 words were classified as complex (Subject-Verb-Comple-ment; total = 114 words). The score on these tests was the per-centage of correctly recognized words. The speech discrimination score that we report in our study is the average of the performance, expressed in percentage, on the five speech discrimination tests. All tests were presented with and without lip-reading, yielding to corresponding scores. The differ-ence between these scores of each subject is the gain due to lip-read-ing.
Category of auditory performance (CAP)
In addition to an evaluation of speech perception skills at the moment of retrospective analysis, data were available as to track a child’s auditory development over many years. We rated auditory development using the CAP score. The CAP score provides an ordi-nal scale of auditory receptive abilities. It is intended to reflect the real-life progress of children in the developing use of audition, and it is widely used in studies of audi-tory perception.17,18Through obser-vation of the subject’s behaviour, the CAP evaluates perception of both environmental sound and speech on an eight-point scale: 1. No awareness of
environmen-tal sound. In spite of wearing appropriately fitted hearing aids, the child does not respond to any environmental sound.
2. Awareness of environmental sound. The child responds to environmental sounds in at least four situations.
3. Responds to speech sounds (e.g. “Go”). The child consis-tently performs a response to a spoken signal (e.g. “Go”, “Boo”) with vocalizations at a conversational sound level. 4. Identifies environmental
sounds. The child consistently identifies a range of environ-mental sounds at home and/or at school, and is able to moni-tor his environment via audi-tion.
5. Discrimination of some speech sounds without lip-reading. The child is able to discrimi-nate any combination of Ling’s five sounds.
6. Understands common phrases without lip-reading. The child is able to identify (without lip-reading) common phrases in a familiar context (e.g. “What’s your name?”, “Where is Mummy?”).
7. Understands conversation without lip-reading. The child is able to hold a conversation in a quiet situation and without lip-reading, with a familiar speaker.
8. Can use the telephone with a known speaker. The child is able to hold a conversation with a known speaker about a familiar topic, without commu-nication breaking down. Speech intelligibility rating (SIR) Another important determinant of outcome of auditory prosthesis in congenitally deaf children is the quality of their spoken language. Intelligible speech is a hope of many parents submitting their children for cochlear implanta-tion. The SIR was developed in
1989 and intended as a framework to rank a child’s spontaneous speech into one of five categories. SIR was designed as a time-effec-tive global outcome measure of speech production in real-life situ-ations. The SIR is scored by the child’s speech and language thera-pist and includes five categories: 1. Connected speech is
unintelli-gible. Pre-recognisable words in spoken language, the prima-ry mode of communication may be manual.
2. Connected speech is unintelli-gible. Intelligible speech is developing in single words when context and lip-reading cues are available.
3. Connected speech is intelligi-ble to a listener who concen-trates and lip-reads.
4. Connected speech is intelligi-ble to a listener who has a little experience of a deaf person’s speech.
5. Connected speech is intelligi-ble to all listeners. The child is understood easily in everyday contexts.
Annually for the five years pre-ceding our retrospective analysis, the children of the HA group were rated according to the CAP and SIR scales. The children of the CI group were evaluated at the time of prosthesis activation, and after 1, 2, 3, 4 and 5 years.
The correlation between audito-ry discrimination scores were evaluated by the Spearman’s rank test. Auditory discrimination, CAP and SIR scores of the HA and IC groups were compared using the Mann-Whitney rank sum test, and within each group by the Friedman’s ANOVA or the Wilcoxon tests. A P-value of < 0.05 was accepted as signifi-cant.
Results
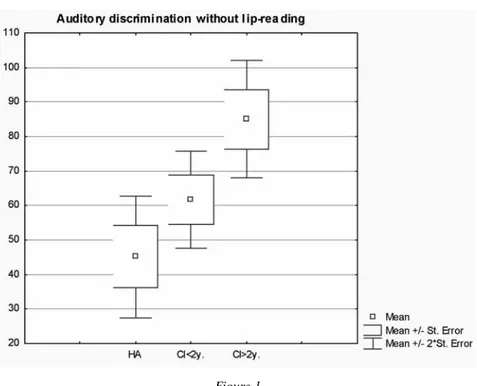
Figure 1 plots our auditory dis-crimination measure (see Methods) without lip-reading cues for three groups of children with their devices connected and obtained at the moment of retro-spective analysis. In the HA group, children reach an average discrimination score of about 45% (SD = 17). When compared to the HA group, the CI group as a whole reaches higher discrimina-tion scores. Children of the CI group were categorized according to the time after implantation: less or more than two years of implan-tation. Children who had less than two years of experience with their implant perform worse (62%) than those with more than two years of experience (86%), but better than the HA group. Differences between groups were highly sig-nificant. Note that our measure of auditory discrimation is the aver-age of different well known dis-crimination measures. For each child, performance for the individ-ual tasks was highly correlated (Spearman’s rank correlatio).
Figure 2 plots auditory discrim-ination performance with lip-read-ing cues for the HA and CI group. Obviously, auditory discrimina-tion improves when lip-reading cues are available. Interestingly, the HA group derives more bene-fit from the lip-reading cues than the CI group. Thus, at least for the type of vocal material used in this study, the advantage of lip-reading is less marked for CI-fitted sub-jects: CI: 12.4 ± 5.7 vs. HA: 22.0 ± 16.3; P = 0.03.
Figure 3 shows the evolution of the CAP (see Methods) with increasing time of fitting for the HA and CI group. Before fitting, the CAP scores are higher for HA
(3.4) than for CI (2.6) children. This difference, however, is not significant. When experience with the fitted device increases, CAP scores increase (P < 0.05 Friedman’s ANOVA). The increase is larger for the CI group (from 2.6 to 6.1) than for the HA group (from 3.4 to 4.4). The HA and CI group, moreover, show a different pattern of CAP score increase. For the CI group, CAP gain is large after implantation, and then slowly increases. For the HA group, CAP score increase is marginal during the first year of fitting, and then steadily improves.
Figure 4 shows the evolution of the SIR (see Methods) score for the HA and CI group. For the SIR scores of the HA group, the pro-gression is of border-line signifi-cance (1.9 ± 1.4 vs. 2.3 ± 1.2, n = 14; p = 0.04). The progression is highly significant in the CI group (1.5 ± 1.1, n = 22 vs. 3.5 ± 1.2, n = 11; p = 0.008), where it is quasi-linear and reaches a significant level each year during the first three years (p = 0.008, 0.001 and 0.03 respectively). After three years of fitting, the CAP and SIR scores are significantly higher for CI subjects. The most significant difference is observed in the CAP (CI: 6.00 ± 1.9, n = 18 vs. HA: 4.1 ± 2.1, n = 14, p = 0.008). The dif-ference observed in the SIR is pre-sent but just significant (CI: 3.00 ± 1, n = 12 vs. HA: 2.2 ± 1.2, n = 14, p = 0.05).
Discussion
In the tests with and without lip-reading (Boorsma’s and Lafon’s words, words, simple and com-plex sentences from the TEPPP), the CI children perform signifi-cantly better than their peers with 2nd and 3rd degree severe deafness Figure 1
Boxplots showing auditory discrimination performance without lip-reading for subjects fitted with hearing aids (HA) (N = 14), with cochlear implants and less than two years of experience (CI < 2y) (N = 12), and with cochlear implants for more than two years (CI > 2y) (N = 7).
Figure 2
Boxplots showing auditory discrimination performance with lip-reading for subjects fitted with hearing aids (HA) (N = 14), with cochlear implants and less than two years of experience (CI < 2y) (N = 12), and with a cochlear implant for more than two years (CI > 2y) (N = 7).
who use conventional hearing aids. At the time of auditory dis-crimination testing, CI had been activated for a variable number of months. Duration of CI activation is also an important determinant of outcome as illustrated by the fact longer experience with the CI increases discrimination perfor-mance (Figures 1,2).
The difference in scores with and without lip-reading represents the gain from lip-reading. This gain is less marked for CI-fitted children. This result requires care-ful interpretation. HA subjects obtained lower discrimination scores. They are therefore likely to take more advantage of lip-read-ing, although without reaching the scores obtained without lip-read-ing by subjects fitted with CI for over 2 years.
At the start of the observation, HA children present CAP and SIR scores slightly higher than those obtained by CI children. These slightly higher scores may have been influenced by the fact that the HA children are on average slightly older and less deaf than the CI children. During the five-year observation period, the CAP and SIR scores progress slowly but to a significant degree in HA children. This progress is more pronounced in CI children. For auditory performance scores, the greatest improvement takes place during the first year. The speech intelligibility criterion evolves quasi-linearly.
From the literature10,11 it is known that significant improve-ment of speech perception is most apparent during the first year after CI activation. Such a spectacular increase in auditory discrimina-tion is not observed for subjects with a conventional hearing-aid. Audio-phonatory work has to be Figure 3
Boxplots showing the evolution of the Category of Auditory Performance (CAP) for subjects fitted with conventional hearing aids (HA) (n = 14) or cochlear implanst (CI) before implantation (CI-0), and at one (CI-1), two (CI-2) (N = 22), three (CI-3) (N = 18) four (CI-4) (N = 11) and five (CI-5) (N = 4) years later.
Figure 4
Boxplots showing the evolution of the Speech Intelligibility Rate (SIR) for subjects fit-ted with conventional hearing aids (HA) (N = 14) or cochlear implants before implan-tation (CI-0), and at one (CI-1), two (IC-2) (N = 22), three (IC-3) (N = 18) four (IC-4) (N = 11) and five (IC-5) (N = 4) years later.
pursued in order to help these ado-lescents to combine visual infor-mation with their auditory dis-criminatory competence.
For CI subjects, the audio-phonatory work remains essential. The increase in auditory compe-tence is several months in advance of intelligibility improvement (compare Figure 3 and Figure 4). The average age of CI implanta-tion of the subjects in this study is 7 years. In a few years, evaluation of subjects implanted at an earlier age will allow comparison of early versus late acoustic and audio-phonatory stimulation.
Note that current policy is to implant a CI before the age of 1.5 years. In the future, it will become increasingly difficult to compile a study of hearing out-come with a HA or CI of groups with equivalent age and hearing loss. However, considering the technical improvements of cochlear implants and the increas-ingly earlier detection of hearing loss, comparison between cochlear implants and convention-al prostheses will soon be out of the question in any case.
It is only after several years that the children can reveal, by what they express, all the auditory information they have gradually assimilated. The authors are there-fore convinced that visual and gestural forms of information have their place throughout the process of constructing speech, language and identity. Moreover, a child develops language through its need for communication and not solely because it perceives auditory information.
Conclusion
We studied congenitally deaf chil-dren with normal intelligence, no
other diseases, and under the care of a specialised multidisciplinary team. They received regular audio-phonatory training over several years. Although all the children with very severe hearing impairment have followed the same audio-phonatory training, those fitted with cochlear implants perform better than those using so-called conventional stereo-phonic prostheses. The cochlear implants provide auditory infor-mation, which enables children to develop speech perception and intelligible spoken language. The results of our children are in line with other published data.
Acknowledgement
We wish to thank Professor Jean-Pierre Demanez and an anonymous reviewer for their critical comments to this study.
References
1. Demanez L, Renglet T, Bernard C, Vanderheyden C, Demanez JP. Cochlear implants [in French]. Rev
Med Liege. 2000;55:833-838.
2. Uziel AS, Reuillard-Artieres F, Sillon M, et al. Speech perception performance in prelingually deafened children with the nucleus multichan-nel cochlear implant. Adv
Otorhino-laryngol. 1995;50:114-118.
3. Allen MC, Nikolopoulos TP, O’Donoghue GM. Speech intelligibil-ity in children after cochlear implan-tation. Am J Otol. 1998;19:742-746. 4. Cochard N, Vidal MF, Baciocchi D,
Cormary X, Honegger A, Fraysse B. Development of different linguistic systems in children with a cochlear implant [in French]. Rev Laryngol
Otol Rhinol (Bord).
1998;119:277-279.
5. Schauwers K, Gillis S, Daemers K, De Beukelaer C, Govaerts PJ. Cochlear implantation between 5 and 20 months of age: the onset of bab-bling and the audiologic outcome.
Otol Neurotol. 2004;25:263-270.
6. Govaerts PJ, Daemers K, Schauwers K, et al. Implantation
pré-coce et/ou bilatérale. Rééd
Orthopho-nique. 2004;217:31-46.
7. Waltzman S, Cohen N, Shapiro W. Effects of cochlear implantation on the young deaf child. Adv
Oto-rhinolaryngol. 1995;50:125-128.
8. Inscoe J. Communication outcomes after paediatric cochlear implantation.
Int J Pediatr Otorhinolaryngol.
1999;47:195-200.
9. O’Neill C, O’Donoghue GM, Archbold SM, Nikolopoulos TP, Sach T. Variations in gains in auditory performance from pediatric cochlear implantation. Otol Neurotol. 2002;23: 44-48.
10. Manrique M, Cervera-Paz FJ, Huarte A, Perez N, Molina M, Garcia-Tapia R. Cerebral auditory plasticity and cochlear implants. Int J Pediatr
Otorhinolaryngol. 1999;49:S193-197.
11. O’Donoghue GM, Nikolopoulos TP, Archbold SM. Determinants of speech perception in children after cochlear implantation. Lancet. 2000; 356(9228):466-468.
12. International Bureau for Audiophono-logy. Audiometric classification of
hearing impairments. Biap
recom-mendation 02/1bis. Available at: http://www.biap.org.
13. Bluma SM, Shearer MS, Frohman AH, Hilliard JM. Guide
Portage d’ Intervention précoce.
Editions de la Collectivité, Montréal; 1976:fiches 1-98.
14. Courtat P, Peytral C, Elbaz P.
Explorations fonctionnelles en ORL.
Masson, Paris; 1995:30.
15. Vieu A, Mondain M, Sillon M, Piron JP, Uziel A. The test for the evaluation speech perception and pro-duction [in French]. Rev Laryngol
Otol Rhinol (Bord).
1999;120:219-225.
16. Lafon JC. Le Test Phonétique et la
Mesure de l’Audition. Editions
Centrex, Eindhoven; 1964:138-149, 235.
17. Archbold S, Lutman ME, Marshall DH. Categories of auditory performance. Ann Otol Rhinol
Laryngol Suppl. 1995;166:312-314.
18. Archbold S, Lutman ME, Nikolopoulos T. Categories of audito-ry performance: inter-user reliability.
Br J Audiol. 1998;32:7-12.
B. Lejeune, Ph.D.
CMAP, Chaussée Churchill, 79 B-4420 Montegnée-Liège, Belgium E-mail: cmap@skynet.be