GEOPHYSICAL RESEARCH LETTERS, VOL. 22, NO. 20, PAGES 2685-2688, OCTOBER 15, 1995
Simultaneous
observations
of the saturnian
aurora and polar haze with the HST/FOC
J.C. G•rard, V. Dols and D. Grodent
LPAP, Institut d'Astrophysique, Universit• de Ligge, Belgium
J.H. Waite and G.R. Gladstone
Southwest P•esearch Institute, San Antonio, Texas
R. Prang•
Institut d'Astrophysique Spatiale, CNI•S, Orsay and Institut d'Astrophysique de Paris, France Abstract. Near simultaneous observations of the Sat-
urnian H2 north ultraviolet aurora and the polar haze were made at 153 nm and 210 nm respectively with the Faint Object Camera on board the post-COSTAR Hub- ble Space Telescope. The auroral observations cover a complete rotation of the planet and, when co-added,
they reveal the presence of an auroral emission near
80 ø N with a brightness of about 150 kR of total H2 emission. The maximum vertical optical depth at 210 nm is found to be located •- 5 ø equatorward of the au- roral emission zone. The haze particles are presumably
formed
by hydrocarbon
aerosols
initiated
by H•
+ auroral
production.
In this case,
the 3 x 10
•ø W of H• emission
observed with the FOC, combined with the deducedhaze optical depth requires an efficiency of aerosol for-
mation of about 7 %. This result indicates that auroral
production of hydrocarbon aerosols is a viable source of high-latitude haze.
Introduction
The ultraviolet aurora of Saturn has been studied
much less extensively than the Jovian aurora. Spatially-
resolved spectra were obtained with the Internation-
al Ultraviolet Explorer (IUE) satellite (Clarke et al., 1980). The first unambiguous evidence for the Saturni- an aurora was provided by the UV spectrometer (UVS) aboard the Voyager spacecraft (Broadfoot et al., 1981; Sandel and Broadfoot, 1981; Sandel et al., 1981). The UVS measured auroral emission of Ly-c• and H• Lyman and Werner bands from the polar regions of both hemi- spheres. Latitudinal slit scans across the south pole lo- cated the emission between 78 ø S and 81.5 ø S at Saturn System III longitude - 190 ø. Based on an assumption about the extent of the auroral oval, the nadir bright- ness in the oval was estimated 2 2.8 kR. Both observa- tions showed a maximum at 50 ø < ,XH• <180 ø. They
Copyright 1995 by the American Geophysical Union. Paper number 95GL02645
0094-8534/95/95 GL-02645503.00
were
also
consistent
with'a brightening
when
the longi-
tude of the mean meridian is near 50 ø to 100 ø .In parallel, observations made at 265 nm in the po-
lar regions of giant planets with the photopolarimeter
(PPS) aboard Voyager 2 were analyzed by West et al. (1983) and Pryor and Hord (1991). The darkening of the polar region is ascribed to the presence of strato- spheric haze. The observed northern haze region ap- pears to enclose the auroral zone as defined from the UVS morphological observations. Recently, Ben Jaf- fel et al. (1995), using FOC-HST pre-COSTAR images,
showed a good correlation between the peak of the haze
absorption at 210 nm and the UVS location of the au-
rora.
Observations
The observations were made between 22:53 UT Oc- tober 1 and 11:42 UT October 2, 1994 with the FOC F/96 relay. The 1024 x 512 Z zoomed pixel format was used to observe with the largest possible field of view (14 x 14 arcsec). A first 1195s exposure was made with the F210M + F220W filter setup which isolates a 20
nm wide region centered at 210 nm. To avoid excessive
count rate leading to non-linearity of the detector's re-
sponse, the neutral filter FiND was also used in series
with the UV filters. The purpose of this image was both to get a good determination of the UV planetary limb and to analyze the dark haze distribution in the polar cap. A series of eight (seven 1075 s and one 895 s expo- sures, each separated by one HST orbit (96 min) were subsequently made with the F152M + F175W filters in
an attempt to image the UV Saturnian aurora over a
complete planetary rotation. This filter passband iso- lates a 20 nm region centered at 153 nm which includes
lines
and
continuum
from
the B •E• - X •E•
+ Lyman
transition. This filter combination provides good con- trast against the sunlight reflected by the planetary disk (G6rard et al., 1994 and references therein). The nomi- nal pointing of the telescope was such that the center of the FOC field of view tracked a point located at a plane- tographic latitude of 40 ø N (37 ø planetocentric) on the central meridian. During the observations, the phase 26852686 GERARD ET AL.: SATURNIAN UV POLAR REGION
angle of Saturn was 3.1 ø and the apparent equatorial and polar diameters were 18.8 and 16.7 arcsec respec- tively. The planet rotated by 10.5 ø during each 1075 s
exposure.
Results
Auroral morphology
No single image at 153 nm shows a clear auroral con-
tribution. To improve its detectability, all 8 exposures
at 153 nm were added together.
The characteristics of the auroral morphology are best illustrated in Figure I which shows an enlarged and contrast-enhanced version of the average of the 8 im-
ages. We characterize the zones of auroral emission
by the density and brightness of pixels defining them.
Therefore, a test is applied to each pixel to check the
count level and the number of neighboring pixels above a prescribed level and its intensity is increased to pro- vide a better contrast. For comparison, this image over-
lays the 210 nm image which shows a well defined dark
polar region extending down to about 65øN. An align- ment of bright features representing the most intense spots of the auroral emission closely follows the 80 ø par- allel and is interpreted as the brightest parts of the UV auroral arc previously detected with the Voyager UVS.
Apparent auroral emission rates may be derived from
the count rate in the emission zone using the FOC ab- solute calibration combined with the filter transmis- sions. The mean auroral count level above the disk background in the auroral region described before is on the order of 0.2 C pix -• for the average duration of an
exposure. The total instrument sensitivity in this con-
figuration
is • 680 MR (megarayleigh)
/ C pix-•s -•
of total H2 emission (Lyman + Werner bands) . This
value is based on a detailed calculation of the FOC re- sponse to a synthetic unabsorbed spectrum of the H2 UV emission excited by 100 eV electrons described in
Trafton et al. (1994). Therefore, the average emission
level is on the order of 150 kR. This value is larger than
the peak values of 40-50 kR detected by the Voyager 1
and 2 UVS observations near ,Xttt = 150 ø. It should be stressed, however, that the UVS estimate was based on
the assumption that the instrument slit was uniformly
filled with auroral emission extending between 78 ø and 81.5 ø. The FOC value reported here refers to a more
localized region and could therefore be compatible with the UVS observations.
Estimate of the total auroral power
The total power radiated by the north aurora may
be derived from the integrated count rate of the auro-
ral emission observed at 153 nm. A two-step procedure is applied: (1) the total auroral count rate above the disk background is derived from the data displayed in Figure I and (2) the count rate is converted into the total power radiated in the H2 bands and into a precip- itated energy flux. Step i first requires a determination
of the extent of the auroral emission zone. This deter-
mination is based on the contrast enhancement method outlined before. A mask of the emission zone is built and the total number of counts inside it is determined. Using the absolute camera sensitivity and a synthetic H2 spectrum, we estimate the total H2 (Werner and Ly- man bands) full hemispheric radiated power to be 3 x
10
m W. If an efficiency
factor
of 7 (G•rard and Singh,
1982; Waite et al. 1983) is used for the conversion of the electron energy flux to the H2 emission, about 2 x
10
TM
W must
be deposited
in the north polar region
by
the energetic electrons. A precipitated power of • 2 x
10
TM
W was derived
from the Voyager
1 UVS observa-
tions (Broadfoot et al., 1981) for the two hemispheres. The fair agreement between the two sets of observa- tions may be fortuitous, considering the rather poor
statistics, possible sources of calibration errors and the
high level of variability observed with the Voyager UVS.
Figure 1 Comparison of the location of the auroral
emission with the UV dark polar region. The opacity
derived
from the non-auroral
image at 210 nm (blue-
purple) is overlaid with the contrast-enhanced zones of emission at 153 nm (red-yellow). A grid of parallels and meridians is superimposed on the synthetic image. Parallels are separated by 10 ø and meridians by 20 ø of
longitude.
Correlation with the polar darkening
As mentioned
before, the UV darkening
of the po-
lar cap is generally explained by the presence of an
additional
stratospheric
haze layer (West et al., 1983;
Karkoschka
and Tomasko,
1993) possibly
generated
by
the interaction of the auroral energetic precipitation
GERARD ET AL.: SATURNIAN UV POLAR REGION 2687 0.8 O.4 0.0 -0.4 0
... opocity
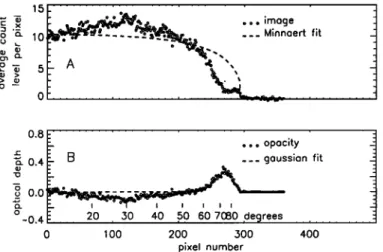
... 20_ . .30.. 40 . .50_ _60.7.08_0 .degrees ... 100 200 300 400 pixel numberFigure 2 (a) Center-to-limb variation of Saturn's mea- sured brightness at 210 nm. The dots show the bright- ness variation measured in a 11-pixel wide cut along the central meridian in the raw image. The dashed line is the fit of a generalized Minnaert function to the data outside the dark polar cap region.(b) dots: distribution along the central meridian of the optical depth at 210 nm derived from (a) (see text). Dashed line: gaussian fit to the individual data points.
The present set of data provides a unique opportunity
to compare the structures of the auroral UV emission
and the UV darkening observed quasi simultaneously. The 210 nm image may be used to map the reflectiv- ity I/F of the Saturnian atmosphere. To characterize the distribution of intensity in the dark north polar re-
gion, we consider a radial section from the Sub-Earth
point along the central meridian to the north pole. It is shown in Figure 2a where the slight increase in bright- ness from the center to about 30 ø , probably the result of an inadequate fiat field correction. To analyze the distribution of the absorption in the north polar region, we assume that the polar haze forms a purely absorbing layer located above the reflecting lower atmosphere. In this simple case, the additional absorption by the haze
layer
is given
by [exp
(- •00)
exp
(-•)], where
z is the
polar haze vertical optical depth at 210 nm,/•0 and/•
the local cosines of the solar zenith angle and emission angle, respectively. The procedure adopted is thus to fit the reflectivity distribution of the disk, after removing the polar and ring regions, with a generalized Minnaert function (e.g. West et al., 1995). The synthetic Min- naert distribution (I/F)Mi• is then divided by the ob- served reflectivity (I/F)ob8 along the central meridian. This ratio is close to unity except in the polar latitudes. The depth of the polar haze is given by:
'r = ln(
IM,,• 1 1
--+ )-1
(1)
where IMin and Io•,8 are respectively the Minnaert-fitted and the observed distribution directly derived from the 210 nm image. The latitudinal variation of the optical thickness along the central meridian derived from (1) is shown in figure 2b, together with a least square gaus-
sian fit. The signal to noise ratio of data point in figure
2 (averaged over 22 pixels) varies from about 10 at mid- latitudes to about 5 near the haze maximum absorption.
Values of •- range from less than 0.1 at latitudes lower than 60 ø to about 0.27 at 75 ø. A well defined maximum in •- is located at 75 ø, that is about 5 ø equatorward of the auroral emission.
Auroral production of aerosols
Several sources of high-latitude aerosol production have been suggested by Pryor and Hord (1991) based on the interpretation of the Voyager Photopolarimeter Subsystem. The most plausible appears to be hydrocar- bon aerosol formation initiated from autorally produced
H•
+ ionization.
This process
is regulated
by the produc-
tion rate of H•
+ ions
efficiently
converted
into H3
+ which
react with CH4 to initiate polymerization. The rela- tive altitude of the methane homopause and the region of maximum auroral electron energy deposition play an important role in determining the efficiency of this au- roral aerosol formation process. The large quantities of atomic hydrogen formed from auroral impact of H2 will terminate any neutral polymerization schemes through three body recombination reactions of CH3 and H to
reform
CH4. However,
ions such
as C2H3
+ can further
react with C2H• and continue toward polymerization. We estimate the efficiency of aerosol formation required to produce the observed haze as follows (cf. Pryor and Hord, 1991). Assuming that the haze is made up of spherical particles of radius r and density p, the col- umn mass density of haze implied by our derived peak optical depth of •- • 0.27 is given by ß
N(g cra
-•) 2 x 10
-6 P
[¾(g
r
(2)
The lifetime of the haze is probably governed by the timescale for gravitational settling through the strato- sphere (in the presence of eddy diffusion). A lifetime of --• 30 years is estimated for such particles from West et al., (1995), so that maintenance of the aerosol layer would require a column mass production rate of
p r
P(g
cm-2s
-1)
•-,
2 X 10
-•5 [•(g
cm-3)]
[0•-•(/zm)]
(3) We assume that the aerosol haze is made of 0.1/zm ra- dius particles with a density '-• I and extends from the
pole to 64
ø N, covering
about 2.3 x 10
•9 cm
2. Thus,
we derive an aerosol production rate integrated over the
haze cap "• 4.6 x 10⁴ g s -•. The total production
rate
of H•
+ ions in a 3 x 10
lø W H• aurora
is about 3 x
102s
ions
cm
-• since
the formation
of each
H•
+ ions
re-
quires an average energy of 37 eV (Waite et al. 1983). If we assume that (1) the aerosol composition is domi- nated by carbon and (2) that all ions producted below the methane homopause will result in the formation of hydrocarbon ions, we conclude that a typical Saturnian aurora is able to produce the observed haze layer if the aerosol formation (e.g. condensation or clustering on each hydrocarbon ion) is about 7 %.
Based on an aerosol production-loss balance, Pryor and Hord (1991) derived, depending on the loss rate estimate, an efficiency ranging from 20 to 120 % for a 1 kR aurora extending over a 2 x 1018 cm 2 area and a polar haze zone north of 68 ø N. We note that a 0.1 /•m-radius aerosol particle would contain about 2 x 10⁸ carbon atoms, so that the process of going from hy- drocarbon ions to aerosols is extremely poorly defined. If the single scattering albedo of the particles was non negligible, light scattered by the haze would only add a small amount to the efficient Rayleigh scattering by
H2. In this case, our estimate of 0.27 for the maximum
absorption opacity would be unchanged but the haze column estimate would need to be somewhat revised upward. Our results are merely to demonstrate that auroral production of hydrocarbon aerosols is a viable source for the high-latitude haze.
Discussion
The first images of the Saturnian UV aurora have
been obtained with the post-COSTAR HST-FOC. Its local brightness maximum is larger than the values de- rived from the UVS spectrometer observations aboard Voyager but the total emitted power deduced from the
two instruments are in fairly good agreement. The min-
imum reflectivity of the dark polar cap, presumably as- sociated with the maximum optical depth (_• 0.3) of the polar stratospheric haze, is found near 720-75 ø, that is equatorward of the UV auroral peak. Since these two sets of observations were made during a single Saturni- an rotation and pointing was using the same guide stars, this conclusion is fairly robust. The 50-8 ø shift found
here between the presumed auroral haze source and the
maximum haze absorption may possibly be ascribed to either (1) meridional transport of the precursors of the haze particles by equatorward meridional winds or (2) the possibility that the haze latitude represents the av- erage latitude for the aurora, and we have observed a particular aurora at a higher latitude. Since a similar shift in latitude between the haze and the aurora was
noticed by Pryor and Hord (1991), we favor the first possibility. Such winds would be easily generated by the large heat input into the auroral region from pre- cipitating energetic particles. For example, a 100 kR H• aurora corresponds to a particle energy flux of about 7
erg cm
-•s -1 about 50 % of which is converted
into gas
heating. The latitudinal temperature gradient associ- ated with the auroral heating rate excess over the solar EUV heating will redistribute heat by the combined ef-
fect of vertical and horizontal transport in a way similar to the Earth's and probably the Jovian aurora. Final-
ly, as mentioned before, haze particles would only be efficiently produced by auroral particles if their energy is large enough to create sufficient ionization below the homopause. This assumption remains to be substanti- ated by observations.
Acknowledgments. The authors are grateful to L. Ben Jaffel for useful discussions and valuable sugges- tions about the data analysis. J.C.G. is supported by the Belgian Fund for Scientific Research. Funding for this research was provided by the PRODEX program of the Belgian Federal Office for Scientific, Technical and
Cultural Affairs, STScI grants AR-4916.01-92A, GO- 5341.01-93A and NASA Planetary Atmospheres NAGW 3624. These results are based on observations with the
NASA/ESA Hubble Space Telescope, obtained at the STScI, which is operated by AURA, Inc., for NASA under contract NAS5-26555.
References
Ben Jafflel, L. , V. Leers, and B.i•. Sandel, Dark auroral oval on Saturn discovered in Hubble Space Telescope ul-
traviolet images, Science, 269, 951, 1995.
Broadfoot, A.L. et al., Extreme ultraviolet observations
from Voyager 1 encounter with Saturn, Science, 212,
206, 1981.
Clarke, J.T., H.W. Moos, S.K. Atreya and A.L. Lane, IUE detection of bursts of H Lyman-alpha from Saturn , Na-
ture, 290, 226, 1981.
Ggrard, J.C., D. (]rodent, 1•. Prang4, J.H. Waite, G.I•. Gladstone, V. Dols, F. Paresce, A. Storrs, L. Ben Jaffel and K.A. Franke, A remarkable auroral event on Jupiter observed in ultraviolet with the Hubble Space Telescope,
Science, 266, 1675, 1994.
Ggrard, J.C. and Singh, V., A model of energetic electrons and EUV emission in the Jovian and Saturnian Atmo- spheres and implications, Y. Geophys. Res., 87, 4525,
1982.
Karkoschka, E. and M.G. Tomasko, Saturn's upper atmo- spheric hazes observed by the Hubble Space Telescope,
Icarus, 106,428, 1993.
Lane, A.L. et al, Photopolarimetry for Voyager 2: prelimi- nary results on Saturn, Titan, and the rings, Science, 215,
537, 1982.
Pryor, W.i•. and C.W. Hord, A study of Photopolarimeter system UV absorption data on Jupiter, Saturn, Uranus
and Neptune: implications for auroral haze formation,
Icarus, 91,161, 1991.
Sandel, B.i•. et al., Extreme ultraviolet observations from
the Voyager 2 encounter with Saturn, Science, 215, 548,
1982.
Sandel, B.i•. and A.L. Broadfoot, Morphology of Saturn's
aurora, Nature, 292, 679, 1981.
Trafton, L.M., J.C. G4rard, G. Munhoven and J.H. Waite,
High-resolution spectra of Jupiter's northern auroral ul- traviolet emission with the Hubble Space Telescope, Ap.
J., 421 , 816, 1994.
Waite, J.H., T.E. Cravens, J. Kozyra, A.F. Nagy, S.K.
Atreya and I•.H. Chen, Electron precipitation and related aeronomy of the Jovian thermosphere and ionosphere, Y.
Geophys. Res., 88, 6143, 1983.
West, tLA., M. Sato, H. Hart, A.L. Lane, C.W. Hord, K.E.
Simmons, L.W. Esposito, D.L. Coffeen and tLB. Pom-
phrey, Photometry and polarimetry of Saturn at 2640 and
7500
]•, J. Geophys.
Res,
88, 8679,
1983.
West, I•.A., E. Karkoschka, A.J. Friedson, M. Seymour, K. H. Baines and H.B. Hammel, Impact debris particles in Jupiter's stratosphere, Science , 267, 1296, 1995.
J.C. G•rard, V. Dols and D. Grodent, Laboratoire de Physique Atmosph•rique et Plan4taire, Institut
d'Astrophysique, Universitg de Liege, 5, avenue de Cointe,
B-4000 Liege, Belgium. (e-maih gerard@astro.ulg.ac.be)
J.H. Waite and G.I•. Gladstone , Southwest l•esearch Institute, San Antonio, Texas, 78228-0570, USA
1•. Prang•, Institut d'Astrophysique Spatiale, CNi•S,
Universit• de Paris XI, Orsay and Institut d'Astrophysique
de Paris, CNI•S, France
(received March 2, 1995; revised May 24, 1995;