M.DE LOOSE,E.DAESELEIRE,I.TAVERNIERS,C.PLATTEAU,B.DE MEULENAER,
B.DEVREESE,T.CUCU,E.DE PAUW,G.MAGHUIN-ROGISTER,M.L.SCIPPO,
S.FOURDRILIS,W.STEVENS,D.EBO,C.BRIDTS
C
ONTROLLINGT
HEA
LLERGENI
SSUE INT
HEB
ELGIANF
OOD ANDC
ATERINGI
NDUSTRY(SSD)
Agri-food
FINAL REPORT PHASE 1
D
EVELOPMENT OF AN INTEGRATED STRATEGY FOR CONTROLLING THE ALLERGEN ISSUE IN THEB
ELGIAN FOOD AND CATERINGINDUSTRY
“ALLERRISK”
SD/AF/03A
Promotors
Marc De Loose & Els Daeseleire
Institute for Agricultural and Fisheries Research (ILVO) Technology and Food Unit
Bruno De Meulenaer & Bart Devreese University Ghent (Ugent)
Unit Food Chemistry and Human Nutrition Laboratory of Protein Biochemistry Guy Maghuin-Rogister & Edwin De Pauw
University Liege (ULg)
Centre for Analysis of Residues in Traces (CART) Wim Stevens & Didier Ebo
University of Antwerp (UA)
Dept. Immunology, Allergology, Rheumatology Authors
Marc De Loose, Els Daeseleire, Isabel Taverniers, Céline Platteau (ILVO) Bruno De Meulenaer, Bart Devreese, Tatiana Cucu (UGent) Edwin De Pauw, Guy Maghuin-Rogister, Marie-Louise Scippo (ULg)
Wim Stevens, Séverine Fourdrilis, Didier Ebo, Chris Bridts (UA) .
Rue de la Science 8 Wetenschapsstraat 8 B-1000 Brussels Belgium Tel: +32 (0)2 238 34 11 – Fax: +32 (0)2 230 59 12 http://www.belspo.be
Contact person: Christine Mathieu +32 (0)2 238 34 93
Neither the Belgian Science Policy nor any person acting on behalf of the Belgian Science Policy is responsible for the use which might be made of the following information. The authors are responsible for the content.
No part of this publication may be reproduced, stored in a retrieval system, or transmitted in any form or by any means, electronic, mechanical, photocopying, recording, or otherwise, without indicating the reference :
Marc De Loose, Els Daeseleire, Isabel Taverniers, Céline Platteau, Bruno De Meulenaer, Bart Devreese, Tatiana Cucu, Edwin De Pauw, Guy Maghuin-Rogister, Marie-Louise Scippo, Séverine Fourdrilis, Wim Stevens, Didier Ebo, Chris Bridts. Development of an integrated
strategy for controlling the allergen issue in the belgian food and catering industry “ALLERRISK”. Final Report Phase 1 Brussels : Belgian Science Policy 2009 – 63 p. (Research
Table of contents 1. SUMMARY PROJECT ... 4 2. INTRODUCTION ... 7 2.1. CONTEXT...7 2.2. OBJECTIVES...7 2.3. EXPECTED OUTCOMES...8 2.4. RESEARCH TEAM...9 3. RESULTS ... 10 WORK PACKAGE 1: EVALUATION OF THE ROBUSTNESS OF THE AVAILABLE METHODS... 10 3.1.1. Functional evaluation of different protein extraction procedures... 10 3.1.2. Validation of commercially available ELISA kits as such and after chemical treatment ... 15 3.1.3. Optimisation of DNA extraction ... 22 3.1.4. Application of controlled chemical reactions to allergen proteins ... 24
3.1.5. Mass spectrometric study of changes in allergen proteins by application of controlled chemical reaction... 42
WORK PACKAGE 2: EVALUATION OF OPTIMISED IMMUNOCHEMICAL AND PCR INTEGRATED ANALYTICAL TECHNIQUES.. 43
3.2.1. Development of a new real‐time PCR... 43 WORK PACKAGE 3: DEVELOPMENT OF QUANTITATIVE MASS SPECTROMETRIC METHODS... 46 3.3.1. Development of the heavy peptides method ... 46 4. ADJUSTMENTS MADE TO THE ORIGINAL PLANNING... 55 5. PERSPECTIVES PHASE 2... 57 6. POSTERS ‐ PUBLICATIONS... 58 7. ACKNOWLEDGEMENTS... 59 8. REFERENCES... 60
1. Summary Project
Food allergies represent an important health problem and the prevalence of allergic reactions shows an increasing trend over the last years. European and American studies showed that food allergies affect up to 2 % of the adult population and up to 8 % of the children. Currently, the only effective treatment for food allergy is avoidance of the allergen-containing food. However, total avoidance is sometimes difficult since processed food products may contain a broad variety of ingredients, of which some have the potential to induce allergenic reactions. Sensitive individuals may also be inadvertently exposed to allergenic proteins by consumption of food products that are supposed to be free of a certain allergen. Food products may contain impurities caused by carry-over due to inadequate cleaning of shared processing equipment (e.g. during transport, storage and processing) or through rework of allergen containing products. The food industry is, due to the lack of an integrated approach for the detection of allergens, confronted with a problem with regard to the validation of their production processes in order to assure absence of cross-contamination in the production lines and also with a reliable quality control of the incoming materials.
Reliable detection and quantification methods for food allergens are necessary in order to ensure compliance with food labelling and to improve consumer protection. However, the detection of allergens in food is not easy as they are often present only in trace amounts or masked by the food matrix. The methods used are either targeting the allergen (protein) itself or a marker that indicates the presence of the offending food. As markers for the detection of potentially allergenic food products or ingredients, specific proteins or DNA fragments are targeted. ELISA and PCR methods are the methods of choice for developing routine methods. They both have their characteristic merits and drawbacks concerning their applicability in the detection and quantification of allergens in foodstuffs. It is clear that there are still a lot of problems in the detection of allergens that have to be cleared out. An integrated strategy to control the allergen issue in Belgium is lacking, which is a serious problem for the industry, the government and most important the allergic patients. Therefore the main objective of this project is to develop for selected allergens such an integrated strategy. In such a strategy, quantitative analysis of the target allergen plays a key role. The allergens selected for this project are soy and hazelnut. This selection was based on a number of criteria, including the likelihood of the presence of these hidden allergens due to cross contamination in foods, the severity of the allergic reaction, the number of patients confronted with such an allergy and the number of available serum samples present in the serum collection of the University hospital of Antwerp.
Commercially available screening tests for detection of hazelnut and soy (PCR) and allergenic proteins thereof (ELISA) will be validated. The robustness of the available methods to detect soy and hazelnut proteins in foodstuffs will be evaluated. Finally the effect of different processing steps on the detection and the
allergenic reaction will be studied. Therefore a stepwise approach for simulating the influence of food processing on the allergen is proposed in which at a first stage the impact of chemical reactions on protein and DNA level are studied in simple aqueous solutions. In a second stage, similar chemical reactions will be monitored in a food model system. The impact of these food processing simulating reactions on the chemical composition of the allergen, on its detection by commercially available methods and on its allergenicity will be monitored using the following 5 analytical approaches: immunochemical analysis; PCR analysis; mass spectrometric analysis; chemical analysis and in vitro allergenicity assessment.
New integrated analytical methods will also be developed and optimized. It is expected that different food processing steps will decrease the robustness of the existing immunological and DNA based methods. It is the aim to detect correlations between the results of the different analytical strategies and the allergenic capacity of a food product. The goal is to define the different parameters that have an impact on this correlation and where possible to quantify them. For those proteins isolated from the target allergic agricultural raw materials not showing loss of allergenicity during food processing and showing loss of detectability by commercially available routine methodology new ELISA’s and PCR’s will be developed.
The results obtained with screening methods have to be confirmed by mass spectrometric methods. Therefore, the applicability of a quantitative technique of analysis based on liquid chromatography coupled to mass spectrometry will be tested on the allergens. This approach is standard practise in proteomics
The obtained detection limits of the commercially available methods and the newly developed methods (ELISA,PCR, MS) will be evaluated by in-vitro techniques. In this way information will be available how far these detection limits can give 100 % guarantee to the allergic patient and consumer in general.
This project also aims to provide practical guidelines for reducing allergenic risks in food industry and in the catering. Contaminations can lead to allergic reactions in sensible patients. The guidelines are of interest for the autocontrol HACCP-based systems, which are installed and controlled by the Belgian Food Safety Agency (FAVV).
Due to the lack of an integrated approach for the detection of allergens the food industry is at the moment confronted with a problem with regard to the validation of the production processes for the absence of allergenic compounds in the final products. Critical points are cross-contamination in their production lines and quality assurance of the incoming materials. Rework of allergen-containing products can also be a source of allergens in the final food products. In the last part of this project it is proposed to use the developed methods in Belgian food factories belonging to the dairy sector, chocolate sector, meat sector and cookie sector to evaluate the cleaning processes applied and to assess the critical control points in the quality management system. Besides the food industry, different kitchens including catering, are confronted with the problem of controlling cross-contamination to avoid allergenic reactions of the consumers. Autocontrol systems, applied in catering are necessary for the most important allergens to assure a
proper communication to the clients. Because in a hotel school mini-installations are available, similar to those used in catering companies, the same general approach as for the food industry will be evaluated under different conditions. As this is the place where people are educated to work in the catering industry the outcome will have a secondary effect at the level of sensitising.
2. Introduction
2.1. Context
The last few years the incidence of food allergies has increased; about 6-8% of children and 2-3% of adults suffer from a food allergy (Ortolani et al., 2001). According to the World Health Organisation food allergies pose the fourth most important public health problem. About 15-20% of the population is (in)directly confronted with food allergies in their daily life through a family member, at work, at school, etc.. Currently, the only effective treatment for food allergy is total avoidance of the allergen-containing food. This is not always feasible as food products often are composed of a large variety of ingredients of which some could cause an allergic reaction. Food products can also unintentionally contain allergenic components due to cross-contamination during storage or shipment or as a result of rework or inadequate cleaning.
Directive 2003/89/EC, amending Directive 2000/12/EC, contains a list of allergenic foods, which have to be declared unambiguously in the list of ingredients on the package label. The lack of an integrated approach for the detection of (food) allergens puts the food industry for a problem with regard to the control of their production processes to ensure the absence of cross-contamination. There is an urgent need for validated detection and quantification methods which are specific, sensitive, reproducible and compatible with different matrices. The currently available methods detect either the allergenic proteins (ELISA) or a DNA marker of the allergenic component/product (PCR). In addition, mass-spectrometric methods are being developed to quantify allergens.
2.2. Objectives
The objective of this project is to develop an integrated control strategy for 2 selected allergenic foods, namely soy and hazelnut.
The performance of the currently commercially available detection kits will be validated for their robustness. It is expected that different food processing steps will have an influence on the proteins and their structure. This can have an effect on the detection but does not necessarily imply that the same is true for the allergic effect they elicit in a patient. To monitor the effect of food processing on the allergens, different chemical changes will be induced. In the first part the effect of the chemical reactions will be studied in an aqueous buffer, in the second part the same reactions will be performed in a model food system. The impact of these chemical changes on the detection of the allergens will be approached by ELISA, PCR, chemical analysis, mass spectrometry, immunoblot and in vitro functional
allergy tests. The correlation of the results with the different analysis methods will be evaluated. It is expected that some reactions will have an effect on the detection without altering the allergenicity of the proteins. It is the aim to define those reactions and to develop new ELISA and PCR methods to detect those proteins, which do not lose their allergenicity after food processing.
As a confirmation method for the above mentioned screening methods a mass spectrometric method will be developed. The applicability of a quantitative technique of analysis based on liquid chromatography coupled to mass spectrometry will be tested on the allergens.
The obtained detection limits of the commercial kits and the newly developed methods will be evaluated with in vitro allergenicity tests. In this way information will be available on how far these detection limits can give 100 % guarantee to the allergic patient and the consumer in general.
The final goal of this project is to provide practical guidelines for reducing the allergenic risks in the food industry and the catering. This part of the project will be done in co-operation with different factories of the food industry and a hotel school where mini-catering installations are available. Both are confronted with a problem with regard to the validation of the production processes for the absence of allergenic compounds in the final products. Different critical control points (CCPs) will be defined with regard to cross-contamination of their products with allergen-containing foodstuffs. Cross-contamination can occur at the level of the raw materials during shipment or storage, at the level of the production process or at the level of the cleaning process. The defined CCP’s will be tested in practice to evaluate their relevance and finally preventive measures and control limits for the CCPs will be defined. These guidelines will be formulated to the Belgian Food Safety Agency (FAVV) as a proposal for implementation in the autocontrol guides that are used to set up a HACCP system.
2.3. Expected outcomes
This project will result in an integrated approach for soy and hazelnut allergens, which could be applied in the future to other allergens. The project aims thus at providing the government and producers with tools to control the legislation concerning allergens in a reliable way. The screening of food products (and their production and processing sites) to detect possible allergens is an essential part of a solid preventive policy. The results of work package one will on the one hand give an overview of the performance characteristics and robustness of the currently commercially available kits for detection of hazelnut and soy in food products. On the other hand the profound study of the controlled chemical reactions on the hazelnut/soy proteins will give insight in the behaviour of proteins during food processing. With the newly developed real-time PCR in work package two, the objective is to detect to detect hazelnut after food processing, targeting one or more genes coding for hazelnut allergens. Work package three will provide a mass
spectrometric confirmation method for the screening methods, such as ELISA and PCR.
2.4. Research team
The mission of ILVO consists of the execution and coordination of policy-supporting scientific research and its associated services, with a view to sustainable agriculture and fisheries in relation to economical, ecological and social perspectives. Emphasis is laid on food safety items in the research group dealing with this project.
The Unit Food Chemistry and Human Nutrition focuses her research on the chemical behaviour of foods and food ingredients and the impact of this behaviour on human health. The research of the Laboratory of Protein Biochemistry and Protein Engineering is dedicated to the mass spectrometric analysis of proteins and peptides and to proteomics.
In the Centre of Analysis of Residues in Traces, the fundamental laboratory research is dedicated to molecular recognition. The behaviour of biological molecules is studied both theoretically and experimentally and the most important tool in the laboratory is the mass spectrometer.
The Department of Immunology, Allergology and Rheumatology focuses on the development of new diagnostic tools which can be helpful in the assessment of allergenicity of native and recombinant allergens.
3. Results
Work package 1: Evaluation of the robustness of the
available methods
3.1.1. Functional evaluation of different protein extraction procedures
o Partners
ILVO, UA
o Objective
This study aims to evaluate existing commercially available methods and develop new methods to detect food allergens. These methods are needed for the industry and catering to control their production processes to be able to protect allergic consumers. In this kind of study it is important from a clinical point of view to use an allergen extract in which the allergenic properties, i.e. the capacity to elicit an allergic response, are conserved. However, there is no standard protein extraction procedure available for allergen-containing foods. The literature describes many different protocols, most of them applying an aqueous protein extraction. Some of them make use of protease inhibitors (Bjorksten et al., 1980; Bolhaar et al., 2004; Kopper et al., 2005; Rudeschko et al., 1995), while others not. Defatting hazelnuts with hexane (Dooper et al., 2008; Yeung and Collins, 1996), acetone (Beyer et al., 2002) or diethyl ether (Enrique et al., 2005) before protein extraction is sometimes described as hazelnuts have a fat content of approximately 60%. Watanabe et al. (Watanabe et al., 2005) described a method for extracting proteins from processed foods, in which the buffer contains SDS, a surfactant, and 2-mercaptoethanol, a reducing agent.
This task aims to compare the use of protease inhibitors during extraction and defatting hazelnuts/soybeans before extraction.
o Methodology
The use of protease inhibitors was investigated applying 2 protocols, previously described for the extraction of proteins from allergen-containing foods; method A (Kujala et al., 2002) is a classical extraction with PBS, similar to method B (Bjorksten et al., 1980), however, the latter describes the use of protease inhibitors. To study the possible influence of defatting hazelnuts before extraction a third protocol was selected, including a hexane defatting step (Yeung and Collins, 1996).
Table 1: Overview of the different extraction protocols
Extraction buffer Enzyme inhibitors
Extract A (Kujala et al., 2002) PBS, pH 7.4 Extract B (Bjorksten et al., 1980) PBS, pH 7.4, 2% PVPP
* not included in dialysis buffer Extract C (Yeung and Collins, 1996) 20mM NaH2PO4, 1M NaCl pH 7.4 2mM EDTA 5mM DETC (diethyl-dithiocarbamate) 0.5mM BAHC (benzamidinehydrochloride) 0.2mM PMSF (polymethylsulphonefluoride) Extraction procedure
Defatting step only for extract C: - 10g material + 10ml hexane - shake 30min at RT - centrifugation, 5min, 2000g - take of supernatant - repeat 3 times - dry ON at RT Extraction: - (equivalent of )10g material + 100ml extraction buffer - shake ON at 4°C - centrifugation, 1h, 40.000g
- dialyse against extraction buffer, ON, 4°C
- lyophilisation - storage at –20°C
Nine different brands of hazelnuts were purchased in Belgian local supermarkets, which represent what is consumed in Belgium. One of the products concerned roasted hazelnuts, as hazelnuts are often roasted before processing in food products. Two Turkish qualities of hazelnuts (Levant and Giresun) were also available. As Turkey is the world leader in hazelnut export, these are good representatives for hazelnuts in food products. A mix of the hazelnuts was made by taking one kg of each kind. Soybeans were provided by Alpro (Belgium) and Cargill (Belgium). Again, a mix was made of the different soybeans.
Hazelnuts/soybeans were frozen with liquid nitrogen and ground in a two-step process first with a Moulinex blender and secondly with an Ultra Turrax t25.
Evaluation of the different extracts was performed by IgE-immunoblot and the Basophil Activation Test (BAT). The Basophil Activation Test (BAT) is a flow-cytometric analysis of in vitro-activated peripheral blood basophils, which rests upon quantification of changes in expression of basophilic activation markers after challenge with a specific allergen (Ebo et al., 2006). The activation marker used in this study is CD63, whose expression on the outer surface membrane is upregulated in IgE-activated basophils. Basophils are activated by cross-linking of IgE’s through an allergen. Basophils are characterised with an anti-IgE antibody and the activation status is analysed with an anti-CD63 antibody.
o Results
For the investigation of the use of protease inhibitors, four hazelnut extracts were made: extract A+ and B+, including the mix of protease inhibitors as
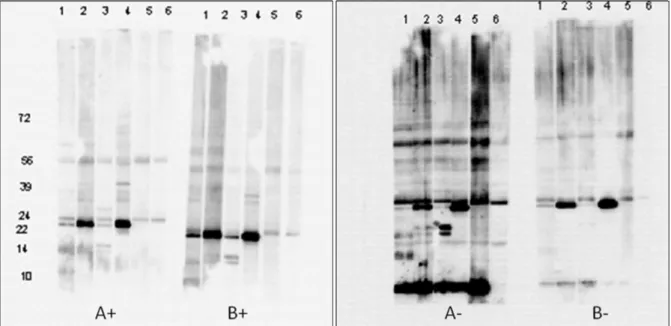
described for method B, and extract A- and B-, excluding the inhibitors. These extracts were analysed by IgE-immunoblot with blood from four hazelnut-allergic patients and one control patient (hazelnut tolerant). Figure 1 shows that not including the mix of protease inhibitors resulted in a lot of aspecific staining, which is an indication for the presence of degraded proteins.
In the BAT the different hazelnut extracts were analysed at different concentrations, which resulted in dose-response curves (1ng/ml – 1mg/ml) (Figure 2). The results of the BAT confirmed those from the immunoblot test, i.e. that the quality/allergen-provoking potential of the extracts prepared without protease inhibitors is decreased. Figure 2 shows that with extract A- a smaller percentage of activated (CD63+) basophils is measured for 1 patient (red curve) and with extract B- for 2 patients (red and black curve).
Figure 1: IgE-immunoblot of hazelnut extracts, prepared with (A+, B+) or without (A-, B-) protease inhibitors, with serum from four hazelnut-allergic patients (lane 1-4), one control
patient (lane 5) and a blanc (lane 6)
A+ B+ A-
B-Figure 2: Dose-response curve in BAT of extract A and B prepared with (+) or without (-) protease inhibitors with blood from three hazelnut-allergic patients (blue, red and black curve)
To study the possible influence of defatting on the allergenicity extracts A, B and C were prepared with inclusion of the mix of protease inhibitors, as this had proven to improve the quality of extracts, and analysed with serum from two hazelnut-allergic patients and one control patient. Distinct proteins were recognised with the serum from the hazelnut-allergic patients, while no binding was seen for the control patient.
The IgE’s from the two patients bound to different proteins, however, each patient recognised the same proteins in the different extracts, indicating the same allergens are present in the three extracts.
Figure 3: IgE-immunoblot of different hazelnut protein extracts (1=extract A, 2=extract B, 3=extract C) with serum of two hazelnut-allergic patients (A,B) and one hazelnut-tolerant
patient (C)
The allergenicity of the different extracts was tested by the BAT with blood from three hazelnut-allergic patients (Figure 4). The response differed between patients, but each individual patient showed the same response to the three extracts. For these patients defatting does not influence the allergenicity of the extract.
The same test was performed with analogous extracts made from soybeans with serum from three soy-allergic patients (Figure 5). The basophils of two out of three patients had a similar response after stimulation with each extract.
o Conclusion
The results from Figure 1 and Figure 2 show that the use of protease inhibitors is essential for the stability of the proteins and consequently the allergenicity of the allergen extract. Therefore, for all future tests protein extracts will be prepared with the inclusion of the mix of protease inhibitors, as described aboveTable 1.
Figure 4 and Figure 5 indicate that the three protocols produce an equally allergenic protein extract. Moreover, defatting is unlikely to influence the quality of the extract, for hazelnut as well as for soy.
Figure 4: Dose-response curve in BAT of the different hazelnut protein extracts (A, B, C) prepared with protease inhibitors with blood from three
hazelnut-allergic patients (blue, red and black curve)
%
C
D
6
3
+
b
a
s
o
p
h
il
s
A
B
C
µg/ml extractFigure 5: Dose-response curve in BAT of the different soy protein extracts (A, B, C) prepared with protease inhibitors with blood from
3.1.2. Validation of commercially available ELISA kits as such and after
chemical treatment
o Partner
ILVOo Objective
Different parameters will be determined to evaluate the performance of the different commercially available ELISA kits to detect soy and hazelnut in food products. Therefore, pure protein extract will be used on the one hand, prepared according to method A (see above) with protease inhibitors. On the other hand, spiked matrix will be used to determine possible matrix effects. Food processing affects proteins in different ways. The impact thereof on the detection of proteins/allergens will be tested by applying specific chemical reactions to the proteins which mimic food processing (see 2.1.4).
A critical point when preparing a spiked matrix is the homogeneity of the material; it is of utmost importance that the spiked analyte is spread evenly through the matrix. Two recipes were tested for the preparation of cookies spikes with hazelnut.
o Methodology
An inventory was made from all the currently commercially available ELISA kits for the detection of hazelnut and soy in food products (Table 2).
Table 2: Commercially available ELISA kits for hazelnut and soy
Kit Manufacturer type
Ridascreen Fast Hazelnut R-Biopharm s-ELISA Biokits Hazelnut assay kit Tepnel Biosystems s-ELISA Hazelnut Residue assay ELISA Systems s-ELISA Veratox for Hazelnut Abkem Iberia s-ELISA
HAZELNU
T
Hazelnut Diagnokit Neogen Indirect competitive ELISA Soy Residue Immunoassay Safe Path s-ELISA
Soy Protein Residue ELISA ELISA Systems s-ELISA
SO
Y
Veratox for Soy Neogen s-ELISA
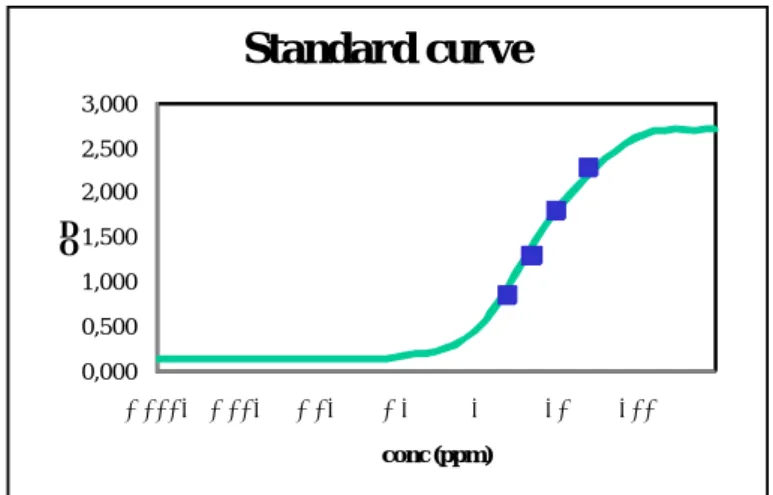
For each kit a standard curve was first set up by calculating the best fitting curve for the OD-values of the standards included in the kit with following equation:
(
)
a
d
c
conc
a
b
OD
+
⎥
⎥
⎥
⎥
⎦
⎤
⎢
⎢
⎢
⎢
⎣
⎡
⎟
⎠
⎞
⎜
⎝
⎛ +
−
=
^
1
In which
a = maximum OD-value b = minimum OD-value
c =E50 (concentration at half-maximal saturation)
d =slope
conc = concentration of the standard/sample
0,000 0,500 1,000 1,500 2,000 2,500 3,000 0,0001 0,001 0,01 0,1 1 10 100 O D conc (ppm)
Standard curve
Figure 6: Example of a standard curve obtained with the standards of the Veratox for Hazelnut kit
Application of the chemical reactions was performed as described under 2.1.4. Spiked matrix (cookies fortified with hazelnut) was prepared according to the recipes described by Poms et al. (Poms et al., 2005) and Scaravelli et al.
(Scaravelli et al., 2008). In the first recipe the dough is spiked before baking
whereas in the second one the butter to prepare the dough is spiked. After baking the cookies were ground and the homogeneity of the material was checked by analysing the spiked material with the Veratox for Hazelnut kit.
o
Results
Validation was first performed on the hazelnut kits with pure protein extract. Validation with spiked matrix and of the soy kits will be executed in the second phase.
Preliminary tests with the Hazelnut Diagnokit were unsatisfactory and did not fulfil the performance criteria indicated by the manual. The same problems were noticed with a second batch; therefore it was decided to exclude this kit from the study.
– LOD/LOQ
The Limit of Detection was determined by analysing 20 blank samples, calculating the mean value and adding three times the standard deviation. For the Limit of Quantification six times the standard deviation was added. A blank sample is in this case the buffer in which food samples are extracted and/or diluted before analysis in the ELISA assay according to the manufacturer’s protocol.
Table 3: LOD and LOQ as certified by the manual and determined with protein extract for the different hazelnut kits
Veratox for HN Ridascreen FAST HN Residue Detection kit Biokits HN Assay LOD - 1.5 ppm - 0.1 ppm
X
+3*SD 0.058 ppm 0.014 ppm 0.0003 ppm 0.023 ppm LOQ 2.5 ppm 2.5 ppm 0.5 ppm 1 ppm +6*SD 0.123 ppm 0.044 ppm 0.0013 ppm 0.068 ppmX
The LOD was also determined by deducing the minimum value of the standard curve (b-value) estimated by the fitting program and by determination of the concentration at which 95% of the samples are positive. In the latter case the protein concentration of the samples is known as expressed in ng/ml. When converting the determined concentration to ppm (=µg/kg), the resulting values were not in agreement with the LOD values determined by the other 2 approaches. The problem is that the kits are not clear in how the results are expressed. The concentration of the standards in a kit is mostly expressed in ppm. When converting this concentration to one in ng/ml, using the following equation, it is not clear if the ‘ng’ indicates hazelnut/soybean or hazelnut/soybean protein. This is however a very important issue to be able to interprete results and be able to compare different kits with each other.
Concentration of analyte in
sample
Used amount of sample to be extracted Used volume of extraction buffer
ng
g
x
g
ml
=
ng
ml
Concentration in extract – SpecificityFor the results of an ELISA test to be reliable it is important that the test is specific for the analyte to be detected. Cor a 1, one of the major hazelnut allergens belongs to the Bet v 1-related proteins. Bet v 1 is one of the major allergens from birch pollen, consequently, hazelnuts and birch pollen can cross-react with each other. Cross-reaction can occur due to related protein structures or amino acid sequences. It is impossible to test all possible allergenic foods to determine the
specificity of a kit; therefore, an alignment was performed of the amino acid sequence of all known hazelnut and soy allergens with BLAST. This resulted in a list of proteins with a certain percentage of sequence similarity, of which the origin was determined. The most frequent sources were selected to be tested in the different ELISA kits.
Another way to approach specificity is to test the bulk ingredients present in food products. These ingredients are present in very high levels and are more likely to cause false-positive results due to cross-reaction. This study will mainly focus on cookies; therefore the main ingredients of common cookies will also be tested in the specificity analysis.
To test the specificity of the hazelnut kits, the tree nuts and peanut mentioned in Directive 2003/89/EU will also be included.
Testing will be performed with a pure protein extract of the selected products.
Table 4: Selected foods to test the specificity of the ELISA kits
HAZELNUT SOY
Bulk proteins milk, egg, wheat, maize, rice, soy, rye, barley
milk, egg, wheat, maize, rice, soy, rye, barley Cross-reacting proteins grape, pea, fig, coffee,
coleseed, linseed
grape, pea, beans, peanut
Nuts pecan, macademia,
walnut, almond, cashew, paranut, pistache,
peanut
– Influence of chemical modification on detection Maillard reaction
Maillard reaction was performed on hazelnut protein extract in the presence or absence of glucose for 48h (details see 2.1.4). Samples were taken at time 0 and after 24 and 48 hours. The sample at time 0 is the reference sample as it did not undergo Maillard reaction. A dilution series was made in the extraction and/or dilution buffer of each ELISA kit. Maillard reaction performed in the absence of glucose did induce no or a small reduction in detection of the hazelnut proteins in the different kits (Figure 7). In the presence of glucose no reduction was seen with the Ridascreen FAST Hazelnut kit. In the other kits the detection was reduced. With the Veratox for Hazelnut and the Hazelnut Residue Detection kit detection was decreased more after 48h than after 24h. With the Biokits Hazelnut Assay a decrease was seen only after 48h.
0,000 0,200 0,400 0,600 0,800 1,000 1,200 1,400 100 1000 10000 O D 6 5 0 conc (ng/ml) Veratox for HN Maillard with glucose
48h 24h 0h 0,000 0,200 0,400 0,600 0,800 1,000 1,200 1,400 100 1000 10000 O D 6 5 0 conc (ng/ml) Veratox for HN Maillard without glucose
48h 24h 0h 0,000 0,500 1,000 1,500 2,000 2,500 100 1000 10000 O D 4 5 0 conc (ng/ml) Ridascreen FAST HN Maillard with glucose
48h 24h 0h 0,000 0,500 1,000 1,500 2,000 2,500 100 1000 10000 O D 4 5 0 conc (ng/ml) Ridascreen FAST HN Maillard without glucose
48h 24h 0h 0,000 0,500 1,000 1,500 2,000 2,500 100 1000 10000 O D 4 5 0 conc (ng/ml)
HN Residue Detection kit Maillard with glucose
48h 24h 0h 0,000 0,500 1,000 1,500 2,000 2,500 100 1000 10000 O D 4 5 0 conc (ng/ml)
HN Residue Detection kit Maillard without glucose
48h 24h 0h 0,000 0,500 1,000 1,500 2,000 2,500 100 1000 10000 O D 4 5 0 conc (ng/ml) Biokits HN Assay Maillard with glucose
48h 24h 0h 0,000 0,500 1,000 1,500 2,000 2,500 100 1000 10000 O D 4 5 0 conc (ng/ml) Biokits HN Assay Maillard without glucose
48h 24h 0h
Figure 7: Analysis of hazelnut protein extract after Maillard reaction in the presence of absence of glucose in the different ELISA kits
Oxidation
Hazelnut protein extract was oxidised with HOCl at pH 8 and pH 5.8 (details see 2.1.4). The analysis was not performed with the Hazelnut Residue Detection kit as it was out of stock at the moment.
No difference is seen between oxidation at pH 5.8 and pH 8 (Figure 8). Oxidised samples could not be detected any more with the Veratox for Hazelnut kit. With the Ridascreen FAST Hazelnut and the Biokits Hazelnut Assay the detection of the strong oxidised samples (5mM HOCl) was lower than the less oxidised ones (2.5mM HOCl). 0,000 0,500 1,000 1,500 2,000 2,500 3,000 100 1000 10000 O D 6 5 0 conc (ng/ml) Veratox for HN Oxidation - pH 8 0 mM HOCl 2.5mM HOCl 5mM HOCl 0,000 0,500 1,000 1,500 2,000 2,500 3,000 100 1000 10000 O D 6 5 0 conc (ng/ml) Veratox for HN Oxidation - pH 5.8 0mM HOCl 2.5mM HOCl 5mM HOCl 0,000 0,500 1,000 1,500 2,000 2,500 3,000 80 800 8000 O D 4 5 0 conc (ng/ml) Ridascreen FAST HN Oxidation - pH 8 0 mM HOCl 2.5mM HOCl 5 mM HOCl 0,000 0,500 1,000 1,500 2,000 2,500 3,000 80 800 8000 O D 6 5 0 conc (ng/ml) Ridascreen FAST HN hydrolysis - pH 5.8 0 mM HOCl 2.5 mM HOCl 0,000 0,500 1,000 1,500 2,000 2,500 3,000 80 800 8000 O D 4 5 0 conc (ng/ml) Biokits HN assay Oxidation- pH 8 0 mM HOCl 2.5 mM HOCl 5 mM HOCl 0,000 0,500 1,000 1,500 2,000 2,500 3,000 80 800 8000 O D 4 5 0 conc (ng/ml) Biokits HN assay Oxidation - pH 5.8 0 mM HOCl 2.5 mM HOCl 5 mM HOCl
Figure 8: Analysis of hazelnut protein extract after oxidation with HOCl (2.5 and 5 mM) at pH 5.8 and 8 in the different ELISA kits
Hydrolysis
Pepsin-hydrolysed hazelnut protein extract (see 2.1.4) was for the moment only analysed with the Veratox for Hazelnut kit. Samples hydrolysed for 15min or 30min showed the same degree of reduced detection (Figure 9).
0,000 0,050 0,100 0,150 0,200 0,250 0,300 0,350 0,400 100 1000 10000 O D 6 5 0 conc (ng/ml) Veratox for HN Hydrolysis 0 min 15 min 30 min
Figure 9:Analysis of hazelnut protein extract after hydrolysis with pepsin in the different ELISA kits
– Spiked matrix: homogeneity testing
First, cookies were made according to the recipe described by Poms et al. in which the dough is spiked with ground hazelnut. Cookies containing 5ppm and 10ppm hazelnut were analysed for their homogeneity. Ten replicates were extracted and analysed in duplo with the Veratox for Hazelnut kit according the manufacturer’s protocol.
From Table 5 it can be concluded that the hazelnut was not spread homogeneously through the dough. For the cookies spiked at 5 ppm one sample has a concentration much higher than the concentration of the other samples, which have a very low concentration. The same is true for four samples of the cookies spiked at 10ppm.
Table 5: Analysis of homogeneity of spiked cookies prepared according to Poms et al.
Spiked level
Retrieved concentration
5 ppm 0.40 0.26 0.37 0.30 0.26 4.56 0.56 0.39 0.38 0.54 10 ppm 0.90 20.21 1.45 1.33 6.07 1.35 1.24 3.81 27.84 1.16
Cookies were then prepared according to the second recipe described by Scaravelli et al.. On the one hand three replicates (1-3) were analysed in duplo, to check the homogeneity of the cookies. On the other hand the homogeneity of the butter was checked by analysing another three samples (4-6), obtained by taking 20 samples of the material and mixing it thoroughly again.
Table 6: Analysis of spiked cookies prepared according to Scaravelli et al
Retrieved concentration Spiked
Level 1 2 3 4 5 6
1 ppm 0.39 0.44 0.32 0.68 1.80 0.60
10 ppm 4.22 3.90 3.93 5.00 4.26 4.60
With this recipe the hazelnut seems to be homogeneously spread, except for some minor deviations at the 1ppm level.
o Conclusion
The LOD/LOQ values determined for the different kits are very low compared to the values provided by the manual of the kit. These measurements were done with pure hazelnut protein extract. Determination of the LOD/LOQ with matrix will better reflect the real situation and will therefore also be performed in a later stage.
To test the specificity of the commercial kits, a selection of bulk ingredients present in cookies was made, together with a list of sources containing proteins with similar amino acid sequences as the known allergens of hazelnut and soy.
After chemical modification the measured protein concentration differs depending on the kit used. This will probably depend on the nature of the antibodies used to construct the ELISA, determining what protein(s) is/are detected. However, this information is not available. It seems that inducing Maillard reaction has a more profound effect on the structure and consequently on the recognition of the proteins by the antibodies than oxidation. To make a conclusion concerning hydrolysis the other kits will have to be tested first.
As it is very important to produce a homogeneously spiked matrix to validate the different kits; the recipe according to Scaravelli et al. will be used to prepare cookies fortified with hazelnut/soybeans. Butter can be melted, making it easier to mix it with the ground hazelnuts/soybeans in a homogeneous way.
3.1.3. Optimisation of DNA extraction
o Partner
ILVO
o Objective
To optimise the yield of the DNA extraction, different pre-treatments of the starting material were tested. These were performed on hazelnut and peanut.
o Methodology
The raw material was frozen at –20°C before applying the pre-treatment. Material was either milled with an analytical mill (Retsch 100 or Retsch ZM-200) or with a kitchen robot. The pre-treatments consisted of soaking the material overnight in water and/or freezing with liquid nitrogen before milling and extraction. DNA was extracted according to the Qiagen Plant DNEasy Mini kit (Westburg), manually or with the QiaCube Robot. The DNA concentration of the extracts was measured using a NanoDropR ND-1000 UV-VIS spectrophotometer
(adsorption spectrophotometry). The integrity of the DNA was checked by loading the DNA extracts on a 1.5% agarose gel.
o Results
H1 A M m an H2 A M m an P1 A M m an P2 A M m an H1 K M m an H2 K M m an P1 K M P2 K M Ma rk er H1 N2 man H2 N2 man P1 N2 man P2 N2 man H1 H2 O +N 2 man H2 H2 O +N 2 man P1 H2 O +N 2 man P2 H2 O +N 2 man Ma rk er H1 N2 robot H2 N2 robot P1 N2 robot P2 N2 robot H1 H2 O +N 2 robo t H2 H2 O +N 2 robo t P1 H2 O +N 2 robo t P2 H2 O +N 2 robo t Ma rk erFigure 10: Analysis of hazelnut and peanut DNA extracts after pre-treatment (AM=analytical milling, KM=kitchen milling, N2=freezing with liquid nitrogen, H2O=soaking in water, man=manual extraction, robot=extraction with Qiagen robot)
The extraction yield was higher with analytical milling than with kitchen robot milling. Pre-treatment of the samples by soaking in water resulted in degraded DNA (Figure 10, smear on gel). The highest yield was obtained by pre-treatment with liquid nitrogen and analytical milling and in addition this resulted in non-degraded DNA.
The quality of the extracted DNA was further tested through PCR reactions targeting conventional sequences, such as 18S ribosomal DNA (different primers), an intergenic spacer in 18S ribosomal DNA (ITS1/2 primer pairs) and a non-coding chloroplast DNA-specific sequence (primers PLANT1/2). All extracts were amplifiable, which indicates that the DNA is of good quality and no PCR-inhibitors are present.
o Conclusion
The best way to treat samples before extracting DNA is freezing them with liquid nitrogen and milling them with an analytical mill. Interfering compounds, such as polysaccharides, RNA, proteins, fat fractions and salts have to be eliminated from the DNA extract. The Qiagen Plant DNEasy mini kit produces amplifiable and thus good quality DNA. Extraction with the Qiagen robot delivered some problems with regard to the presence of a fat layer, as nuts have a high fat content. Therefore, manual extraction is preferred.
3.1.4. Application of controlled chemical reactions to allergen proteins
o Partner
UGent
o Objective
Many foods are processed for various reasons: to increase food quality, improve taste and flavour and extend shelf life by inactivation of microbes and toxins. However, many of these processing steps have a profound influence on protein structure and hence on allergenicity and antigenicity (e.g., detectability by the immunological tests). Processing can elicit an unintentional effect on allergenic foods, but it may also be a tool to produce non-allergenic or hypo-allergenic foods (Poms and Anklam, 2004). Therefore, the aim of this study is to determine the influence of processing on allergenicity and detectability by the commercial available methods. The soybean and hazelnut allergen proteins are subjected to several controlled chemical reactions (in a buffer solution or in a suitable food model system) and their impact on the protein itself and on its immunochemical detection is assessed.
o Methodology
– Model systems Protein extraction
Hazelnut and soybean protein extracts were obtained according to the protocol described earlier by Yeung and Collings (Yeung and Collins, 1996) with slight modifications (see 2.1.1).
Protein oxidation in the absence of lipids
Whey (Lacprodan® DI-9224, Arla Foods), hazelnut and soybean protein
oxidation was induced using HOCl, a strong oxidizing agent. A 200 µl protein solution (10 mg/ml) was oxidized with 50 µl HOCl (0 – 200 mM) at 30°C for 10 min. After incubation samples were immediately immersed in ice in order to stop the reaction.
Protein oxidation in the presence of lipids
The 1 % (w/w) soybean oil-in-water emulsions were prepared in 50 mM MOPS buffer pH 7.4 by homogenizing 1 % (w/w) oil with 2% (w/w) proteins at 10000 rpm for 1 min using the Ultra Turrax. The emulsions in sealed falcon tubes were oxidized at 50°C in the presence of 10 µM copper sulphate solution and 0.2 g/l sodium azide as antimicrobial agent. Defatting was performed with 3 times the volume of the model system with technical hexane. The defatted fraction was finally diluted to a known volume with PBS and protein content was determined.
Maillard reaction in the absence of other proteins
Maillard reaction was studied in a model system consisting of 10 mg/ml protein and 60 mg/ml glucose in phosphate buffer 0.1 M which was heated at 70°C for up to 48 hours. After incubation, samples were cooled immediately on ice.
Maillard reaction in the presence of other proteins
Maillard reaction was also studied in the presence of soluble wheat proteins. One model system consisted of 2.5 mg/ml whey, hazelnut or soybean proteins and 7.5 mg/ml soluble wheat proteins incubated with 60 mg/ml glucose. Another model system consisted of 5 mg/ml whey, hazelnut or soybean proteins and 5 mg/ml soluble wheat proteins. The model systems were incubated in phosphate buffer 0.1 M, pH 7.4 for 48 h at 70°C. After incubation samples were cooled immediately on ice to stop the reaction.
Protein hydrolysis
Proteins were subjected to a peptic hydrolysis with 1:250 pepsin/protein (w/w). The hydrolysis was stopped at different sampling points by increasing the pH to 6.
– Assessment of the chemical modifications Protein carbonyls
Protein carbonyls were assessed using the 2,4-dinitrophenyl-hydrazine (DNPH) assay. The conventional spectrophotometric method was used for which 300 µl oxidized proteins were incubated for 1 h with 400 µl DNPH 10 mM in 2 M HCl. The proteins were precipitated with 10 % trichloroacetic acid (TCA, final concentration) and the pellet was washed with 1 ml ethanol/ethyl acetate (1:1) to remove unreacted DNPH. The final pellet was redissolved in 500 µl 6 M urea for hazelnut and whey proteins and in 500 µl 8 M urea for soybean proteins. Finally the absorbance was measured at 370 nm. The carbonyl content was calculated using a molar absorption coefficient of 22000 M-1 cm-1 and results were expressed as nmol
carbonyls /mg net protein. Free and total thiol groups
The oxidation of the sulphur containing amino acids was monitored using 5,5’-dithiobis-(2-nitrobenzoate) (DTNB) as previously described by Beveridge et al. (Beveridge et al., 1974). Total thiol groups were determined in a similar manner after a previous reduction of the disulfide bridges with 2-mercaptoethanol. Free and total thiol groups were calculated using molar absorption coefficient of 13600 M-1
cm-1 and results are expressed as µmol SH groups/g net protein.
SDS-PAGE
Protein cross-linking or fragmentation was analyzed by SDS-PAGE under reducing conditions. A stacking gel with 4 % acrylamide and a resolving gel with 10 % acrylamide were used. Samples were prepared with mercaptoethanol and
heated at 95°C for 5 min then directly loaded on the gel. Krypton fluorescence staining was used for bands visualisation.
Available lysine
The amount of available lysine was monitored using derivatisation with ortho-phthaldialdehyde (OPA) in the presence of 2-mercaptoethanol which yields a fluorescent product with a maximum excitation wavelength of 340 nm and emission 450 nm (Ferrer et al., 2003). A standard of β-casein was used to prepare a calibration curve and samples were pre-treated and analyzed using a fluorimeter as previously described by Morales F.J. et al. (Morales et al., 1996).
Free amino groups
Free amino groups were determined using trinitrobenzenesulfonic acid (TNBS) as previously described by Fields R. (Fields, 1971) and results were expressed as nmol amino groups/mg protein using the molar absorbance coefficient of the TNB complex which is 22000 M-1 cm-1.
Protein determination
Protein determination was performed by determining the nitrogen according to the Kjeldahl procedure. A factor of 6.38 was used to convert nitrogen to whey protein, 5.71 to convert nitrogen to soybean protein and 5.41 to convert nitrogen to hazelnut protein. The non protein nitrogen (NPN) was determined in the supernatant after a previous protein precipitation with 15% TCA (final concentration).
Assessment of the lipid oxidation degree
Soybean oil was oxidized under UV light (235 nm) at 35 °C. Oxidation degree of the oils used in the reaction systems was followed by iodimetric determination of the peroxide value according to the AOCS official method Cd 8-53. The secondary oxidation products of the oils used in the reaction systems were determined by measuring the p-anisidine values according to the AOCS official method Cd 18-90.
Fatty acids composition
The determination of fatty acids composition was done by means of gas chromatography based on the American Oil Chemist’s Society Official Method Ce 1b-89. The triacylglycerols were saponified with a methanolic NaOH solution. Subsequently the fatty acids were esterified with BF3/MeOH – reagent in the
presence of sodium hydroxide. The methyl esters were further separated using gas chromatographic equipment (Agilent Technologies 6890N).
o Results
Protein oxidation in the absence of lipids
Formation of carbonyls is one of the most prominent changes in proteins due to oxidation and the spectrophotometric method used for their determination is the most common method used to evaluate protein oxidation in foodstuffs.
Many sources indicate that pH has an important influence of the protein oxidation; therefore the pH of the protein mixture during oxidation was monitored in order to make sure that it stays stable for all the HOCl concentrations used. Several studies (Hawkins et al., 2003) concluded that –OCl is more reactive than
the protonated acid (HOCl) and reacts more readily with the amine groups therefore the maximal rates of reaction occur at pH values that are the average of the pKa values for HOCl and amines (~ 8.5).
To test the pH effect on protein oxidation experiments were performed in phosphate buffers 0.1 M of pH 5.8 and 8. Further, the formation of protein carbonyls and oxidation of free and total thiol groups were determined. Non-oxidized hazelnut protein isolate contained about 1,82±0,49 nmol of carbonyls/mg protein (Figure 11). As shown in Figure 11, the carbonyl content in hazelnut protein isolate increased with increasing HOCl concentration and constituted 39,84±2,30 and 40,68±1,04 nmol of carbonyls/mg proteins at pH 8 and pH 5,8 ,respectively, when 5 mmol HOCl/g protein were used. However, no significant difference between the carbonyls formed in pH 8 and pH 5,8 could be seen. Non-oxidized soybean protein isolate contained about 1,01±0,21 nmol of carbonyls/mg proteins in phosphate buffer pH 8 and 1,08 ±0,08 nmol of carbonyls/mg proteins in phosphate buffer pH 5,8. As shown in Figure 12, the carbonyl content of oxidized soybean protein isolates increased almost linearly with increasing HOCl concentration up to 55,89±1,94 nmol of carbonyls/mg proteins and 52,51±4,94 nmol of carbonyls/mg proteins at pH 8 and pH 5,8 respectively. Similar as for hazelnut protein isolate, no significant difference between the amounts of protein carbonyls formed for the two buffers used could be seen.
0 5 10 15 20 25 30 35 40 45 0 1 2 3 4 5
m m ol HOCl/g hazelnut protein
n m ol c a rb o n y l/ m g h a z e lnut p rot e in pH 8 pH 5,8 0 10 20 30 40 50 60 70 0 1 2 3 4 5
mmol HOCl/g soybean protein
nm ol c a rbo ny ls /m g s oy be a n pr o te in pH 8 pH 5,8
Figure 11: Effect of the pH and HOCl concentration on the formation of protein carbonyls in hazelnut isolates; the data are mean values ±SD of three independent determinations
Figure 12: Effect of the pH and HOCl concentration on the formation of protein carbonyls in soybean isolates; the data are mean values ±SD of three independent determinations)
On the other hand thiols are crucial targets for oxidation. Conversion of sulfhydryl groups into disulfides and other oxidized species is one of the earliest observable events during oxidation of proteins. Ellman method is a simple, rapid and direct method to determine the SH and –S–S– group content in proteins. The Ellman spectrophotometric method is based on the reaction of DTNB with the free thiol groups in a protein and formation of a disulfide bond with releases of a thiolate ion which is coloured and has a maximal absorbance at 412 nm.
The loss of total thiol groups in hazelnut protein isolate due to HOCl induced oxidation was more prominent at pH 5,8 then at pH 8 (Figure 13). The total SH groups contents of non oxidized hazelnut protein were 104,58±1,30 µmol/g proteins at pH 8 and 85,85±0,91 µmol/g proteins at pH 5.8. Non-oxidized soybean protein in pH 8 contained 15,89±0,68 µmol free SH groups/g proteins while in pH 5,8 contained 10,93±0,09 µmol free SH groups/g proteins. Free thiol groups were completely oxidized after oxidation with 1,25 mmol HOCl/g protein. For the total thiol groups 50 % decrease was registered after oxidation in phosphate buffer pH 8 with 5 mmol HOCl/g protein and for pH 5,8 they were almost completely oxidized (Figure 13).
Total SH groups of soybean protein decrease drastically after the protein isolate was oxidized with different concentration of HOCl (Figure 14). The total SH group’s content of non-oxidized soybean protein was lower at pH 5,8 (98,12±5,76 µmol/g proteins) then at pH 8 (112,95±11,24 µmol/g proteins). Free SH groups also decrease during protein oxidation (Figure 14) in both buffers. Non-oxidized soybean protein isolate in pH 5,8 contained 10,54±0,13 µmol free SH groups/g proteins while at pH 5,8 contained 4,16±0,48 µmol free SH groups/g proteins. Similarly as for hazelnut protein isolate, the decrease of free and total thiol groups is more drastic at pH 5.8 than at pH 8. This is however in contradiction with the literature data which indicate that higher pHs lead to more severe protein oxidation. The reason for the more drastic changes in protein sulfhydryl groups at pH 5.8 could probably be due to conformational changes in the protein at different pHs. Consequently, this makes the thiol groups more accessible to the HOCl attack when they are oxidized in phosphate buffer pH 5,8 compared to oxidation in phosphate buffer pH 8. -2 0 2 4 6 8 10 12 14 16 18 0 1 2 3 4 5
m m ol HOCl/g hazelnut protein
µm o l f ree S H /g h a z e ln u t pr o te in 0 20 40 60 80 100 120 µ m o l t o ta l SH /g h a z e ln u t pr o te in
pH 8 free SH pH 5,8 free SH pH 8 total SH pH 5,8 total SH
-2 0 2 4 6 8 10 12 0 1 2 3 4 5
m m ol HOCl/g soybean protein
µ m o l f ree S H /g so yb ean pr ot e in 0 20 40 60 80 100 120 140 µ m o l t o ta l S H /g so yb ean pr ot e in
pH 8 free SH pH 5,8 free SH pH 8 total SH pH 5,8 total SH
Figure 14: Loss of free and total SH groups in soybean protein isolate due to oxidation with different concentration of HOCl in buffer pH 8 and pH 5,8; the data are mean values ±SD of Figure 13 : Loss of free and total SH groups
in hazelnut protein isolate due to oxidation with different concentration of HOCl in buffer pH 8 and pH 5,8; the data are mean values
During oxidation –NH2 groups of amino acids residues can be readily converted
into carbonyls through a deamination process (Levine et al., 1994). On the other hand, loss of free amino groups in the oxidized proteins may also be a result of reaction of the amino groups with carbonyls which in turn leads to their decrease. The loss of free amino groups in hazelnut protein isolate oxidized with different HOCl concentrations was more prominent at pH 8 then at pH 5,8. A decrease from 18,38±2,87 nmol of free amino groups/mg protein till 6,35±1,31 was recorded at pH 5,8 and till 2,43±1,11 nmol of free amino groups/mg protein at pH 8 (Figure 15). In the case of free amino groups loss in soybean protein isolate due to oxidation with HOCl in different pHs, in contrast to the results obtained for free and total thiols groups, the loss of free amino groups was again more prominent at pH 8 then at pH 5,8 (Figure 16). This is in good agreement with the literature data which indicate that higher pHs during HOCl induced oxidation leads to more severe changes in proteins.
The SDS-PAGE pattern of the soybean protein oxidized with HOCl indicates that the intensity of some major protein bands is decreasing (Figure 17). However no additional bands indicating smaller aggregate formation or fragmentation of the protein could be seen. Moreover, high molecular weight aggregates formed due to HOCl induced oxidation were not able to enter the gel.
0 5 10 15 20 25 0 1 2 3 4 5
mmol HOCl/g hazelnut protein
n m ol f re e a m in o gr ou p/ m g h a z e lnu t pr ot e in 6 pH 8 pH 5,8 0 10 20 30 40 50 60 70 0 1 2 3 4 5
mmol HOCl/g soybean protein
nm ol f re e a m ino gr ou p/m g s oy be a n pr ot e in pH 8 pH 5,8
Figure 15 : Loss of free amino groups in hazelnut proteins isolates after oxidation with different HOCl concentrations in buffer pH 8 and pH 5.8; the data are mean values ±SD of three independent determinations
Figure 16: Loss of free amino groups in soybean proteins isolates after oxidation with different HOCl concentrations in phosphate buffers pH 8 and pH 5.8; the data are mean values ±SD of three independent determinations
A B 1 2 3 4 5 MWM kDa 1 2 3 4 5 MWM Da 250 150 100 75 50 37 25 20 aggregates k 250 150 100 75 50 37 25 20
Figure 17: SDS PAGEpattern of the soybean protein oxidizedwith HOCl in phosphate buffer 0.1M pH 8 (A) and pH 5.8 (B). Lane 1 – soybean oxidized with 0 mmol HOCl/g protein, lane
2 - soybean oxidized with 1.25 mmol HOCl/g protein, lane 3- soybean oxidized with 2.5 mmol HOCl/g protein, lane 4 - soybean oxidized with 3,75 mmol HOCl/g protein, lane 5 - soybean oxidized with 5 mmol HOCl/g protein, lane 6 – molecular weight marker (MWM).
The SDS-PAGE pattern of the hazelnut protein oxidized with HOCl is similar to the one obtained for soybean protein with formation high molecular weight aggregates due to oxidation (Figure 18).
A B 1 2 3 4 5 MWM 1 2 3 4 5 MW 250 150 100 75 50 37 25 20 aggregates M 250 150 100 75 50 37 25 20
Figure 18: SDS PAGE SDS PAGEpattern of the hazelnut protein oxidizedwith HOCl in phosphate buffer 0.1M pH 8 (A) and pH 5.8 (B). Lane 1 – hazelnut oxidized with 0 mmol HOCl/g protein, lane 2 - hazelnut oxidized with 1.25 mmol HOCl/g protein, lane 3- hazelnut
oxidized with 2.5 mmol HOCl/g protein, lane 4 - hazelnut oxidized with 3,75 mmol HOCl/g protein, lane 5 - hazelnut oxidized with 5 mmol HOCl/g protein, lane 6 –
molecular weight marker (MWM)
Protein oxidation in the presence of lipids
Association of lipids with proteins occurs during the preparation of the isolate and is favoured by the denaturation of the proteins during the process. This denaturation results in exposure of the hydrophobic amino acids, hidden in the native protein, and the subsequent association between the aliphatic chains of
lipids and these amino acids by hydrophobic unions. Lipids associated with protein isolates are susceptible to oxidation during processing and storage of the products. Lipid oxidation leads to formation of many compounds such as hydroperoxides and their secondary degradation products (aldehydes, ketones, hydrocarbons, etc.). These compounds are responsible for unacceptable flavours and cause many changes in the functional and nutritional properties of the isolates as a result of their covalent interaction with proteins. Several amino acids, mainly cysteine, methionine, histidine, tryptophan, tyrosine, and lysine, are affected by the oxidation products of lipids, resulting in a reduced bioavailability (Sanchez-Vioque et al., 1999). In the same time, lipids associated with soy protein isolates for example were found to contribute to protein insolubility and protein oxidation (Liang, 1999).
In the presence of oxidizing lipids, protein oxidation is manifested by free radical chain reactions similar to those for lipid oxidation. The attack of reactive oxygen species on proteins leads to destruction of amino acid residues and the generation of carbonyl compounds. This formation is one of the most salient changes in oxidized proteins (Salminen et al., 2006). Therefore, to study the effect of fresh and oxidized soybean oil on the oxidative modifications of whey, hazelnut and soybean protein isolates, incubated with oils, the carbonyl content of the proteins was measured by derivatization with DNPH. This is the most common method used to evaluate protein oxidation in foodstuffs. Carbonyl compounds derived from lipid oxidation may increase the protein carbonyl values in the DNPH assay. Therefore, proteins were first defatted prior to the DNPH assay. Beside this, they were precipitated and thoroughly washed after the derivatization, hence any unreacted DNPH or DNPH bound to any other component than protein was removed.
Soybean oil oxidation was induced by UV light at 35°C.This allowed to evaluate the impact of oils with different oxidation degrees on protein oxidation. It is generally accepted that the first compounds formed during oxidation of oil are hydroperoxides. The usual method of hydroperoxide assessment is by determination of the Peroxide Value. The peroxides in oxidized oil are transitory intermediates, which decompose into carbonyls and other compounds. P-anisidine assay measures the level of aldehydes, principally 2-alkenals, present in the oils.
indicates the p-anserine value and peroxide value of the oils used for the reaction systems while Table 8 indicates the fatty acids composition of the oils.
Table 7: Peroxide and P-anserine value of the oils used in the reaction systems
Oil type Peroxide value (meq
O2/kg) P-anisidine value
Oxidized soybean oil 25.00 ± 0.23 8.66 ± 0.33 Fresh soybean oil 2.02 ± 0.15 4.40 ± 1.01
Olive oil 7.85 ± 0.15 5.18 ± 0.21
Fish oil 3.27 ± 0.04 12.37 ± 0.83
Sunflower oil 1.36 ± 0.05 11.63 ± 0.26 Table 8: Fatty acid composition of the oils used in the reaction systems Oils Plamitoleic acid(C16:1) Oleic acid(C18:1) Linoleic acid(C18:2) Linolenic acid(C18:3) EPA (C20:5) DHA (C22:6) Oxidized soybean 0.102 26.207 0.432 6.341 0.156 - Fresh soybean 0.103 25.771 0.407 6.417 0.147 - Olive 0.787 75.262 0.020 0.827 0.072 - Fish 7.916 13.927 5.689 0.978 18.124 12.001 Sunflower 5.889 32.432 0.198 0.153 0.248 -
The measurements of protein oxidation demonstrate that model systems with fresh fish oil led to the formation of highest level of carbonyls after 120 h incubation with hazelnut, soybean and whey proteins (Figure 19, Figure 20 and Figure 21). Fish oils are rich in polyunsaturated fatty acids which are susceptible to oxidation, therefore, leading to the formation of their peroxides. Due to this, their presence in protein food can result in oxidation and protein damage (Saeed and Howell, 1999). It is evident from the data that mainly polyunsaturated oils (sunflower and fish oil) were able to stimulate carbonyl formation of proteins (Figure 23). As previously reported by (Refsgaard et al., 2000), the ability of fatty acids to form protein carbonyl formation is strongly dependent on the degree of unsaturation and increases with the degree of unsaturation, in the order C18:2< C18:3< C20:4. The metal-catalyzed oxidation of the polyunsaturated fatty acids is leading to the formation of several products that have been shown to form carbonyls derivatives with proteins. These include malondialdehyde, α, β – unsaturated aldehydes and lipid peroxides which can be converted to alkoxyl and peroxyl radical that can react directly with side chains of some amino acids residues to form carbonyl derivatives. Olive oil, which contains mainly monounsaturated fatty acids, led to the formation of very little amounts of protein carbonyls even after 120 h incubation at 50°C.
0,0 1,0 2,0 3,0 4,0 5,0 6,0 7,0 8,0 9,0 10,0 0 20 40 60 80 100 120 140 Time (h) nm ol c a rbony ls /m g s o y pr o te in
olive fish sunflower
0,0 5,0 10,0 15,0 20,0 25,0 30,0 35,0 40,0 45,0 0 20 40 60 80 100 120 140 Time (h) nm ol c a rbony ls /m g w he y p rot e in
olive fish sunflower
Figure 19 : Formation of carbonyls in soybean protein isolates incubated with oils with different degrees of unsaturation, the data are mean values ±SD of three independent determinations
Figure 20: Formation of carbonyls in whey protein isolates incubated with oils with different degrees of unsaturation, the data are mean values ±SD of three independent determinations 0,0 2,0 4,0 6,0 8,0 10,0 12,0 14,0 16,0 18,0 0 20 40 60 80 100 120 14 Time (h) nm ol c a rb ony s l/ m g h a z e lnu t pr o te in 0
olive fish sunflower
Figure 21: Formation of carbonyls in soybean protein isolates incubated with oils with different degrees of unsaturation, the data are mean values ±SD of three independent
determinations
The reaction between the breakdown products of peroxides and proteins has received considerable attention over the last years. It is well known that end-products of lipid peroxidation, such as malondialdehyde and 4 – hydroxy – nonenal, cause protein damage by means of reactions with amino groups, sulfhydryl groups and imidazole groups of amino acids. To test the possibility that lipid hydroperoxides formed during the oxidation of oils contribute to the generation of protein carbonyls, we incubated protein isolates with oils with different oxidation degrees (see Table 7). Incubation of whey and soybean protein isolate with oxidized soybean oil led to a substantial increase in the level of protein carbonyls (©Figure 22,Figure 23). However in the case of hazelnut protein isolate incubated with oxidized oil no significant increase in the amount of protein carbonyls could be seen as compared to the reaction system incubated with fresh oil (Figure 24). This is probably due to the fact that the amount of hydroperoxides and secondary oxidation products is not high enough to induce formation of such high level of protein carbonyls.