HAL Id: tel-00465952
https://tel.archives-ouvertes.fr/tel-00465952
Submitted on 22 Mar 2010HAL is a multi-disciplinary open access archive for the deposit and dissemination of sci-entific research documents, whether they are pub-lished or not. The documents may come from teaching and research institutions in France or abroad, or from public or private research centers.
L’archive ouverte pluridisciplinaire HAL, est destinée au dépôt et à la diffusion de documents scientifiques de niveau recherche, publiés ou non, émanant des établissements d’enseignement et de recherche français ou étrangers, des laboratoires publics ou privés.
Browsing a Classification of an Image Collection
Erwan Loisant
To cite this version:
Erwan Loisant. Browsing a Classification of an Image Collection. Interface homme-machine [cs.HC]. Université de Nantes, 2005. Français. �tel-00465952�
No ED 366-240
UNIVERSITÉ DE NANTES
UFR SCIENCES ET TECHNIQUES
É
COLE
D
OCTORALE
S
CIENCES ET
T
ECHNOLOGIES
DE
L’I
NFORMATION ET DES
M
ATÉRIAUX
2006
Thèse de Doctorat de l’Université de Nantes
Spécialité : Informatique
Présentée et soutenue publiquement par
Erwan LOISANT
le 10 Décembre 2005
à l’UFR Sciences et Techniques, Université de Nantes
Browsing a Classification of an Image
Collection
Jury
Président : Noureddine MOUADDIB, Professeur
Rapporteurs : Mohand BOUGHANEM, Professeur• Univ. Paul Sabatier (Toulouse)
Mohand-Said HACID, Professeur• Univ. Claude Bernard Lyon 1
Examinateurs : Hiroshi ISHIKAWA, Professeur• Univ. Métropolitaine de Tokyo
Directeur de thèse : Pr. José MARTINEZ
Laboratoire : LABORATOIRE D’INFORMATIQUE DENANTES ATLANTIQUE. 2, rue de la
favet neptunus eunti
BROWSING A CLASSIFICATION OF AN IMAGE
COLLECTION
Parcours de la Classification d’une Collection d’Images
Erwan LOISANT
⊲⊳
Erwan LOISANT
Browsing a Classification of an Image Collection ??+102 p.
Ce document a été préparé avec LATEX2εet la classethese-LINAversion 0.92 de
l’as-sociation de jeunes chercheurs en informatique LOGIN, Université de Nantes. La classe these-LINAest disponible à l’adresse :
http://www.sciences.univ-nantes.fr/info/Login/
Impression : nantes.tex – 29/6/2006 – 14:35
Acknowledgements
The first persons I wish to thank for this work are my two directors, Prof. José MARTI -NEZ from the Polytechnic School of the University of Nantes on the French hand, and Prof.
Hiroshi ISHIKAWA from Tokyo Metropolitan University on the Japanese hand, as well as Prof. Noureddine MOUADDIB from the Polytechnic School of the University of Nantes.
Preparing a Ph.D. between two universities can be both administratively and scientifically difficult, but these three professors offered me their time and energy for my Ph.D. studies to be such a great experience.
Also, I am grateful to the Japanese Ministry of Research and Education
(Monbukagaku-sho) that granted me a scholarship while most Japanese students have to fund their studies by
themselves.
I acknowledge assistant professors of Tokyo Metropolitan University, Dr. Manabu OHTA
and Dr. Kaoru KATAYAMA for their help during my studies. I would also like to thank my Japanese colleagues for the insights that they gave to me: Shohei YOKOYAMA who made me taste every single Japanese dish, and Takuya WATANABE who was my guide into the Japanese
otaku culture. More generally, all these years I appreciated all the members of Prof. Ishikawa’s
laboratory, first for welcoming me so kindly despite the poor Japanese level I had when I arrive, then for the numerous karaoke parties on Wednesday night.
Next, let me have a kind thought to all the developers of the open source softwares that I used to implement my work and run the experiments (Ruby, gcc, ImageMagick, LATEX, Linux,
gnuplot. . . ).
Last, but no least, I lasted my family and my friends who were waiting for me in France and encouraged me all along this project. I thank them all for their permanent support.
Contents
Contents 7
Introduction 15
1.1 Querying vs. Browsing . . . 17
1.2 Outline . . . 18
Part I — State of the Art
Content-Based Image Retrieval (CBIR) 25 2.1 Introduction . . . 252.2 Generalities on Image Retrieval Systems . . . 26
2.2.1 Problem definition . . . 26
2.2.2 Architecture . . . 30
2.3 Commonly Used Techniques for Image Retrieval Systems . . . 30
2.3.1 Images representation . . . 31
2.3.2 Similarity measures . . . 36
2.3.3 Feedback loop . . . 39
Navigation Through an Image Collection 41 3.1 Disposing Images in a Space . . . 41
3.1.1 The El Niño Project . . . 43
3.2 Using a Navigation Structure . . . 44
3.2.1 Navigation Structures for Multimedia Data . . . 44
Part II — Efficient Structures for Navigating an Image Collection
8 CONTENTS
4.1 A meta-model for navigation-based “retrieval” on images . . . 49
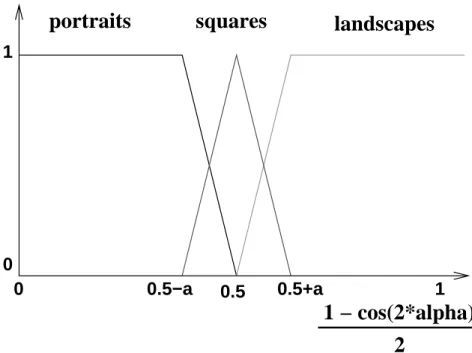
4.1.1 Fuzzy linguistic labels for colour . . . 50
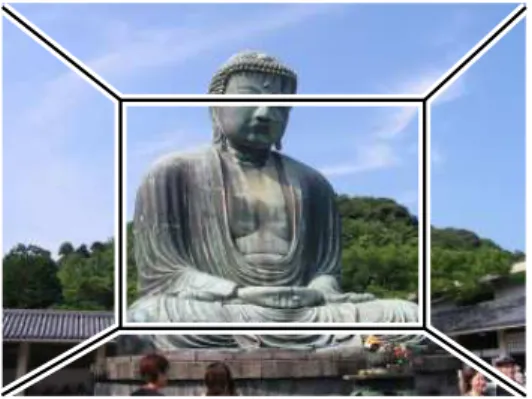
4.1.2 Syntactical division . . . 51
4.1.3 General geometrical measures . . . 52
4.1.4 Binary model . . . 54
4.1.5 Resulting models . . . 56
4.2 Navigation on a concept lattice . . . 56
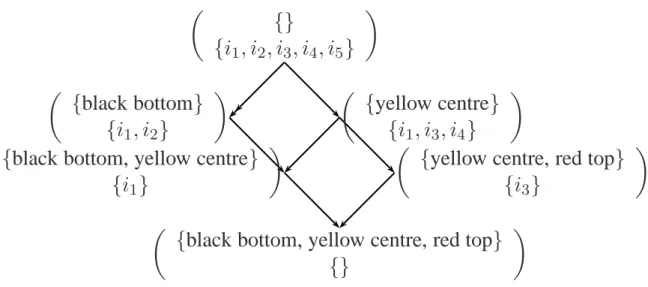
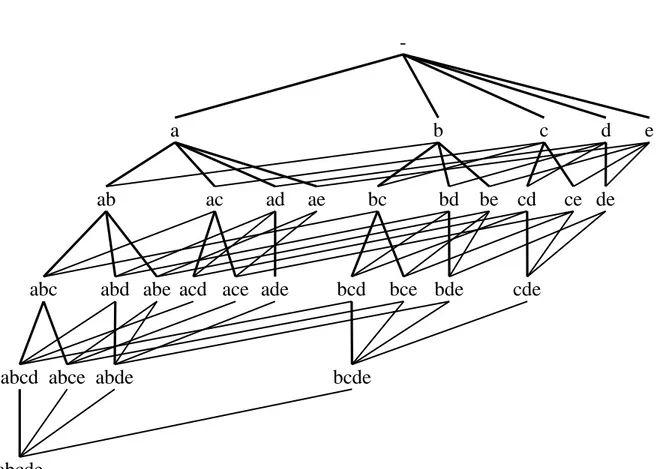
4.2.1 Galois’ Lattices . . . 56
4.2.2 Building a Galois’ lattice . . . 58
4.2.3 Using a Galois Lattice as a Navigation Structure . . . 60
4.3 Implementation . . . 60
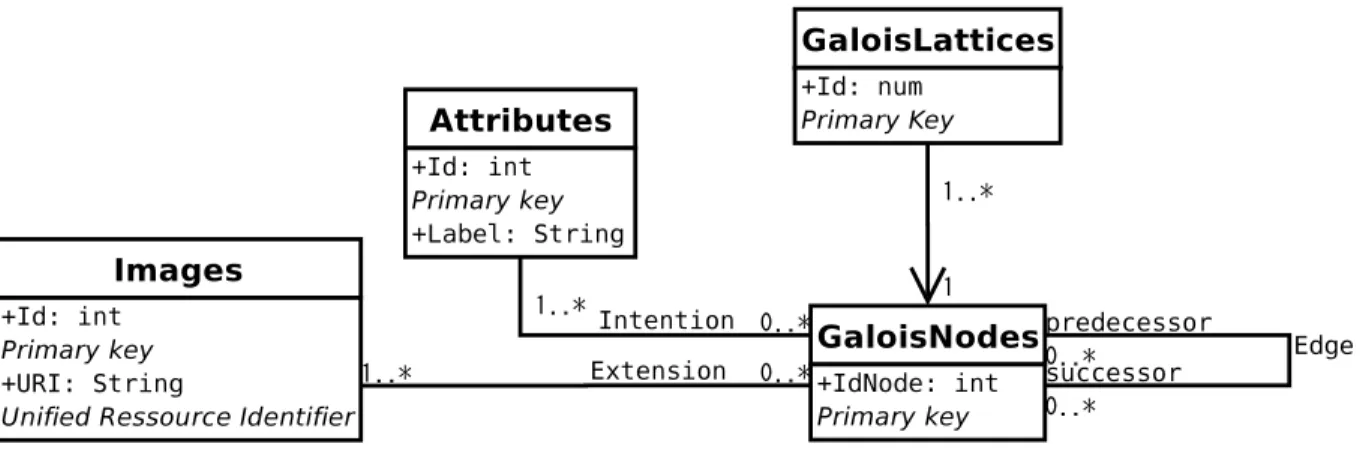
4.3.1 Indexing a Galois Lattice in a RDBMS . . . 62
4.3.2 Architecture . . . 63
4.4 Experiments . . . 63
4.4.1 Results . . . 65
Additional Clustering 67 5.1 Details on the Clustering Method . . . 68
5.1.1 Learning summaries from data . . . 69
5.1.2 Selecting summaries for lattice generation . . . 70
5.1.3 Building Galois’ lattice of summaries . . . 71
5.2 Hypermedia representation . . . 71
5.2.1 Inter-clusters navigation . . . 71
5.2.2 Intra-clusters navigation . . . 72
User Personalisation and Sub-Lattices 75 6.1 Masking lattices . . . 75
6.1.1 Formalisation . . . 76
6.2 Masking techniques . . . 76
6.2.1 Node masking . . . 76
6.3 Conclusions . . . 78
From a Fuzzy Model to Crisp descriptions 79 7.0.1 Variable Threshold . . . 80
7.0.2 Key Matching Fuzzy Insertion . . . 81
7.1 Evaluation and Experiments . . . 83
7.1.1 Results . . . 83
7.2 Conclusions . . . 87
Conclusions 89 8.1 Benefits and Limits to Our Proposal . . . 90
8.2 Further Work . . . 90
8.2.1 Applications to Other Media Type . . . 90
CONTENTS 9
List of Figures 93
Résumé
This chapter is an overview in French of the whole paper.
Les données dites multimédia (images, vidéos) se distinguent des données classique par une densité variable d’information et l’impossibilité de normaliser ces données. Du fait de ces particularités, de nouvelles techniques d’indexation et de recherche d’information ont du être etudiées.
Il y a principalement deux problèmes a résoudre pour la recherche d’information dans les collections multimédia (ou les bases de données multimédia) : (1) la representation des don-nées et (2) le processus de recherche du point de vue de l’utilisateur. Dans le cas des bases de données, l’indexation est fortement liée a ces deux problèmes.
Dans le cas particulier des images, on distingue trois grandes classes:
– la recherche par requêtes formelles, heritée des bases de données classiques
– la recherche avec boucle de retour, où l’utilisateur fait partie intégrante du processus de recherche, et
– la navigation où les images sont organisées en une structure preparée à l’avance, utilisée comme index et comme structure de recherche.
C’est sur cette troisième approche que nos travaux se sont portés ; nous nous sommes en effet interessés au treillis de Galois, une structure de graphe permettant d’organiser les éléments d’une relation binaire.
Une telle structure de navigation a plusieurs avantages sur une approche classique basée sur des requêtes : en particulier, elle permet d’affranchir l’utilisateur d’une phase de rédaction de requête.
Naviguer au sein d’un collection d’images par les treilis de
Ga-lois
Dans ce chapitre, nous présentons le meta-modèle de données utilise ainsi que la première proposition de technique de recherche d’images par la navigation.
12 CHAPTER 0 — CONTENTS
La representation des données est semi-structurée, et notre proposition est un ensemble de métriques basées sur le contenu de l’image et classées suivant le modèle MPEG-7. Ces métriques sont principalement :
– Des informations de couleurs classées par zones. Les couleurs sont issues d’une segmen-tation de l’espace a partir du repere HSV (teinte, saturation, luminosité).
– Des informations sur la forme générale de l’image (taille, orientation, élongation)
A partir de ces métriques, à chaque image est associée un ensemble d’attributs formant une relation binaire entre les images et ces attributs. De cette relation binaire est calculé un treillis de Galois, structure utile pour la navigation.
Partionnement complémentaire
Dans ce chapitre, nous proposons d’apporter des réponses au problème majeur posés par les treillis de Galois : le passage á l’échelle.
Pour cela, la structure de navigation est améliorée par un couplage à un système de partion-nement, basé sur le projet SAINTETIQ [60] de l’Université de Nantes.
Le treillis n’est alors plus construit sur les images directement mais sur des ensembles d’images similaires. La navigation devient elle aussi à deux niveaux, une navigation
inter-partitions et une navigation intra-partition.
Personalisation et sous-treillis
L’information de contenu des images est généralement insuffisante pour représenter les images telles qu’elles sont vues par un observateur humain. Par exemple, on peut voir une photographie de la Tour Eiffel similaire á une photographie de l’Arc de Triomphe (deux monu-ments parisiens) tandis qu’un systéme basé uniquement sur le contenu verra plutô l’image de la Tour Eiffel proche d’une image de la Tour de Tokyo (dont la forme est la même).
Cependant, se baser sur une annotation manuelle pose plusieurs problèmes : non seulement cette annotation est très couteuse, mais le résultat est subjectif. Pour une image donnée, deux annotateurs fourniraient un résultat différent ; même un seul annotateur fournirait un résultat différent si on lui demandait d’annoter la même image a quelques semaines d’intervalle.
Dans ce chapitre, nous proposons donc d’offrir à l’utilisateur la possibilité d’établir lui-même les liens entre les images qu’il rencontre. Le problème de la subjectivité devient caduque puisque l’utilisateur effectue l’annotation pour lui-même, et le coût de l’annotation est indolore puisque intégré au processus de recherche lui-même.
Ceci est réalisé par l’application de masques sur une structure commune basée sur l’infor-mation de contenu, resultant en une navigation sur des sous-treillis de Galois. Ce procédé est ainsi plus efficace que les systémes de recherche basés sur une boucle de retour, et plus pertinent qu’un systéme basé uniquement sur une structure pré-calculée.
CHAPTER 0 — CONTENTS 13
Seuillage dynamique
Dans la partie présentant la navigation par treillis de Galois, nous avons vu qu’un modèle flou était adapté à la representation des images, tandis qu’un treillis de Galois nécessitait une relation binaire entre images et propriétés.
La solution la plus simple, utilisée dans la première partie de cette étude, consiste à appliquer un seuil constant à toutes les images. Cependant, un tel seuil est très sensible au bruit et des nœuds réduits à un élément, rendant la navigation plus complexe font leur apparition.
Dans ce chapitre, nous présentons une technique de seuillage dynamique tenant compte de la structure existante lors de l’insertion de nouveaux éléments. Quand une image doit être insérée, l’insertion dans un nœud existant est préférée á la création de nouveaux nœuds. Pour cela, un seuil plus ou moins sévère est appliqué aux propriétés.
CHAPTER 1
I
NTRODUCTION
While the ultimate goal of computer science has always been to mimic the human brain [80], in the first days of computing a computer was a machine used to perform mainly mathematical and accounting operations. Shortly, its main goal became to organise data and make the retrieval of information as easy as possible by way of so-called “databases”. It is interesting to note that while the English word of “computer” describes it as a machine to count, the French word for computer, “ordinateur”, means a machine to sort, to organise (data). The English word have been decided very soon, while the French word have been decided when the first commercial computers became available for companies, in the 1960’s, at a time when databases were already the major applications.
Nowadays, a computer can be used for almost every need (from artistic creation, to playing, to communicating), though retrieving information from larger and larger collections is still do-minant. The fact that data sources are now interconnected brought new challenges to the data-base/information retrieval communities. The time when data was rare and the format could be precisely and strictly determined is over; this century’s data is heterogeneous. Retrieval should be done using data of various nature, from various sources, in various format and with various quality.
Moreover, the increasing capacities of the storage devices made it possible even for end-users to keep a large quantity of data, thus enlarging the field of applicability of database and information retrieval techniques. Applications that used to be based simply on a file-system (thus allowing only hierarchical sorting) such as music applications or image viewers are now backed-ended by a database. Consequently a user can now have his or her own music database and photograph database instead of relying simply on the file-system.
In the meanwhile, the nature of the data to index and retrieve became quite diverse. Origi-nally, structured information appeared as “tables” into relational database management systems (RDBMS), the fields of which were limited to simple types, namely, numbers, strings, and a few extras such as dates. Unstructured information appeared essentially as normalised textual infor-mation. Nowadays, it includes structured and semi-structured natural language texts, images, sounds, and videos. To distinguish these new, non-classical data from the former ones, we call them multimedia data. Note that if this name suggests that several data types are used together, we follow the convention of the information retrieval community and use this term even if only
16 CHAPTER 1 — Introduction
one data type - such as images - is used. We use this term as long as the data type on which we work cannot be easily and unambiguously described, because it contains various information, the interpretation of which depends on the observer’s culture or sensibility.
Among multimedia data, we are particularly interested in images. In recent years, we saw an explosion of the number and size of digitalised images, not only on the world wide web or on images providers catalogues but also in private collections of individuals. The success of digital cameras made digital images collection accessible to anyone, and recently mobile phones equipped with a camera also participated in the growth of image digital collections. In Japan, from mid-2004 even cheapest devices were equipped with a digital camera.
The images accumulated need to be organised in order to be retrieved easily when the user needs to. Digital camera usually store additional information when recording an image, using the EXIF format: date, flash, focal length. . . A few of these information, such as date, may be relevant to classify images in a way useful for user. Other informations may also be added to the image when the photograph is taken, for example in mobile phones a positioning system is often available and my be used to locate the photograph in the space. However, these informations are usually not enough to perform a useful classification.
Professional content providers (like Corbis) chose to annotate manually images using a semantic thesaurus. In image hosting websites like Flickr.com, any visitor can annotate the image he or she is visioning by adding any keyword, called within Flickr a tag.
The professional annotation approach gives very good results, but very few individuals are willing to take the time to annotate their images for a better classification. On the other hand, the collaborative approach works well for some keywords (like city names or real-world object) but suffers from a lack of standardisation. For example, on the website Flickr a tag such as “cameraphone” is very popular (people who took pictures from their mobile phone) but it has no semantic meaning. A user looking for a photograph of a mobile phone equipped with a camera will be submerged by photographs taken using a mobile phone.
Consequently, several authors started to work on a way to organise images in a completely automatic way, using information extracted from the pixels of the image (content information). Chapter 2 gives an overview of existing projects on content-based image retrieval systems (CBIR). As explained in this chapter, there exists several approaches to retrieve images from an image collection or an image database; the most classical method being querying a system where images have been previously indexed.
In our work, we preferred to focus on navigating through an image collection that have been organised before-hand in a similarity-based structure. This approach cannot completely replace query-based retrieval, but we believe that it is superior for answering some users’ needs. When a user does not have a precise idea of what he or she is looking for, or when his or her idea cannot be easily described by a query (either based on a language or a visual sketch), an approach based on navigation allows him or her to quickly browse a sub-part of the collection in order to rapidly locate the subset of images that s/he is looking for. Being a still visual media, images are particularly adapted to this kind of approach. Effectively, textual documents have to be read, audio files have to be listened to, and video files have to be played back (or a lot of images extracted in order to build a still large storyboard). In contrast, a rather large set of thumbnails of images can be scanned by a human observer in a short time.
CHAPTER 1 — Introduction 17
Therefore, in this thesis, we introduce a technique for navigating through an image collec-tion using a graph structure useful both for indexing and for navigating, namely a Galois’ lattice. A prototype has been developed using some basic metadata on the image content (mostly colour information) presented in section 4. We also present different improvements to this approach, as well as details on implementation in a relational database management system.
1.1
Querying vs. Browsing
The aim of our work is to provide a full proposal for content-based image retrieval, from metadata extraction to image search itself, to be implemented into a fully working prototype. Rather than successively executing query on a database, our work is focused on a navigation-based process that integrates the user into the search process and thus ensures a permanent feedback between the user and the system.
A common problem in CBIR systems is that the user is usually unable to understand the underlying model used by the system. Cases where a user looks for an image knowing which colours or shapes he or she likes, and how to describe it, are very rare. In a navigation pro-cess, the user does not need to describe his or her need. He or she just browses the collection, constructing a path from an entry point to the images he or she mostly likes.
When looking at most proposals of navigation through a multimedia collection, we noticed that they are usually built as a layer over similarity search: they recreate a new state from user input, and display it to the user for another interaction.
Kaester et al.’s work [34] proposes to combine several input methods to search for images, including touch screen (to select parts of images or perform gestures) and speech recognition. By using these non-classical input methods Kaester could produce a graphical interface that makes the user feels like he or she is navigating the image database, however this system is still based on similarity search: the user will actually select images or parts of the images for the system to find images similar to these samples. The collection is stored by using multi-dimensional indexing techniques.
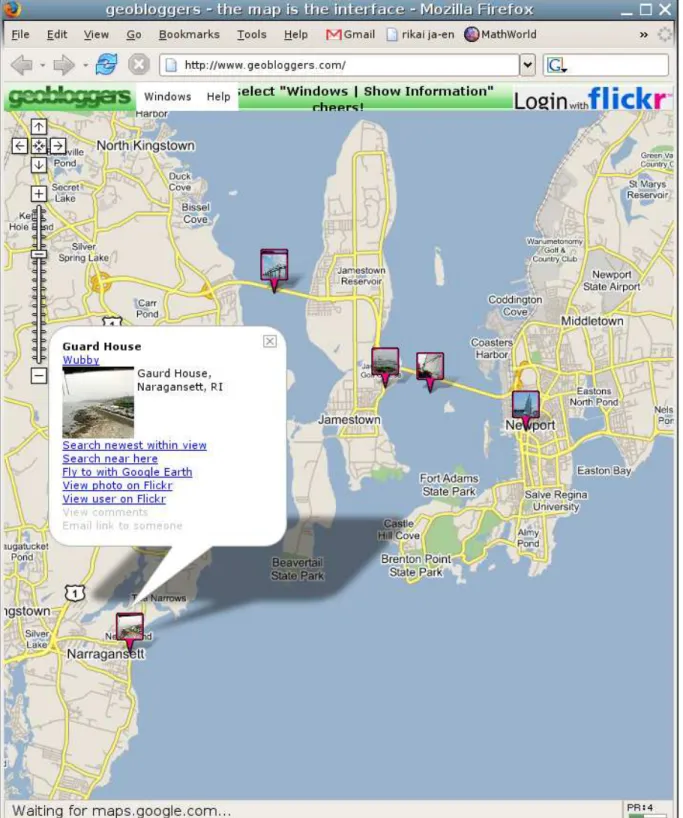
In their project El Niño, Santini et al. worked on integrating browsing and querying [69]. Their proposal is a set of search engines connected by a mediator that dispatches the queries to the search engines, collects the results and displays them to the user. Images are arranged on a two-dimensional plane, and the user interacts with the system mainly by two ways:
– By clicking on an image, the user asks the system to move this image to the centre. From the user’s point of view, he or she is moving inside the collection; from the system’s point of view, the user is launching the query “find and display the images similar this one.” – By drag-and-dropping images, the user teaches the system similarities that were not
present. The user can then tell the system that from his or her point of view, two images are similar. In other words, this is a user-personalisation process.
Our work is very different from Santini’s or Kaester’s ones in the sense that it is based on a navigation structure that is built before-hand. Consequently, there is no calculation during the search process; this leads to a very fast and responsive system.
18 CHAPTER 1 — Introduction
Since other systems formulate a query at each iteration, they have to face (1) the cost of the formulation of a query using user feedback and (2) the cost of the execution of this query. In a multidimensional space, both of these operations are quite costly.
Compared to other systems performing navigation through image collections [32] [68], our system has the particularity to use directly the index structure for the navigation itself. On the contrary, the others build during retrieval process a path that is not directly linked to the index structure.
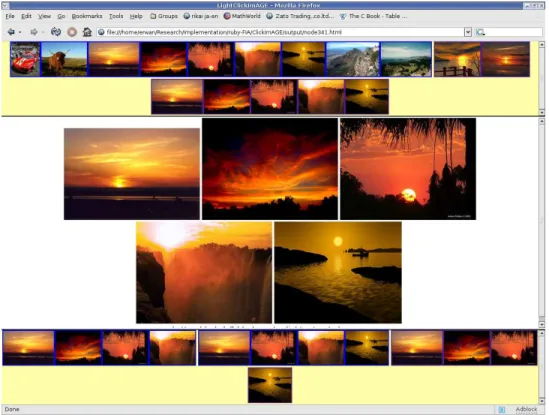
While we have to face a more costly process to index our images, once the collection is indexed, the search process is very fast and responsive. Additionally, it is very easy to publish. The navigation structure can even be produced in the form of a set of static XHTML (see Figure 4.6), and for example burned on a CD-ROM.
1.2
Outline
State of the Art
This first part is a bibliographical work on content-based image retrieval (CBIR). Here we present the two problems of CBIR, the specificities of this branch compared to classical blems of databases or information retrieval: (1) the data representation and (2) the search pro-cess itself from a user point of view.
Usually used techniques are also described in this part:
– Similarity measures, an approach even now widely used for CBIR, and
– feedback querying, algorithmically more costly than simple similarity-based query but much more relevant. Moreover, feedback querying introduced the idea of integrating user into the search loop.
We then present a more recent approach for CBIR, whose the current proposal is part of:
navigation through an image collection. In this section, we precise the main advantage of
navi-gation over the other approaches: there is a continuity in the search process; rather than incre-mentally make queries on the system, the user just navigate through it converging to the image s/he was looking for.
Navigating an Image Collection Using Galois’ Lattices
In this chapter, we present the meta-model used as well as our first proposal of navigation through a collection of images.
Data representation is semi-structured, and our proposal is a set of metrics based on image content and classified according the MPEG-7 model. These metrics are mainly:
– Colour information classified by zone. Colours come from a segmentation of the colour space from the HSV space (hue, saturation, value).
– Informations on general shape of image (size, orientation, elongation).
From these metrics, an attribute set is associated to each image forming a binary relation-ship between the images and these attributes. From this binary relationrelation-ship a Galois’ lattice is calculated. A Galois’ lattices is a structure useful for navigation, detailed in section 4.2.3.
CHAPTER 1 — Introduction 19
During our experimentations, we were able to build a lattice of slightly more than 5,000 images, this number being mainly limited by the space complexity of the algorithm.
As a navigation structure, the advantages of Galois’ lattices are really numerous.
– First of all, it is very fast to navigate through a graph structure that has been computed off-line. If we neglect the time required to load sample images, navigating from one node to another is optimal, i.e., inO(1). This was one of the main requirements.
– Then, a Galois’ lattice is intrinsically a multi-dimensional classification technique. In-deed, no dimension is privileged. Hence, it can be seen as a structure that dichotomises the hyper-cube associated to the property subsets along any hyper-plane.
– Consequently, the distance from theinf or sup nodes1 of the graph to any other node is
at most logarithmic in the number of used properties.
– Next, this tool is insensitive to correlations. There is no distance computation. If all images with a given property (almost) always exhibit another property, then the images will simply be located within the same node.
– Also, this tool helps to correct the users’ mistakes very easily. Whenever a user selects a direct descendant node, he or she adds implicitly a new constraint. If he or she figures out, much later, when seeing more specific sample images, that this browsing direction is slightly bad, he or she just has to move to a different direct ancestor node. This operation removes a constraint and undoes the erroneous move without having to go back to the point where the “error” actually occurred.
– The Galois’ lattice structure easily hides unwanted features. This is a problem that cannot always be taken into account by similarity measures. (A counter-example is Surfimage [50], but the measures are limited to mean and variance of supposed Gaussian distribu-tions.)
However, Galois’ lattice used as a navigation structure also have drawbacks.
– Constructing a Galois’ lattice is not an easy task. The time complexity is inO(n2) where
n is the number of nodes (see the details in the section 4.2). Theoretical improvements on
this bound are still unknown to our knowledge, and algorithmic variants do not achieve actual improvements in the implementations [26].
– Also, the description space associated to a Galois’ lattice is exponential in the number of properties. (We easily use several hundreds!) Of course, this should not occur, unless we index such a large number of images. However, if several images share common proper-ties but have unique properproper-ties too, then a (localised) exponential explosion appears. The first drawback, scalability, is addressed in section 5 by proposing to navigate on image
clusters rather than directly on images.
The second drawback is addressed is section 7 with a technique to build the lattice while limiting the creation of new nodes, and avoiding creation of nodes concerning a very small number of elements.
20 CHAPTER 1 — Introduction
Complementary Clustering
In the previous section, we claimed that scalability is an important issue for Galois’ lattice. Indeed, the time complexity is quadratic and the space complexity is exponential. Consequently, depending on the computer speed and memory we can easily build a Galois on 5,000 images; if the data have a lot of similar images, on a system with a lot of memory we can expect to reach 10,000 images. However, even with the increase of computer power and the decrease of memory price, it is very unlikely that we can ever build the Galois’ lattice for a bigger collection using current algorithms. This is a serious problem since today’s images collections may reach the million of images.
Thus, we propose to improve the structure by associating it to a clustering system, based on the SAINTETIQ project [60] of Nantes University.
The lattice is no longer constructed directly on images but on similar images collections. These collections are supposed to be different from each others and internally homogeneous. Navigation becomes two-level, an inter-cluster navigation and an intra-cluster navigation.
Using such a technique, if we build about 3,000 clusters of 200 images, we can reach very large databases, i.e. about one million images.
Personalisation and Sub-lattices
Content information of images is usually not enough to represent them as seen by a human observer. For example, a photograph of the Eiffel Tower and a photograph of the Arc of Triumph can be seen as very similar: both represent a monument of Paris. However, a system based only on content will lack the information “Paris” and would rather see the Eiffel Tower similar to Tokyo Tower, that have the same shape.
However, using only manual annotation has several drawbacks: not only this annotation is very expensive, but the result is subjective. For a given image two annotators would produce two different results. Even the same annotator would produce a different result if asked to annotate the same image after a few weeks.
In this chapter, we propose to offer to user to establish himself links between images he or she can find. The problem of subjectivity becomes pointless since user establish the annotation for himself; there can be no distortion between the annotator and the user. Moreover, the cost of annotation is painless because it is integrated into the retrieval process.
This is implemented by applying masks on a structure common to all users based on image content, resulting in a navigation on sub-lattices. This process is more efficient than systems using a user feedback for querying, and more accurate than systems based solely on a structure calculated before-hand.
Dynamic Threshold
In the part introducing Galois’ lattices, we established that while a fuzzy model was adapted to represent images, a Galois’ lattice needs a binary relationship between images and descrip-tions.
CHAPTER 1 — Introduction 21
The most trivial answer, used in our first prototype ofClickIm
AGE [40] and in the first part
of this work, was to apply a constant threshold to all images. However, such a threshold is very sensible to noise and nodes reduced to a single element appear, making navigation more complex.
In this part, we present a dynamic threshold technique taking existing structure into account when inserting a new node. When an image is to be inserted, this algorithm will prefer to insert it into an existing node rather than to create a new one. To achieve it, the threshold applied to property will vary according the existing lattice.
P
ART
I
CHAPTER 2
C
ONTENT
-B
ASED
I
MAGE
R
ETRIEVAL
(CBIR)
2.1
Introduction
Image databases are part of digital libraries. Research performed in the last ten years led to several prototypes: Amore (Advanced Multimedia-oriented Retrieval Engine), BlobWorld, CANDID [35], Chabot/Cypress [52], CORE (Content Object Retrieval Engine) [84], FIRST (Fuzzy Image Retrieval SysTem),F indIm
AGE [39], IDQS (Image Database Query System) [83],
ImageRover, Jacob, MARS (Multimedia Analysis and Retrieval System) [53], MetaSeek, MIR (Multimedia Indexing and Retrieval), MMIS (Multimedia Information System), MULTOS (MUL-Timedia Office Server) [45], NeTra [38], Picasso [11], PicHunter, PIQImage, PhotoBook [55], QBIC (Query By Image Content) [19], RetrievalWare, SQUID (Shape Queries Using Image Databases), SurfImage [49], Virage, VisualSEEK [73], WebSEEK [10], WebSeer, Xenomania, etc.
Although the wide use of image databases is quite recent, they have been integrated in most commercial systems (such as Multimedia Manager from IBM, Oracle and SQL Server from Microsoft) for several years. These systems may be used in applications involving images, such as interior design tools or simply retrieval in images collections, from image providers (such as CorbisTM), or personal photographs collections (like Google’s PicasaTM, or Gnome’s F-Spot). A
recent application is image hosting websites (such as Flickr.com, Fotoflix.com or Buzznet.com) offering to anyone to post photographs, either to share it with family and friend or to publish them publicly.
In the first section, we shall explain the specific problems of image databases (IDB). In short, it is needed to design a description scheme for images based on various informations (colour, shape, format, human annotations. . . ). Then for each property a similarity measure must be described. Finally, various retrieval methods have to be designed to satisfy various users goals. This tend to a very flexible architecture.
Second part will cover most common properties (both content-based and annotation-based) used for IDB, as well as similarity measures on them. Then the three main retrieval techniques
26 CHAPTER 2 — Content-Based Image Retrieval (CBIR)
- query, relevance feedback and navigation - will be presented with examples. A particular at-tention will be given to navigation as the current proposal is a navigation-type retrieval method.
2.2
Generalities on Image Retrieval Systems
Most general case is the open systems case, such as the World Wide Web, where images and users are very various. First, using knowledge on the content type is not possible. Moreover, the user is not an expert and cannot understand most of the properties associated to images and consequently the reason why some images may be returned after a given query. Finally, an open system has a quick turn-over rate: images are often added and removed, limiting the property calculus to low-cost algorithms.
In the contrary, a lot of bases are limited to images of a particular class. These domains are numerous: news images, architecture images, medical images, botanic images, satellite images, face images, etc. Working on a particular class gives additional informations that must be ex-ploited.
2.2.1
Problem definition
The main specificity of images as data is that, unlike for example textual information, the similarity between two images is far to be the direct similarity of low-level information, pixels.
2.2.1.1 Defining Content
The first difficulty of the study is on the definition of the word “content”. Image representa-tion is semi-structured [1] and can be qualified as:
– irregular: several image types coexist (grey-scale, colour, with or without colour in-dex. . . );
– incomplete: all informations are not necessarily extracted for all images. This is mainly due to the cost of processes and the existence of heterogeneous sources, for example in QBIC [19];
– extensible: one must be able to add new properties to take into account new techniques or integrate a new image type;
– applicative: images are not manipulated independently but rather in a schema. In this domain, authors agree to consider a hierarchy between low-level data and high level data (semantic and logic) from artificial vision proposals [3].
Lower level is the intrinsic content, directly linked to the physical signal and usually repre-sented by a matrix of pixels, the canonic representation. Automatic processes can then extract qualitative and general informations from images, the most classical being histograms.
On the other hand, the external or semantic informations have to be provided manually. The title, subject, author are part of this category. Keywords are the most generic metadata an image can receive; they may be organised in a thesaurus or not. These metadata are usually not quantifiable, but belief degrees may smooth the transition (“very”, “quite”, “a little”). The
CHAPTER 2 — Content-Based Image Retrieval (CBIR) 27
problem then becomes the same as textual information retrieval: incomplete index, ambiguity, time and space variable [20].
However, with the increasing digitalisation techniques, some semantic attributes may be associated automatically to the image: author, place, date and time, etc. These are a mix of semantic and quantifiable informations.
In the same way, images associated to documents give additional informations. For example, WebSEEK [10] and Google Images indexing web pages use the tag content. Actually, these systems make use of a manual index that is not done at the moment of the insertion into the database but “at the source”.
Moreover, techniques to automate the semantic knowledge extraction exist, applicable to reduced images classes:
– After a learning phase, some keywords may be automatically associated to images regions (sky, grass, leafs, skin. . . ) [62] [56];
– In the domain of Renaissance paintings, [11] exploits rules from an art book to derive even feelings from images. For examples, the religious feeling is represented by an important quantity of red and blue;
– Chabot [52] gives a simple horizon detection algorithm (indexed images being landscape images);
– [78] proposes a classification between indoor pictures and outdoor pictures; – etc.
Finally, note that an image database, unlike an image retrieval system, gives naturally addi-tional informations. The schema of the database and the application gives the structure of the base and consequently the structure of included images. For example, an image associated to a “City” instance has a high probability to be an urban image.
Of course, the transition from visual content to metadata is progressive. For example, seg-mentation techniques isolating significant regions from an image require knowledge and may be very specific (adapted to medical images), or very general (for example based on colour).
We can oppose the low-level data and the high-level data on several criteria: – intrinsic to extrinsic content;
– general to specific properties; – quantitative to qualitative properties – automatic to manual extraction; – objective to subjective properties.
The hierarchy defined causes a major difficulty for retrieval, related to subjectivity. Indeed, the system works on the low level data while the user thinks in the higher level [67].
On the one hand, some authors prefer the minimal semantic extraction. Indeed, experiments show that using semantic informations greatly improves the results quality [52] [9].
On the other hand, other authors prefer an approach where only the low-level data is ex-plicitly used. There are two reasons to this choice: the existence of a latent semantic, and the introduction of subjectivity in high-level semantic.
First of all, combining low-level data leads to satisfying results. Then, a latent semantic exist: for example the grass is usually green, the sky is blue and the skin of Caucasian people
28 CHAPTER 2 — Content-Based Image Retrieval (CBIR)
is orange. CANDID actually makes use of this approach, where combining several low-level characteristics can make an implicit high-level criteria appear.
Another reason to limit deliberately the highest knowledge level is because, becoming sub-jective, it does not apply any longer to all users. [67] even argues that since the semantic of an image cannot be formally described, we should limit the study to finding correlation between user’s goals and characteristics that can be extracted from images. It is not reasonable to ask a system to see a similarity between a portrait of the French President Chirac and a photograph of the Japanese Prime Minister Koizumi for the only reason that both of them are political leaders. Even from the name it would be a hard task. Consequently an image retrieval system should be limited to a system to find relevant images using vision capacity but not automatic vision. The system cannot “see” the images like an human would do, but will rather help a human to classify them automatically.
2.2.1.2 Defining retrieval
Content being defined, an information retrieval system has to be designed. However, the users are various; for that reason the system should offer several retrieval methods. Actually, representing queries is as important as representing images. More precisely, an image retrieval system is a couple of image representations and query representations.
The following list presents several interrogation ways that have been implemented in several prototypes:
– The oldest is of course queries from keywords describing the image contents, image da-tabases becoming textual dada-tabases;
– the interrogation from a sample image quickly appeared, the image being one from the base or provided by user;
– a variant is asking the user to sketch the image he or she is looking for (for example “a red disk on a green background” to find rose images [19]);
– for a better precision, especially in textures, an image may be constructed from fragments of other images from the base [38];
– an extension is an annotated sketch (globally or locally) to precise characteristics that should be taken into account [73] and possibly retrain them to particular values;
– this last proposal is close to query using a formal language combining structural data and visual content [52] [39];
– an extension of this approach is to provide semantic descriptions like “find images inclu-ding a character in a red dress with, at his feet, a small white dog”;
– finally, relevance feedback approaches appeared, system trying to discover or simply im-prove conditions that will make an images subset relevant.
There are indeed a large panel of possibilities but it can be clarified. We can actually classify retrieval techniques into three basic and complementary approaches, whatever the usage is to be done:
– Formal querying where accent is put on specifying the image to find, in other words the construction of a query (even if the interrogation language may be very simple, reduced to a linear function);
CHAPTER 2 — Content-Based Image Retrieval (CBIR) 29
– feedback querying where the user is a part of the retrieval process;
– navigation-based “retrieval” allow the user to move into a before-hand calculated struc-ture.
Formal querying Formal querying may be done via a query language as well as in a graphical
way, thus interactive.
Graphical querying is more comfortable and usually simplified form of the query writing [8] [38] [73]. However, it can be almost necessary in some cases, like selecting a colour from a palette rather than describing digital values [19].
Retrieval by formal query actually consists in specifying the description of a virtual image, i.e. a value range that several attributes should respect, these properties being linked by an implicit conjunction.
Despite the apparent simplicity of this “classical” approach, two new elements appear. First, it is better to use an approximate interrogation rather than a strict interrogation. Then, multi-dimensional indexing problems appear.
Using a formal query language brings several advantages. It allows querying an image data-base with a strong integration of digital data, images contents [52] [39] as well as the application schema. Still in the case of a multimedia DBMS, queries may be done on a subset of the base [9] improving both the process time and the result quality. Queries may also become views allowing to solve other queries [52]. Note that this is the only way to build non-interactive applications.
Feedback querying The previously described formal approach is valid neither for ad hoc
interrogation, nor for naive users. Feed-back querying is very important in an image retrieval system: images cannot be easily described. Consequently, redaction “mistakes” are common and require rewriting, until finally obtaining a relevant images subset.
It is necessarily interactive; the user is actually a part of the retrieval process. The result of the query is not one of the subset successively displayed to the screen but only the “last”. Finally, the user decides when the retrieval process is finished (unless the system is unable to return any image). For that reason, for the user to perform the retrieval intuitively and efficiently, the user interface should be carefully designed. In this way the user will make better use of his cognitive capacities and improve the results convergence. Of course, the system performances and reactivity will also improve the user experience and thus the retrieval efficiency.
In the general approach, the user will annotate several images as examples or counter-examples. The system must features inference techniques [49] [41]: it will have to determine automatically the relevant criteria. In other words, it will have to discover weights that discri-minate the examples from the counter-examples. At each iteration, the system constructs and improves, with the help of the user, a new formal query.
Let’s note that the most commonly used approach used to be lookup from a unique sample image, or a particular region from an image [83]. The user’s work is then to set weights on different properties. This is between a formal approach and a feedback approach: the final spe-cification is obtained by the “right” weights and the “right” sample image.
30 CHAPTER 2 — Content-Based Image Retrieval (CBIR)
Navigation After these two retrieval forms, the third way is the possibility to navigate through
the schema of the database (images but also related data in the image database). It has been showed that in certain cases, hypermedia can be an alternative to a DBMS [51].
Navigation is a very efficient retrieval form that, as well as relevance feedback, combines the system advantages with the user’s vision. Indeed, if the similarities between images have been stored in the base, find the images that are similar to a given images is done in an instant: the system’s work has been done before-hand. Then, the user is to choose an exploration direction rather than another. The navigation technique itself may be more or less complex, but the main work consists in a before-hand classification [9] [29] [70]. This approach being also interactive, it can easily be combined with the previous retrieval modes [32]. The interrogation allows to find entry points in a “clusters” structure, then the navigation allows to explore these sub-spaces. The classification results may also be used in formal queries, images classes being interpre-ted as views (subsets) or taxonomies (additional properties) or more simply as binary associa-tions between close images.
2.2.2
Architecture
From these generalities, we note that the points to make clear are: the images representation, the similarity measures, the physical index techniques, the user implication in retrieval process and more recently the images classification.
Thus, the heart of an image retrieval system or an image database must be flexible [84]. First, it must adapt itself to new informations, known before-hand or learnt, that means that the design must be very open. Then, it must discover the user’s goals to improve results relevance, including experimented users.
On a technical point of view, chosen architecture should not be a limiting factor. The mo-dule should be adaptable as well in database driven applications as in more open systems, like artificial vision systems. However, we will not talk about this aspect.
2.3
Commonly Used Techniques
for Image Retrieval Systems
Elements introduced about architecture will now be partially formalised. We should indeed deal with a set of extensible and application-adaptable elements. For that reason, we will limit our study to fundamental elements.
Images will be modelled as semi-structured objects through a set of properties of very va-rious nature. Several mathematical tools are used to characterise one or more property types: mathematical morphology, fractals, statistics, transforms (Fourier, wavelet, Gabora. . . ), etc. We will keep statistical tools as simple as histograms as a basis to discuss the choice of good cha-racteristics. Then, we will see how to build similarity measures on these properties as well as on their combinations. A few inference techniques will be cited.
CHAPTER 2 — Content-Based Image Retrieval (CBIR) 31
2.3.1
Images representation
While being very important, images representation is very open. Consequently, the schema of an image class in an image retrieval system may only be introduced in a generic way, as a semi-structured object:
I = CN (2.1)
Where C is a polymorphic characteristics set. Later, we shall use CC to talk about the set of
values of theC characteristic as well as the relating I → C function.
It is a hard task to find characteristics that represent the best an image content. These pro-perties have to respect as much as possible the following criteria, that are sometimes opposed [5]:
– exhaustivity: characteristics must cover the whole important elements of image;
– compacity: discriminant information coding must be compact in order to reduce simul-taneously storage and process costs, either before-hand by choosing relevant elements, either later by dimensionality reduction techniques [16]
– robustness: characteristics must be tolerant to the noise that appears for different reasons: photograph taken in bad conditions, digitalisation done with poor material, strong image compression. . .
– discrimination: though characteristics are supposed to be complementary and used toge-ther, each characteristic must by itself allow to differentiate a lot of image classes; – precision: characteristics should be calculated with a precision equal to human eye, in
order to allow an advanced discrimination;
The compacity condition prevents the use of canonic representation of images. For instance, Chabot stores only thumbnails in the database, images itself being stored on optical disks [52].
There are several pieces of data to take care of in order to organise adequately an image database [3]. The standardisation effort of MPEG-7 [47, 48] separates:
1. the format information (stereo for audio, infra-red for image. . . ), 2. the physical information (sound energy, main colours. . . ), 3. the perceptual information (male voice, hot colour. . . ),
4. the structural information (splitting a video into planes, an image into regions. . . ), 5. the intrinsic metadata (keywords. . . ),
6. the miscellaneous annotations.
In this study, we will use the MPEG-7 classification to define metadata; however we will not make use of every layer proposed by the MPEG-7 proposal.
2.3.1.1 Low-level data
Colour and textures are one of the most used low-level characteristics, because it is very close to the description that a human observer may do. Several colour models exists, answering to different needs, from physical models (RGB being the main) to perceptual models based on a separation of value, saturation and hue and normalised models (XYZ, L*u*v*, L*a*b*). Texture is generally represented by granularity, contrast and direction [19].
32 CHAPTER 2 — Content-Based Image Retrieval (CBIR)
Since [77], histograms are still a base for a large number of propositions:
h : (Ej) → (E → [0, 1])
(ej)j∈J 7→ {e → (ej(e|ejj=e))j∈Jj∈J|e ∈ (ej)j∈J}
Where(EJ) is a data family, indexed by elements of the J set, and E → [0, 1] is the function
associating its frequency to each data family, i.e., the corresponding histogram.
Histograms may be single or multi-dimensional. For example, in a quantified colour space, one can create tri-dimensional histograms with J = N × N for the coordinates system and E = N × N × N for pixel values.
Histograms feature exhaustivity, robustness and precision. However, they are neither parti-cularly compact nor very discriminant in large IDB [54].
The compacity problem may be solved by creating value classes, also reducing processing time. In the case of colour, one may create conceptual classes, i.e., a non-uniform segmentation of the colour space (9 hues in F indIm
AGE [39]). This segmentation may even suppress the
tri-dimensionality of the colour space, by replacing the three histograms by a unique one. However statistical measures cannot be done any longer on such histogram.
The discrimination problem is deeper. It is due to the lack of correlation between an histo-gram’s modalities. The compression we discussed above solves it partially but in a too strong way since it limits the number of images classes that can appear.
When using a full histogram is not possible, using an acceptable number of inertia move-ments (average then centred momove-ments) can express as finely as possible the histogram’s shape. Most authors use only two to four moments. [76] shows that an approach by inertia moments combines a maximum of advantages.
µ : (E → [0, 1]) → [0, 1] h 7→P ∀jj.h(j) (2.2) mn: (E → [0, 1]) → [0, 1] h 7→P ∀j(j − µ(h))n.h(j) (2.3) The inertia moments interpretation depends on the chosen characteristic. For a greyscale histogram, average simply represents the average intensity; the standard deviation represents contrast, the third represents asymmetry and finally the fourth represents the flatness.
As for texture, first moments are also used, at least four. However, spatial orientation is important and other techniques must be used to determine granularity and directionality as well as other characteristics such as rugosity, periodicity, regularity, complexity, etc. [31]. Moreover, there does not seem to exist a better representation model for texture [57] [56].
However, histograms or inertia moments are still a too general representation of an image. In too large bases, several images may look very different but have very close histograms.
2.3.1.2 Colour models
The international standard for colour definition was established by C.I.E. in 1931. However, this colour model is not commonly used in the computer graphic industry.
CHAPTER 2 — Content-Based Image Retrieval (CBIR) 33
Figure 2.1 – The Red-Green-Blue colour model
For computer image manipulation, technical colour models like RGB or CMYK are prefer-red. Those models reflect the way pixels’ colours are produced by the rendering device. Those technical models are not suitable for human intuitive colour representation. For instance, the
pink colour is not easy to describe in term of red, green and blue combination. More accurate
models, also said perceptual models are then used. The first of those models was proposed by A.H. Munsell in 1915.
The RGB colour model is also known as the additive model, since it is based on adding red,
green and blue light. It is physically easy to create, this is why monitors and screens are using this model to produce a colour image. However, the red, green and blue components have no meaning for a human observer, and semantic information is poorly separated by this model. Consequently, this model is not adapted to information retrieval.
The HSV colour model is recognised to be one of the most perceptually evident for users
[25]. HSV stands for Hue, Saturation and Value. All those components are immediately unders-tandable as they reflect the way artists compose their colour: they first choose the Hue of the colour from different tubes, next they set the saturation by adding white and finally set the value by adding some black. In this model pink is seen as a red hue with some white in it to decrease its saturation. In the HSV space, this description is represented by the vector pink= h0.0, 0.3, 1.0i,
with:
– pink.Hue = 0.0: hue is defined, on the chromatic circle, as an angle in [0, 2π] where 0
means red;
– pink.Saturation = 0.3: the saturation scale ranges from 0 to 1;
– pink.V alue = 1.0: the value is defined on [0, 1].
This model suffers one drawbacks when it comes to images retrieval: the hue property is not linearly perceptual. It means that zone colours such as red or blue represent a large part of the spectrum while yellow or green are represented by a very small portion. The consequence is that if the application does not take this into account, colours like red or blue are over-represented.
34 CHAPTER 2 — Content-Based Image Retrieval (CBIR)
Figure 2.2 – The Hue-Saturation-Value colour model
Figure 2.2 shows a representation of the HSV colour model. It has been represented as a cone where the radius represents the hue; it also shows a slice of this cone for a hue corresponding to a green value.
2.3.1.3 Medium Level Data
Information extracted until now are mainly about the image in its whole. Still, the most relevant information after colour is the spatial disposition of main colours. This is a part of the pre-vision process, that is not conscious. Indeed, these colours generally correspond to real world objects. Without pretending this precision level, an image may be separated into interes-ting parts, with a minimum of hypothesis.
In order to provide more precise informations on spatial arrangement of the pixels of an image, we can first make minimal hypothesis on their composition. Then, we can consider that in the most of the cases the main object is close to the centre of the image [19]. Anyway, eye is attracted to the centre [28]. We can expect this property for images build in respect of the usual photograph rules by segmenting the images along the strength lines (segmenting into thirds, horizontally and vertically) [75]. To improve spatial informations relevance, a recursive segmentation of the image (quad-trees10 [65] [33]) may be performed until reaching a depth or homogeneity level fixed before-hand. Finally, more advanced techniques allow to express and exploit spatial concentration of colours: auto-correlograms [29], retro-projection [8], Ragon transformation [82], Delaunay triangulation [79], etc. To go further, one must use image analysis techniques. The main processes are segmentation and border extraction [3].
Segmentation techniques, very numerous, are used to extract regions of an image featuring a certain homogeneity, regarding a given criteria. Usual criteria are colour or greyscale ho-mogeneity (cognitive studies also showed that the human eye is particularly sensible to large homogeneous colour zones [28] [5]) and texture homogeneity. Manual or semi-automated
ver-CHAPTER 2 — Content-Based Image Retrieval (CBIR) 35
sions (flooding filling from a point chose by user, active border [19]) provide significant regions, possibly annotated with semantic informations, but at a high cost.
Every histogram process can be extended to regions. However, using regions one can take profit of new characteristics to improve the search results.
To each r region, one can associate additional characteristics related to shape and spatial
arrangement:
– surface (sr), perimeter (pr) and orientation (θr);
– absolute position: barycentre (Cx(r) = µ(h(r)) and Cy(r) = µ(h(r))), minimal
borde-ring rectangle (xr,yr,lr,hrconsidering or notθr);
– relative position: Euclidean distance to the centre of image (Cc(r) = L2((h2,2l), (Cx(r), Cy(r))));
– shape: stretching, eccentricity or elongation (lr
hr), rectangularity (such as
sr
lr×hr),
circula-rity or compacity (4πsr
pr2 , Fourier transform approximations [7], moments [31] or angles
and tangent vectors [19]).
Moreover, binary (or even n-ary) characteristics may be associated between regions: – comparisons on different properties;
– spatial relations: with (1) Allen relations [2] (before, meets, overlaps, starts, during,
fi-nishes and equals), (2) parametric coordinates(ρ, theta) [81], or (3) relation graphs
bet-ween objects of the same image, and even simple bi-dimensional adjacency histograms on their respective colour [24].
2.3.1.4 High-Level Data
High-level data are considered by some authors as being the most useful to perform relevant retrieval in an image database [9]. The principles of high-level data indexing consists in provi-ding semantic descriptions of the scene and real world objects that can be found in this scene. Unfortunately, semantic usually has to be provided manually because it requires a comprehen-sion of the scene, except in particular case described in previous part.
The keyword-based approach [8] is the most generic alternative to describe objectively as well as subjectively, intrinsically as well as extrinsically an image content:
CM : I → 2A
∗
(2.4) Other models can hardly be compared. However, one may distinguish informations about (1) image regions and perceptual informations associated, (2) real world objects and semantic informations associated, and finally (3) establish a correlation between (1) and (2).
EMIR2 [43] introduces an oriented structured graph describing composite structure of ob-jects (a house being a compound of a roof and walls. . . ). Spatial informations are located on nodes (points, segments, polygons. . . ) and arcs (metrics: close, far, vectorial: north, south, east, west; and topological: cross, overlap, disjoint, in, touch) of a description graph of the two-dimensional scene. Finally, a symbolic description separates formatted attributes (author, size. . . ) from generic concepts. Note that this higher level proposition does not recognise ob-jects in the image; only conceptual obob-jects are described. Thus, there is no effective correlation.
36 CHAPTER 2 — Content-Based Image Retrieval (CBIR)
It is also targeted to applications where semantic has an important role.EMIR2 also includes
relevance notions and uncertainness.
On the other hand, [44] uses a simple segmentation where each region is associated to a colour attribute. Regarding semantic description, an object-oriented approach is used (class, inheritance and aggregation). A link between two levels is established by a function associating a semantic object to one or several regions. Then, a query language is provided on this data structure.
CORE [84] goes further by providing several interpretations (concepts compounds) for the same property (measure compounds) of an image. An interesting application is the STAR sys-tem providing retrieval on company logos. These logos do not necessarily represent a real world object, but they do have a symbolic interpretation.
These few propositions are enough to show how approaches may differ in details, even if there are similarities at a high abstraction level.
In the case of IDB, we propose to use directly the application schema to obtain semantic informations, more generic. IfS =< C, A > is a very simplified database schema, where C is
a set of classes andA a set of binary associations A ⊆ C × C between these classes, then one
can define theCS property associating to each instance the set of classes to which it is linked:
CS : I → 2 C
i 7→ {c′ ∈ C|i ∈ c ∧ i′ ∈ c′ ∧ (c, c′) ∈ A ∧ (i, i′) ∈ (c, c′)} (2.5)
One can, for instance, find the set of images that could represent urban landscapes by calcu-lating{i ∈ I|City ∈ CS(i)}.
2.3.2
Similarity measures
“To be intelligent is to find similarities” [14]. At one end, the first mathematical transfor-mations are geometrical transfortransfor-mations, but they are too strict for our purpose. At the other end, topological similarities are too loose since a cup and a ring would be similar. To deal with similarities, one must define such a concept from gradual measures.
A similarity measure is usually define from a distance:
d : C × C → R (2.6)
respecting three axioms:
– auto-similarity:∀x ∈ C, d(x, x) = C (C being a constant);
– symmetry:∀(x, y) ∈ C2, d(x, y) = d(y, x);
– triangular inequality:∀(x, y, z) ∈ C3, d(x, y) + d(y, z) ≥ d(x, z)
Distances are numerous in the literature, defined by scalar values, set values, vectorial va-lues, etc.
Unfortunately, several experiences showed that human perception is not comparable to a distance. Usually, it respects neither symmetry, nor even auto-similarity [66].
The general method should be as follows: whenever we want to express a perceptual simi-larity in a metric space, we have to define a it as a non-trivial, monotonic, and non decreasing functionf , on an underlying appropriate distance:
CHAPTER 2 — Content-Based Image Retrieval (CBIR) 37
s : C × C → [0, 1]
(c, c′) 7→ f (d(c, c′)) (2.7)
2.3.2.1 Combination of measures
Another difficulty is how to combine several measures, often defined on different domains and sometimes with various weights. However, every experimental result shows that considering several characteristics at the same time gives better results than with a unique property [58] [49]. Considering several characteristics in the same time may be done at the time where characte-ristics are collected. [54] builds multi-dimensional histograms combining orthogonally several characteristics defined around a pixel (for example colour and intensity gradient). [73] operates a segmentation of images simultaneously in the colour domain and texture domain, in this way Savannah may be distinguished from lion’s hair by using texture information.
In a general case, independently established measures will need to be combined. There are at least four difficulties:
– different values domains; – there are qualitative data;
– data may not be independent from each others;
– the relative importance of properties is neither equal nor constant.
Literature presents several combinations methods, with their own merits and drawbacks. We classify them into four families:
– based on vote,
– measures in a vectorial space, – probabilistic approach, – and fuzzy logic.
Combination based on vote Several measures may be easily combined by voting techniques
[70]. Its simplicity is attractive. Images are classified independently on different characteristics. Combination is done from the average rank, or median rank. Best and worst may be eliminated to gain robustness.
Using this technique, one can combine characteristics defined on different domains. Impor-tance of characteristics may be weighted.
Aggregation in a vectorial space Techniques based on measures in a vectorial space are the
most common ones. Characteristics have to be quantifiable. Then, each characteristic is an axis in a multi-dimensional space, and a vector of characteristics is a point in this space.
This approach can be applied as well to a multi-valuated criteria (such as histogram) that one wants to reduce as to several independent measures. In the general case, it becomes a tree of properties. It can even become recursive if the images are organised into compound objects. When data can be assimilated to vectors, which is often the case for histograms, Minkowsky distances are often used:
38 CHAPTER 2 — Content-Based Image Retrieval (CBIR) Lp : CN × CN → R (v, v′) 7→ (P ∀j(vj − v′j)n) 1 n (2.8)
Wherep ≥ 1. Most common distances are particular cases of Minkowsky distances: L1 is
the Manhattan distance,L2 the Euclidean distance, andL∞ = max{|xi− yi|}.
An important problem is orthonormality of the vectorial space. Considering for example a greyscale histogram, it is obvious that entry that are close from each others are almost equi-valents. [76] shows histograms that are similar for human eye but can be made completely different by a simple translation.
The quadratic distance, supposedly found by Mikihiro Ioka from IBM laboratories in Tokyo, seems to solve that problem:
dQA : C N × CN → [0, 1] (v, v′) 7→Pn j=1 Pn k=1ajkd(vj, v′j).d(vk, v′k) (2.9) It provides a correlation between axis as a symmetric matrix (in order to respect distance axioms), its diagonal terms being 1 (each entry being similar to itself). [27] and [73] use a matrix such asai,j = (1 −
di,j
dmax) where d is the euclidean distance in the corresponding colour
space anddmaxthe normalisation factor.
Note thatL2 is a particular case where the correlation matrix is identity. Another particular
case is a binary matrix, equivalent to creating equivalence classes.
The only drawback of quadratic distance is the linear time complexity (O(n)), but
depen-dencies between characteristics inside a given characteristic are common.
When independence of components is established, simpler measures fulfil. VisualSEEK [73] uses a simple sum between spatial distance (being itself a simple sum) and the colour distance (an adapted quadratic distance). [9] also proposes a sum of absolute distances between average and standard deviation, respectively on four forth and three channels of image.
Vectorial approach makes easy to take weight into account. As for histograms, it becomes especially useful when inertia moments are exploited. Indeed, average is more important than standard deviation, itself more important than next inertia moments. For example, two images with a different average colour are unlikely to be similar unless all other moments are close, which can be actually a translation of the colour spectrum.
A sum of quadratic differences, weighted by the inverse of corresponding variance, is used for texture (granularity, contrast and directionality) and the form in QBIC [16]. Note that it is possible to take into account weights that are internal to modalities in an histogram in order to compare only a subset of modalities (implicitly the case in simple interfaces where only a few dominant colours are specified).
Probabilistic aggregation Using probabilistic theory is an attractive idea [53] [12] [53] [49].
It allows to represent dissimilarities since dissimilarities are linked to the values appearance frequency, naturally presenting the shape of a function on a distance. [49] makes a trivial Gaus-sian hypothesis to reduce the distance on a characteristic C to a quasi-probability (statically


![Figure 3.2 – A Modigliani’s Painting with Similar Images [69]](https://thumb-eu.123doks.com/thumbv2/123doknet/7771838.257056/44.918.132.809.109.559/figure-modigliani-s-painting-similar-images.webp)