HAL Id: hal-01007382
https://hal.archives-ouvertes.fr/hal-01007382
Submitted on 24 Mar 2021
Thermal stresses in hexagonal materials-heat treatment
influence on their mechanical behaviour
David Gloaguen, Sylvain Fréour, Manuel Francois, Ronald Guillen, Jean Royer
To cite this version:
David Gloaguen, Sylvain Fréour, Manuel Francois, Ronald Guillen, Jean Royer. Thermal stresses in
hexagonal materials-heat treatment influence on their mechanical behaviour. Journal de Physique IV
Proceedings, EDP Sciences, 2004, 120, pp.185-190. �10.1051/jp4:2004120021�. �hal-01007382�
Thermal stresses in hexagonal materials –heat treatment
influence on their mechanical behaviour
D. Gloaguen
1, S. Freour
1, M. François
2, R. Guillen
1and J. Royer
11
GeM, Institut de Recherche en Génie Civil et Mécanique, Université de Nantes, École Centrale de Nantes, UMR CNRS 6183, Boulevard de l’Université, BP. 406,
44602 Saint-Nazaire
e-mail: gloaguen@lamm.univ-nantes.fr
2
Laboratoire des Systèmes Mécaniques et d’Ingénierie Simultanée (LASMIS), Université de Technologie de Troyes, 11 rue Marie Curie, BP. 2060, 10010 Troyes, France
Abstract. Internal stresses due to anisotropic thermal and plastic properties were investigated in rolled
zirconium and titanium. The thermal stresses induced by a cooling process were predicted using a self-consistent model and compared with experimental results obtained by X-ray diffraction. The study of the elastoplastic response during uniaxial loading was performed along the rolling and the transverse direction of the sheet, considering the influence of the texture and the thermal stresses on the mechanical behaviour. An approach in order to determine the thermal behaviour of phases embedded in two-phase materials is also presented.
1. INTRODUCTION
Hexagonal close packed materials present anisotropic thermal, elastic and plastic properties at mesoscopic and macroscopic levels. These properties and the crystallographic texture explain the appearance and the development of internal stresses when a thermo-mechanical deformation is introduced during the manufacturing of the material. Two types of internal stresses can be distinguished:
Thermal internal stresses, which may arise from thermal anisotropy. As single crystal thermal
expansion coefficients are different in the direction of the
c
r
axis and in the basal plane, intergranular thermal stresses are induced during the cooling process after a heat treatment because a full accommodation of the anisotropic thermal contraction of each grain is prevented by the neighboring grains. These stresses can modify the elastoplastic response of the polycrystalline material [1].Mechanical internal stresses, induced by the elastoplastic anisotropy and the requirement of
compatibility [2].
In this article, we present a systematic simulation of the thermal and mechanical response of rolled zirconium and titanium sheets, using the self-consistent elastoplastic formulation proposed by Hill [3]. We model the cooling process and the tensile elastoplastic response of samples, and calculate the evolution of internal stresses associated with these processes. We quantify precisely the level and the influence of the thermal stresses on the macroscopic behaviour. We combine experimental observations (X-ray diffraction, tensile tests) with the predictions of a self-consistent model in order to obtain more informations about the different factors responsible for the appearance of residual elastic mesostrains. This comparison allows a better understanding and interpretation of X-ray diffraction and mechanical results. X-ray diffraction technique is one of the most used to characterise the mechanical state at mesoscopic level of polycrystalline materials. It is performed from the elastic strains measurement and the subsequent calculation of the stress state by means of mechanics equations. The
capacity to measure intergranular strains provides an experimental tool for understanding how intergranular strains are generated. Experimental data from X-ray diffraction offer a rigorous test at a microscopic level for the models [4-5].
In a second part, we present an approach developed in order to predict the internal stresses and strains due to thermal solicitations in multiphase metallic polycrystals. The procedure is based on the coupling of numerical simulations with scale transition models and experiments. The effects due to thermal interactions occurring in two-phases materials are analyse.
2. SELF-CONSISTENT SCHEME
The elasto-plastic self-consistent model predicts intergranular effects by accounting for the mechanical and thermal anisotropy and the texture of the polycristal. Thermal effects are accounted for here. We assume that thermal contractions do not introduce plastic deformation in the material during the cooling process [6]. In this case, a thermoelastic formulation is sufficient to simulate the evolution of thermal stresses associated with cooling. The isothermal uniaxial loading is an elastoplastic problem where thermal effects enter through the residual stresses left in the material by the previous cooling process.
Polycristal models [7] treat each grain as an inclusion embedded in a Homogeneous Effective Medium (HEM) exhibiting the same overall response of the aggregate. Each grain is treated as an inhomogeneity with elastic (c) and thermal (a) constants, slip and twin mechanisms characteristic of a single crystal. The texture is known, the polycristal is represented by a weighted discrete distribution of orientations The stress and strain rates,
σ
&
andε
&
, of each grain are linearly linked by an elastoplastic tensor l. This tensor accounts for anisotropy of the grains and the hardening effects of the deformation systems during plasticity. The number and type of active systems are defined through their critical resolved shear stress and some hardening behaviour. The volume averages of the local stress and strain tensors must coincide with the overall strain and stress, E and S. Using the Eshelby’s inclusion formalism [8], theσ
&
andε
&
of each grain are coupled toΣ&
andE
&
through an interaction tensor L*. It is a function of the Eshelby tensor, the elastoplastic tensor of the polycristal L, and the shape and the orientation of the inclusion. L linked linearlyΣ&
andE
&
.Since the properties of the medium derive from the average response of all grains, it is initially undetermined and must be solved by iteration. By specifying an overall stress or strain, the model can give the corresponding stress or strain tensors for each orientation. Thus, we can describe the mechanical response of the polycrystal at mesoscopic scale.
2.1 Data used in the simulations
For the cooling simulation, we supposed the sample is stress-free at 923 K [2]. The texture was introduced in the model by a set of 1000 grains characterized by Euler angles and weights which represent their volume fraction. The single crystal elastic constants and the thermal expansion coefficients used in the model are listed in [9]. We are taking account the temperature dependence of these coefficients.
For the tensile loading, the temperature is kept constant, the initial internal stresses are the ones left by the cooling process. The main active slip systems are assumed to be : the 6 prismatics
{ }
1010 1120 systems, the 24 pyramidal{ }
10
1
1
11
2
3
systems and{ }
10
1
2
twinning. We considered a linear hardening law [4], the coefficient Hgr is equal to Hgg for any deformation modes r :å = r r γ g H g τ &
& , the CRSS for the prismatic systems is determined to reproduce the experimental yield
stress in the rolling direction (RD). The CRSS and hardening coefficients values are adjusted to give a good description of the tensile test performed in the RD of the sheet. The same parameters are taken for the simulation of the tensile test in the transverse direction (TD) and X-ray diffraction results.
2.2 Stress measurements by X-ray diffraction technique
These experiments were carried out on a D500 SIEMENS goniometer with a Cr Ka (Zr702) and Cu Ka radiations (Ti40). An W goniometric assembly with a scintillation detector was used. Two plane
families were studied : {
10
1
4
} at 2q = 156.7° and {20
2
2
} at 2q = 137.2° for zirconium. {21
3
3
} at 2q = 139.731° and {30
3
2
} at 2q = 148.751° for titanium. Diffractograms were recorded for fifteen tilt angles y varying between – 45 and 45° and for azimuth angles f = 0, 45 and 90°. The direction f = 0° corresponds to the tensile direction.3. RESULTS AND DISCUSSION 3.1 Thermal stresses
The thermal strains due to a temperature variation from 923 to 298 K are calculated. Predicted results are compared with experimental data using X-ray diffraction method.
Using the self-consistent formulation, thermal residual strains projected on the measurement direction versus sin2y for the diffracting planes were simulated. These strains can be represented by a straight line A + B sin2y. Predicted results were compared with experimental data using X-ray diffraction technique. The experimental strain value are determined by :
(
φψ 0)
0 φψ2
2θ
2θ
cotan
θ
1
ε
=
-
-
(1) where 0q
is the Bragg angle for a stress-free specimen of the studied a phase andfy
q
is the measured Bragg angle. Consequently, it is necessary to determine the stress-free lattice parameters of the sample to calculate the thermal strains. These parameters cannot be measured using polycrystalline sample, because they are distorted by intergranular strains induced by the anisotropic thermal behaviour of the grains. Then, one solution [6] is to find the stress-free parameters a0 and c0chosen, such that the difference between predicted and experimental strains values were minimized. The values obtained for the best fit are :
Zr : a = 3.2365 Å and c = 5.1498 Å or 2
q
Zr0{ }
10
1
4
= 156.240° and 2q
Zr0{ }
20
2
2
= 136.896°.Ti : a = 2.9521 Å and c = 4.6893 Å giving 2
q
Ti0{ }
21
3
3
= 139.162° and 2q
Ti0{ }
30
3
2
= 148.194°.The self-consistent formulation was used in order to determine the stress free lattice parameters. It should be noted that this determination was performed using the model in the reverse way. In this case, single crystal properties are determined by the comparison with experimental measurements done on aggregates which are the only possible source of data.
Figure 1 shows the experimental (solid circles and triangles) and predicted (full line) thermal strain versus sin2y curves for
{ }
1014 ,{ }
20
2
2
(zirconium) and{ }
2133 (titanium) diffracting planes with f = 0°. We obtained a good agreement between the two approaches.To give an idea of the stress magnitude, the diagonal components
22
s and
33
s of the stress tensor can be calculated for every grain. These values are expressed in crystal axis (with x3
®
// to ®c axis) and
correspond to values obtained after cooling at room temperature. In zirconium, 30% of the grains have component
22
s higher than 80 MPa and component
s
33 lower than –50 MPa. In titanium the values are much lower : the22
s values are always less than 6 MPa and the s33 values are lower (in modulus) than – 7 MPa. It is evident that, in the case of zirconium, these levels of stresses influence the appearance of microplasticity in grains, introducing an important effect on the elasto-plastic transition in zirconium alloys [2].
a) b)
Figure 1. Intergranular deformations as a function of sin2y at room temperature with f = 0° for
a) - zirconium - · {
10
1
4
} and ▲ {20
2
2
} diffracting plane – experimental result. ─ predicted results. b) - titanium - ▲ {30
3
2
} diffracting plane – experimental result. ─ predicted results.3.2 Mechanical stresses
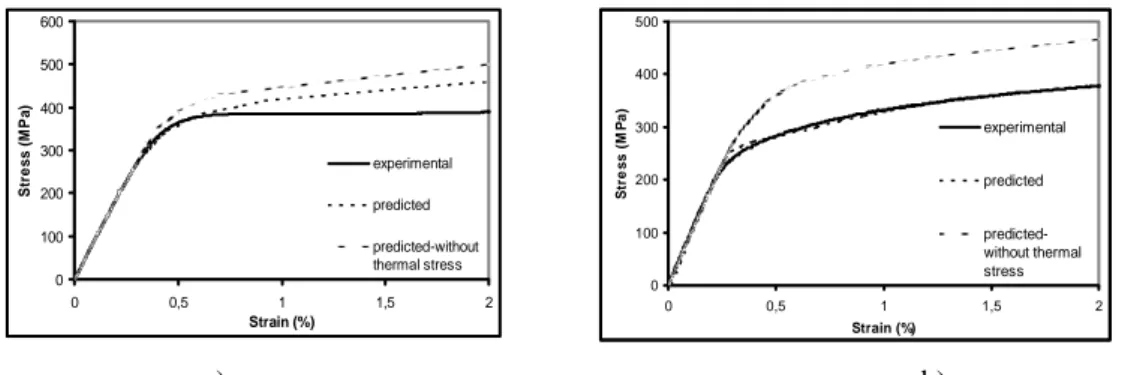
The mechanical response in the elastoplastic region is calculated using the elastoplastic self-consistent formulation presented above and the initial residual stresses left by the previous cooling process. Uniaxial tensile test up to 2 % strain along the RD and the TD are simulated. The results indicate that the elastoplastic response is strongly influenced by the residual stresses and by the texture of the material. The experimental and predicted tests for zirconium and titanium are depicted in figures 2 and 3, respectively.
The experimental tests for zirconium show several differences between the two directions : the yield stress is higher, the elastoplastic transition is faster and the curve shows a plateau at 0.6%strain in the transverse direction. The measured yield stresses are 205 MPa and 290 MPa (stress differential of 85 MPa) in the RD an TD respectively. The corresponding Young’s modulus are 93 GPa and 96 GPa. These values are similar because of the low elastic anisotropy. With the model developed here, the predicted Young’s modulus are 93 GPa and 95 GPa in agreement with the experimental ones. The stress differential can be attributed to thermal residual stresses. This fact has been already analysed by Mac Ewen et al [10] on Zircaloy-2. The predicted yield stresses are 205 MPa and 275 MPa in the RD an TD respectively. When no thermal stresses are assumed, the model predicts a low stress differential (<15 MPa) which could be attributed to texture. The model fails to reproduce the plateau in the TD because the stress relaxation (due to twinning for example) is not accounted for. Nevertheless, the simulated data exhibit the correct tendency.
For titanium, the predicted yield stress is about 251 MPa (0.23 % total strain) along the RD. This value is very close to the experimental one (253 MPa). The calculated Young’s modulus (107 GPa) coincides with the experimental one. With a loading along the TD, the initiation of the elastoplastic transition begins at 271 MPa (0.27 % strain). The experimental yield stress is about 293 MPa. Although the predicted yield stress is lower than experimental one, the simulation matches the fact that the yield stress in TD is higher than in RD. To quantify the influence of thermal stresses on the macroscopic response, calculations were also performed without thermal stress in the initial conditions. The predicted stress-strain curves are identical to the previous case. The elastoplastic transition begins at 256 MPa (251 MPa with thermal stresses) in the RD anisotropy is very low and its influence on the macroscopic behaviour, contrary to zirconium, is negligible.
In the simulations, we have considered that prismatic glide is the main active mechanism, pyramidal slip is a secondary slip mode and twinning contributes very little to plastic deformation. Distribution was obtained in agreement with the published experimental observations.
-0,0015 -0,001 -0,0005 0 0,0005 0,001 0,0015 0 0,1 0,2 0,3 0,4 0,5 0,6 Sin2y ejy f = 0° -0,0015 -0,001 -0,0005 0 0,0005 0,001 0,0015 0 0,1 0,2 0,3 0,4 0,5 0,6 Sin2y f = 0° ejy
a) b)
Figure 2. Predicted and measured stress-strain curves for uniaxial loading along the TD (a) and the RD (b) of the
zirconium sheet.
a) b)
Figure 3. Predicted and measured stress-strain curves for uniaxial loading along the TD (a) and the RD (b) of the
titanium sheet.
4. THERMAL STRESSES IN TWO-PHASE MATERIALS
Let us consider a hypothetical two-phase system composed of one phase having the same properties than a-Zr, while the second one will be assume to behave as a-Ti. This material can be only designed in theory because titanium and zirconium are, in practice, miscible in any proportion. Nevertheless, this material has been supposed for the need of the simulation, due to the lack of data concerning the evolution with the temperature of the CTE and elastic properties of real hexagonal two-phase structures. The model used for our simulations was presented in a previous paper [11].
The behaviour has been simulated when the material is subjected to a cooling process from 998 K to 298 K. Five compositions (volume fractions) of the polycrystal have been considered : fZr = {0 ; 0.25 ; 0.5 ; 0.75 ; 1}. In each case, the homogenisation procedure has been performed on 4000 crystallites per phase. A spherical shape has been chosen for the inclusions. The volume fraction of each crystallite was adjusted in order to satisfy the assumption on the volume fraction of the phase in the material. The texture is isotropic in each phase, so that the relative weight of the grains are the same in a given phase. Notice that the case when the volume fraction of a phase tends towards zero corresponds to the limit case of the inclusion embedded in an infinite matrix developed in Eshelby’s model [24]. The measurement direction chosen in the point of view of the diffraction is defined by f=0° and y=0°.
The results obtained for the planes
{ }
21
1
3
and{ }
30
2
2
of a-Ti are given on figure 4. In each case, f denotes the volume fraction of the diffracting phase.0 100 200 300 400 500 600 0 0,5 1 1,5 2 Strain (%) St re s s ( M P a ) experimental predicted predicted-without thermal stress 0 100 200 300 400 500 0 0,5 1 1,5 2 Strain (%) St re s s ( M P a ) experimental predicted predicted-without thermal stress 0 100 200 300 400 500 0 0,5 1 1,5 2 Strain (% ) S tr ess ( M P a) experimental predicted 0 100 200 300 400 0 0,5 1 1,5 2 Strain (%) St re s s ( M Pa ) experimental predicted
{21.3} plane - a-Ti in Zr-Ti -0,0005 0 0,0005 0,001 0 200 400 600 800 1000 Temperature [K] ejy f = 0,00 f = 0,25 f = 0,50 f = 0,75 f = 1,00
Figure 4. predicted thermal induced residual strains on the diffracting volume of a-Ti embedded in a
hypothetical Zr-Ti matrix, as a function of the temperature and phase volume fraction.
The amount of residual stresses generally increases with a decrease in the volume fraction of the considered phase. In a-Ti, the axial stress component simulated for the plane
{ }
3022 vary from 0 MPa (Ti single phase) up to 286 MPa, (one inclusion of titanium in a zirconium matrix). Thus, in specific conditions, the induced residual thermal stresses may reach values very close to the yield limit of a phase. The residual strains computed owing to SC model increase in a-Ti as a function of the volume fraction of a-Zr. Conversely, in the same conditions, the strains decrease in a-Zr. These results show clearly the influence of the second phase on the residual stresses values in the studied phase.5. CONCLUSION
In this study, X-Ray Diffraction and self-consistent modeling have been used to measure and simulate the thermal residual strains induced in either single-phase or two-phase polycrystalline materials. Comparisons of these two approaches performed on commercially pure a-Ti and a-Zr textured samples show a good agreement. The efficiency of SC estimates was also demonstrated. In particular, the model properly reproduces the behaviour of the diffracting volume of strongly thermal anisotropic materials as Zr.
For zirconium, the residual stresses due to thermal anisotropy are rather important (equivalent to 35% of the yield stress) and consequently they play an important role on the elastoplastic transition, contrary to titanium. We showed that the crystallographic texture and the thermal residual stresses can explain the stress differential between RD and TD of the sample the elastoplastic transition after an uniaxial loading. The study of two-phase material show the influence and the interaction of the second phase on the thermal behaviour in the studied phase.
References
[1] S.R. Mac Ewen, N. Christodoulou, A. Salinas-Rodriguez, Metall. Trans., 21A (1990), 1083- 1095.
[2] P.A Turner, N. Christodoulou , C.N. Tomé, Int. Journal of Plasticity, 11 (1995), 251-265. [3] Hill R., J. Mech. Phys. Solids, 13 (1965), 89-101.
[4] J.W.L. Pang, T.M. Holden, P.A. Turner, T.E. Masson, Acta Mater., 47 (1999), 373-383. [5] M.R. Daymond, H.G. Priesmeyer, Acta Mater., 50 (2002),1613-1626.
[6] M. Ortiz, A.A. Pochettino, Journal of Nucl. Mat., 229 (1996), 65-72.
[7] D. Gloaguen, M.François, R. Guillen, J. Royer, Acta Mater., 50 (2002),871-880. [8] J.D. Eshelby, Proc. R. Soc., A. 241 (1957), 376-396.
[9] M. Ortiz, A.A. Pochettino, Fourth European Conference on Residual Stresses (Ed. Par S. Denis et al, 1996), 971-976.
[10] S.R. Mac Ewen, C. Tomé, J. Faber , Acta Mater., 37 (1989), 979-989.
[11] S. Freour, D. Gloaguen, M. François, R. Guillen, Physica Status Solidi (a), 201,1 (2004), 59-71.
{30.2} plane - Ti in Zr-Ti -0,0005 0 0,0005 0,001 0 200 400 600 800 1000 Temperature [K] e f = 0,00 f = 0,25 f = 0,50 f = 0,75 f = 1,00