ISMRE2018/XXXX-2018 ALGERIA
Optimized parameters of an air solar collector for
drying applications using the experimental design
method (DOE)
Benhamza Abderrahmane1,2 , Boubekri Abdelghani 2 , Atia Abdelmalek 1,2 Halimi Soufiane 2, Mouissi Fares
Madjdi 2, Djamel Mennouche 2
1 Department of Mechanical Engineering, faculty of technology, university of echahid hamma lakhdar -eloued- algeria 2 Laboratory of development of new and renewable energies in arid zones (LENREZA), Ouargla 30000, Algeria
………
Abstract— The present study is an optimization of flat plate solar air collector (ASC) in order to improve its thermal performance. A repeated numerical simulation with two software packages TRNSYS and STATGRPHICS has been performed, where TRNSYS software have been used to predict thermal efficiency of different configurations of ASCs and design of experiments method (DOE) have been used to obtain optimum levels of factors affecting the efficiency system. DOE is also used for modeling the outlet temperature of ASC in order to obtain optimal efficiency of the collector. The best conditions founded for optimum outlet temperature and efficiency are as: 2.14 m2 in area, absorber type is stainless steel, glass type is normal glass and air flow is 35 kg / h, where this last factor is the most influential factor on the temperature. Performance of the system was tested and compared with experimental data, and the test results show that the outlet temperature of the new ASC simulated using the optimal conditions, is better with 17 degree compared with ASC before optimization, and the outlet temperature in the winter reaches 41.86 °C when the collector efficiency is 25%, while in the summer it reaches 75°C with efficiency of 16%.
Keywords—Solar air collector, Design of experiments, DOE, optimization, indirect solar dryer.
I. INTRODUCTION
Developments in solar thermal technology have made these systems more reliable and more efficient and, therefore, a more practical choice for prospective adopters.
Solar thermal systems are a way to satisfy heating needs by capturing the thermal energy of the sun for heating applications such as buildings, hot water or swimming pools Tremendous amounts of energy currently go in to traditional heating applications that could be satisfied by solar thermal power. In domestic situations, for example, heating water accounts for approximately one-third of total energy use. Using solar energy for domestic hot water could save significant amounts of energy annually, meaning lower bills for homeowners and fewer emissions from traditional hydrocarbon-based grid power. Solar air heater is one such method to convert solar energy to thermal energy it also has many advantages compared to liquid heaters because of avoiding the problems of freezing or stagnation, leaks, damage and environmental or health hazard risk from the heat transfer medium. Moreover, they reduce costs of energy consumption for the application involved. [1]
There is lots of articles already published in the area of solar air heaters, the following paragraphs will be a little review aims to merge the efforts of the researchers working on ASC. This review will be focusing on simulation studies.
Bennamoun studied the use of solar batch dryer, integrated with a flat plate ASC for drying agricultural products to be used during unfavorable climatic conditions which in-role permits the system operating all the year and no storage Medias would be needed. From the solar batch dryer components depicted in Fig. 1, it can be noticed that it is more advantageous for low spaces, cleaning and maintenance. The dryer consists of 0.04 m thickness of polystyrene plate used as an insulator and a brick wall, 0.1 m thick, supporting 10 trays (0.1 m in-between distance). A fan is used to cause a good distribution of the air inside the chamber. Using a solar batch dryer with 3 m2 collector surface and a heater at 50 °C allows drying of about 250 kg per day.[2]
Figure 1: (a) A solar batch dryer, (b) the collector [2] Alkilani et al. studied an ASC integrated with PCM to predict the output air temperature resulted from the discharge process. The study was made for eight different values of mass flow 0.05–0.19 kg/s. Fig.2 shows the system set-up. As shown, the system had single glass cover and PCM unit divided into cylinders which acted as an absorber. Cross flow of air through the cylinder was the study flow regime. The PCM consisted of paraffin wax with mass fraction 0.5% aluminum powder. The study was indoor one. The
simulation supposed that the PCM initially at liquid phase (50 °C) heated by solar simulator while the pumped air over the cylinders at room temperature (28 °C). The freezing time, the important factor, was studied at each mass flow rate. The freezing time had an inverse relation to the flow rate and the longest time (approx. 8 h.) was found at a flow rate of 0.05 kg/s.[1]
Figure 2: (a) A ASC with PCM cylinders [1] In order to achieve a high-performance envelope of the building, an optimization of major parameters building envelope has been required, using design of experiments (DOE), can determine the most effective parameters and eliminate the less importance. The study building is often complex and time consuming due to the large number of parameters to consider. This study focuses on reducing the computing time and determines the major parameters of building energy consumption, such as area of building, factor shape, orientation, ration walls to windows …etc to make some proposal models in order to minimize the seasonal energy consumption due to air conditioning needs.[3]
Thatchi et al. explored the effect of ring baffle configuration parameters on the system mixing using computational fluid dynamics simulation to predict the hydrodynamic phenomena. Factorial experimental design analysis has been also used for statistical interpretation of the relationship between the ring baffle configuration and the hydrodynamic phenomena. [4]
Wanwisa et al. studied the heat transfer behavior between convection and conduction in the thick wall crude oil pipeline with laminar unsteady state flow using integration of developed computational fluid dynamics model and statistical experimental design. It was founded that a good agreement between the model and literature experimental data suggests that the proposed numerical scheme is suitable for simulating the transport profile in pipeline and predicting the phenomena for any other conditions [5]
In this paper the results of simulation of an ASC in order to improve its thermal performance using TRNSYS software and statistical experimental design.
an optimization of major parameters of ASC is required, using design of experiments (DOE), which can determine the most effective parameters and eliminate the less importance.
II. MATHERIAL AND METHODS A. Design of experiments (DOE)
DOE is a homogeneous set of tools and algebra-statistical methods aimed at establishing and analyzing the
relationships between the objectives studied (responses) and their supposed sources of variations (factors).
And for citing objectives of DOE the following questions need to be answered: Which factors have a real influence on the responses (results)? Which factors have significant interactions (synergies or antagonism)? What are the best settings of the factors to achieve optimal conditions for best performance of a process, a system or a product? What are the predicted values of the responses (results) for given settings of the factors? An experimental design can be set up to answer all of these questions.[6]
1) Factors
Inputs to the process in such experiments, two types of factors are varied: Controllable factors are factors that can be controlled and whose effects are of primary interest. Noise factors are factors that cannot normally be controlled and whose effect on the response needs to be minimized [4]. The controllable variables will be referred to throughout the material as factors. generally, Noise Factor an uncontrollable factor that causes variability under normal operating conditions, but we can control it during the experiment using blocking and randomization.
2) Response (output of the experiment)
They are measurable outcomes potentially influenced by the factors and their respective levels. Experimenters often desire to avoid optimizing the process for one response at the expense of another. For this reason, important outcomes are measured and analyzed to determine the factors and their settings that will provide the best overall outcome for the critical-to-quality characteristics - both measurable variables and assessable attributes[6].
B. TRNSYS software
Because of losing costs and time in experiments. The numerical simulation is an effective way to reduce the basic challenge of time and cost. With programs we can make many experiments in a short time and with less coasts. Without loss of material, with saving quality of results, so can do same experiments. Many researchers have been addressing the tests to avoid problems and obstacles. TRNSYS software has been chosen for the simulation for the various advantages it presents.
1) Type 73
This type is one of types exist on TRNSYS library which can simulate ASCs, and it was chosen because it contains the most parameters studied in our case with possibility to change the value of each parameter. The ASC parameters are shown in table (1). The value of fin efficiency factor at 0.25 was considered as default. And the index of the glass is 1.526, and for plexiglass is 1.49. Where the Extinction coefficient and the product thickness are calculated the with the following equation:
𝐾𝐿 = 𝐾 × 𝐿 ()
KL: Product of extinction coefficient and thickness for cover
K: the glazing extinction coefficient, which its general value is 32.
L: the glazing thickness. Table Type Styles
Table I. Type 73 Parameters list.
III. METHODOLOGY
A. SIMULATION VALIDATION
In order to improve performances of ASC we used as inputs, the meteorological data of Ouargla city and geometrical parameters of an ASC existed in LENREZA (Laboratory of New and renewable energies development in the arid and saharian zones) laboratory fig.3. This first step has been performed in order to validate the mathematical model of simulation.
ASC consist mainly of air flow duct and absorber plate. To reduce heat losses from both bottom and sidewalls, thermal insulation with low thermal conductivity is used. The upper side of the heater is covered with a glass cover with high transmissivity and low absorptivity.
The geometrical parameters of the simulated ASC are the following: 2.2080 m2 of surface, 1.92 m length and 0.45 m width and 0.17m of height. 0.07 m is the thickness of air canal. absorber. Insolation thickness is 0.07 m, and the collector is inclined at an angle of 31 ° (the altitude of Ouargla city)
Figure 3: ASC made by laboratory L.E.N.R.E.Z.A [7]
B. Co-Simulation methodology
The parameter selection is difficult operation and expensive to perform all experiments or simulations. The DOE method can be employed as an efficient technique to accomplish the suitable and necessary simulations with high accuracy. To investigate main and multiple interactions between parameters in this study, a fractional design was employed with two levels for each parameter +1 for high level and –1 for low level.
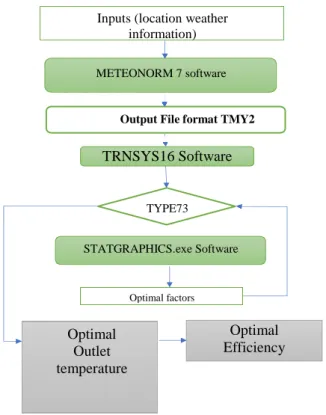
TRNSYS has been used to simulate ASC and STATGRAPHICS for DoE. The methodology of optimization of ASC using different software packages can be summarized on the next algorithm fig4. The figure shows also the interchange of information between METEONRM, TRNSYS and STATGRAPHICS with the inputs and outputs extensions of every program.
Figure 4: Co-Simulation algorithm methodology Optimization and Simulation: this step of the was madden in order to achieve a maximum outlet temperature and efficiency of ASC for this purpose we was using the STATGRAPHICS Software, for the DOE. after getting the fractional plan of experiments from STATGRAPHICS 16 configurations of ASC have been simulated. The results of simulations are injected in STATGRAPHICS in order facilitate post-treatment and results analyze.
IV. RESULTS AND DISCUSSIONS A. Validation
Typical days were chosen in May, 23rd-24th 2011. in order to get logical comparison, we conducted a simulation test to raise the point values of the temperature in the center of the air slide coming out of the ASC.
These values, for regular time intervals, were compared with the experimentally measured values for the same time intervals. All these simulated and calculated values are shown on the figures (5), (6), It can be observed, taking into account the studied phenomenon that the calculated and measured values are in good coherence.
Nr Parameter unit Range
1 collector area m2 [0; inf]
2 fluid specific heat 𝑘𝐽⁄𝑘𝑔. 𝐾 [0; inf] 3 collector fin efficiency factor [-] [0;1] 4 absorber plat emittance [-] [0;1] 5 absorptance of absorber plate [-] [0;1] 6 index of refraction of cover [-] [0; inf] 7 Extinction coefficient thickness product [-] [0;1]
Inputs (location weather information) METEONORM 7 software
Output File format TMY2
TYPE73 STATGRAPHICS.exe Software Optimal factors Optimal Outlet temperature Optimal Efficiency TRNSYS16 Software
Figure 5: Simulated and experimental outlet temperature values on Jun, 23th 2011
Figure 6: Simulated ASC outlet temperature compared with experimental values of 24 May 2011
B. Optimization of the outlet temperature and efficiency A first study was to develop a DOE to optimize the performance of the solar collector to be used as a component of an indirect solar dryer. Several parameters have been studied to determine the influence they had on the output temperature of the collector. These parameters are the measuring interval, continuous one's area of the collector and extinction coefficient-thickness prod and inlet flow rate, and categorical ones absorptance of absorber plate and Index of refraction of cover. For each of the continuous factors and categorical factors the levels of variation (low and high) -1 and +1 have been set and are shown in the table (2).
Continuous
Factors Variables Level -1 Level +1 X1 Collector area [m2
] 1.5 2.5
X4 Extinction coefficient- thickness prod [-]
0.096 0.16 X5 inlet flow rate [kg/hr] 35 55
Categorical
X2 Absorptance of absorber plate [-] 0.94 0.95 X3 Index of refraction of cover [-] 1.49 1.526
Table II. factors studied with their levels
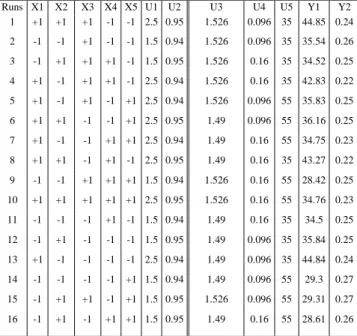
The experimental design that has been used is a half fraction design. we can see in the table (3) the experiments that have been performed, in our study five factors at 2 levels were considered. This represents 25-1 = 16 experiments as well as
the measured responses. The response noted Y1 is the outlet temperature and Y2 is for efficiency of the collector.
Runs X1 X2 X3 X4 X5 U1 U2 U3 U4 U5 Y1 Y2 1 +1 +1 +1 -1 -1 2.5 0.95 1.526 0.096 35 44.85 0.24 2 -1 -1 +1 -1 -1 1.5 0.94 1.526 0.096 35 35.54 0.26 3 -1 +1 +1 +1 -1 1.5 0.95 1.526 0.16 35 34.52 0.25 4 +1 -1 +1 +1 -1 2.5 0.94 1.526 0.16 35 42.83 0.22 5 +1 -1 +1 -1 +1 2.5 0.94 1.526 0.096 55 35.83 0.25 6 +1 +1 -1 -1 +1 2.5 0.95 1.49 0.096 55 36.16 0.25 7 +1 -1 -1 +1 +1 2.5 0.94 1.49 0.16 55 34.75 0.23 8 +1 +1 -1 +1 -1 2.5 0.95 1.49 0.16 35 43.27 0.22 9 -1 -1 +1 +1 +1 1.5 0.94 1.526 0.16 55 28.42 0.25 10 +1 +1 +1 +1 +1 2.5 0.95 1.526 0.16 55 34.76 0.23 11 -1 -1 -1 +1 -1 1.5 0.94 1.49 0.16 35 34.5 0.25 12 -1 +1 -1 -1 -1 1.5 0.95 1.49 0.096 35 35.84 0.25 13 +1 -1 -1 -1 -1 2.5 0.94 1.49 0.096 35 44.84 0.24 14 -1 -1 -1 -1 +1 1.5 0.94 1.49 0.096 55 29.3 0.27 15 -1 +1 +1 -1 +1 1.5 0.95 1.526 0.096 55 29.31 0.27 16 -1 +1 -1 +1 +1 1.5 0.95 1.49 0.16 55 28.61 0.26
Table III. Half fraction design 25-1 with variables in coded
X and natural values U as well Y as responses. 1) PARETO CHART
The Pareto chart in Figure (4) shows the parameters effects on a response, it also indicates is influence is negative or positive. The effects are in decreasing order depending on factor importance. The (+) sign indicates a positive contribution of the effect, while the (-) sign indicates a negative contribution.
The blue vertical line (fig.7) is to determine which effects are statistically significant. The length of each bar is proportional to the value of the statistic calculated
for the associated effect. Any bars beyond the vertical line are statistically significant at the selected level of significance.
Figure 7: Standardized pareto chart for outlet temperature after excluding non-influence factors.
The fitted models of outlet temperature and efficiency after removing the insignificant effects is given in equation (2) and equation (3).
Y1 = 35.83 + 3.83X1 + 0.08X2 − 0.076X3 − 0.63X4 − 3.69X5 − 0.13X1X4 − 0.60X1X5 + 0.12X4X5 Y2 = 0.24625 − 0.01125X1 − 0.0075X4 + 0.005X5 − 0.0025X1X4 + 0.00125X2X3 + 0.00125X2X4 + 0.00125X2X5 − 0.00125X3X4 − 0.00125X3X5 − 0.00125X4X5 (2) (3)
2) Main effects plot
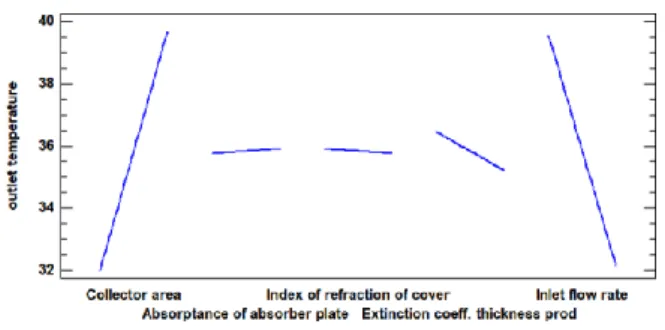
The main effects plot depicted in Figure (8) shows the estimated change in outlet temperature of the plat flat solar air collect, when each of the factors is shifted from its lowest level (-1) to its highest level (+1), with all other factors held constant at (0).
In figure (8), The plot reveals that the outlet temperature of the flat plat ASC decreases as increases (Inlet flow rate and Extinction coefficient- thickness prod). This can be explained by the fact that the increased inlet flow rate has a low heat transfer process between the absorbent plate and the air (convection), and with the increase in glass thickness reduces the rate of solar radiation entering the solar collector. In addition, this graph shows that two factors, namely collector area (left) and Inlet flow rate (right) have a greater effect than absorptance of absorber plate, Index of refraction of cover and Extinction coefficient- thickness prod (middle curve). The plot of each of these factors had an effect at the range 0 to +1 on our response, (collector area effect is equal =3.83℃, absorptance of absorber plate = 0.08℃), (inlet flow rate = 3.69℃, Extinction coefficient thickness prod = 0.63℃ and Index of refraction of cover = 0.076℃) which can be justified by the equation (2)
Figure 8: Main effects plot for outlet temperature 3) Response surface
The surface plot displays a plot of the predicted response as a function of any two of the experimental factors, with the other factors held at selected values [8].
the figure (9) below shows the outlet temperature as a function of Area and Inlet flow rate, when the other factors are fixed on -1.
Figure 9: Estimated Response Surface of the Outlet Temperature as function of Area and Inlet flow rate and
other factors fixed on -1 level.
Note Through this figure, the temperature changes in the form of three zones in the contour below the surface which clearly shows us how the response surface changes, (Red, Green and blue zone), the temperature in the Red zone 44.2℃ in the range [2 − 2.5]𝑚2 of Area and [35; 47] kg/hr
of inlet flow rate, for the green zone the temperature is 38.8℃ in the range [1.5 − 2.5]𝑚2 and [35 − 55]𝑘𝑔/ℎ𝑟 ,
And in the case of the blue zone the outlet temperature is 28℃ in the range [1.5 − 2]𝑚2 and [43 − 55]𝑘𝑔/ℎ𝑟.
4) Finding optimal condition
In the presence of the magnitude and direction of the variations of the parameters defined, the parameter conditions can be optimized for collector outlet temperature and efficiency. In order to obtain this information, the DOE Wizard uses the concept of desirability functions in order to find a combination of the experimental factors that provides a good result for multiple response variables. "Desirability" is measured on a scale of 0 to 1 with 1 being the most desirable.
When several responses suggest different optimal operating conditions different optimal operating conditions, a balance between those responses is achieved using desirability functions. The table (4) below shows the estimated response at the optimal settings of the experimental factors.
Table IV. Factor Settings at Optimum
Factor Low High Optimum
Collector area 1.5 2.5 2.14 Absorptance of absorber plate 0.94 0.95 0.95 Index of refraction of cover 1.49 1.526 1.526 Extinction coeff. thickness prod 0.096 0.16 0.096
Inlet flow rate 35 55 35
For the outlet temperature and efficiency in winter, it is estimated that the maximum percent degree will equal 41.85℃ and for 0.25 when the factors are set at Area = 2.14 𝑚2, Absorptance of absorber = 0.94, Index of refraction of
cover =1.526 it means the glass, Extinction coeff. thickness prod = 0.096, and inlet flow rate = 35 𝑘𝑔/ℎ𝑟 .
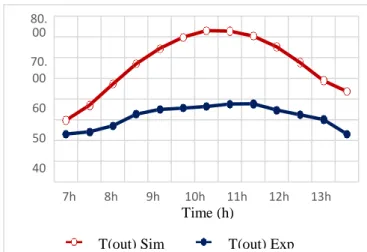
C. Simulation of the Solar collector after optimisation The ASC has been simulated in the optimum conditions which obtained by DoE, then it was compared with the experimental collector realized by (L.E.N.R.E.Z.A).
Figure 10: Comparison of optimal outlet temperature with experimental results in the day of the 06th, Jun
Figure 11: Comparison of optimal outlet temperature with experimental results in the day of the 24th, May
We can see the difference in the temperature of the solar collector shown in figure (10) and figure (11). Among the results obtained the simulants of factors (optimal) with the results of experimental truth detective (L.E.N.R.E.Z.A) in summer.
There are many reasons for high temperature of simulation results by factors (optimization) weathering results, including the following reasons.
First climate factor is that there is a difference in solar radiation during 2011 and 2017 because it plays an important role in high and low temperature, as well as (the area and thickness of the glass, the type of glass used and the type of absorbent pad, and finally flow). These conditions led to a rise in high temperature.
V. CONCLUSION
The present work aimed to improve the performances of the flat plate ASC, especially in the winter, where solar radiation is reduced which negatively affects the outlet temperature of the collector, as well as the low ambient temperature. In order to resolve this problematic we have carried out coupling process between the TRNSYS and STATGRAPHICS software.
The optimization process gave the final result of the optimal conditions at which the outlet temperature and efficiency of the flat plat ASC are at maximum values. These results were as follows: the area 2.14 m2, the absorber plate type is the copper, the type of glass is normal glass (which is more permeable to solar rays than the Plexiglass), Inlet flow rate 35 kg/hr (an important factor in increasing the outlet temperature), 3 mm thickness of the glass, which allows the maximum possible value of solar radiation to pass through the glass.
Then in the last step of the study we did a numerical simulation of the solar collector using the TRNSYS software, based on the optimal conditions, and comparing the results by the results of the practical experience in the
LENREZA laboratory and our eagerness to be in the same climatic conditions, depending on the METEONORM software. The results, using the optimal conditions that we have extracted in the way of DOE, showed a noticeable improvement in thermal behavior represented in the outlet temperature compared to the tests previously carried out in the LENREZA laboratory, where the outlet temperature arrived at (13:00) in the day of 2th December to 41.85 ℃ while the efficiency reaching to 0.25. Finally, figures illustrating the work of the modelled solar collector during different months were presented and commented.
We can note on perspectives on this study that an integration of storage system can resolve solar energy discontinuity problem. As well, the addition of a supply energy is very helpful on many solar systems applications, particularly on solar drying.
REFERENCES
1. Kabeel, A.E., et al., Solar air heaters: Design configurations, improvement methods and applications – A detailed review. Renewable and Sustainable Energy Reviews, 2017. 70: p. 1189-1206.
2. Bennamoun, L. and A. Belhamri, Design and simulation of a solar dryer for agriculture
products. Journal of Food Engineering, 2003. 59(2-3): p. 259-266.
3. Belahya, H., A. Boubekri, and A. Kriker, A Fast Evaluation Method for Energy Building
Consumption Based on the Design of Experiments. IOP Conference Series: Earth and Environmental Science, 2017. 83.
4. Samruamphianskun, T., P. Piumsomboon, and B. Chalermsinsuwan, Effect of ring baffle
configurations in a circulating fluidized bed riser using CFD simulation and experimental design analysis. Chemical Engineering Journal, 2012. 210: p. 237-251.
5. Rukthong, W., et al., Integration of computational fluid dynamics simulation and statistical factorial experimental design of thick-wall crude oil pipeline with heat loss. Advances in Engineering Software, 2015. 86: p. 49-54.
6. VRANIC, B.Z., Design of experiments
methodology in studying near-infrared spectral information of model intact tablets: simultaneous determination of metoprolol tartrate and
hydrochlorothiazide in solid dosage forms and powder compressibility assessment using near-infrared spectroscopy, in Departement
Pharmazeutische Wissenschaften. 2015, University of Basel.
7. MOGHARBI, M.H., Daoud, Conception et réalisation d’un capteur solaire plan à air. 2010, UKMO. 80. 00 70. 00 60 50 40 30. 00 20. 00 10. 00 0. 0 0 7h 8h 9h 10h 11h 12h 13h 14h 15h 16h 17h 18h 19h Time (h) T(out) Sim 2017/05/24 T(out) Exp 2011/05/24