HAL Id: hal-01159131
https://hal.inria.fr/hal-01159131
Submitted on 2 Jun 2015
HAL is a multi-disciplinary open access
archive for the deposit and dissemination of
sci-entific research documents, whether they are
pub-lished or not. The documents may come from
teaching and research institutions in France or
abroad, or from public or private research centers.
L’archive ouverte pluridisciplinaire HAL, est
destinée au dépôt et à la diffusion de documents
scientifiques de niveau recherche, publiés ou non,
émanant des établissements d’enseignement et de
recherche français ou étrangers, des laboratoires
publics ou privés.
Emergent Robustness in Software Systems through
Decentralized Adaptation: an Ecologically-Inspired
ALife Approach
Franck Fleurey, Benoit Baudry, Benoit Gauzens, André Elie, Kwaku
Yeboah-Antwi
To cite this version:
Franck Fleurey, Benoit Baudry, Benoit Gauzens, André Elie, Kwaku Yeboah-Antwi. Emergent
Ro-bustness in Software Systems through Decentralized Adaptation: an Ecologically-Inspired ALife
Ap-proach. European Conference on Artificial Life 2015, Jul 2015, York, United Kingdom. �hal-01159131�
Emergent Robustness in Software Systems through Decentralized Adaptation: an
Ecologically-Inspired ALife Approach
Franck Fleurey
1, Benoit Baudry
2, Benoit Gauzens
3, André Elie
2and Kwaku Yeboah-Antwi
21SINTEF, Norway
2INRIA, France
3Université de Rennes 1, France
Abstract
The ecosystem of web applications faces a critical paradox: on one hand, the Internet is a constantly evolving and unpre-dictable computing platform, on the other hand, the software services that run on top of it hardly have the ability to adapt to the evolution of this platform. Among the software services, we distinguish between service providers that provide micro services and service consumers that aggregate several micro services to deliver macro services to customers. Providers and consumers must handle uncertainty: providers cannot know in advance what consumers need; consumers rely on third-parties that can disappear at any time. Our proposal analogizes the software consumer / provider network to a bi-partite ecological graph. This analogy provides the founda-tions for the design of EVOSERV, an individual-based ALife simulator used to experiment with decentralized adaptation strategies for providers and consumers. The initial model of a software network is tuned according to observations gath-ered from real-world software networks. The key insights about our experiments are that, 1) we can successfully model software systems as an ALife system, and 2) we succeed in emerging a global property from local decisions: when con-sumers and providers adapt with local decision strategies, the global robustness of the network increases. We show that these results hold with different initial situations, different scales and different topological constraints on the network.
Introduction
The infrastructure of the Internet (computers, routers, servers and connections) can be considered an evolving complex adaptive system (Park and Willinger, 2005; Albert et al., 1999). Mapping the internet as a graph, it is possi-ble to observe that the internet is an extremely adaptive net-work which is highly unpredictable due to its attrition/churn rate (i.e. nodes or connections frequently appear and dis-appear with no warning). Software companies tackle this unpredictability using loosely coupled architectures (Huhns and Singh, 2005): on one hand, service providers develop and maintain micro services that handle basic functionali-ties (e.g., database management, access control, etc.) which they provide over the web; on the other hand, service
con-sumers access several micro services over the Internet to
build macro services that they provide to customers (e.g.,
salary management or travel planning). Despite these ef-forts, both providers and consumers still face uncertainty. Providers must develop services with no certainty about what consumers exactly need, how often they need it and what level of granularity is needed. This poses an essential challenge when it comes to deciding what services to pro-vide and in which quantities. Consumers aggregate third-party services, but they cannot predict if the provider will fail, or if the connection to the provider will fail or which provider provides the most of the services they need. In complex adaptive systems, entities that cannot evolve in re-sponse to environmental changes contribute to the imperil-ment of the robustness of the whole system (e.g., as demon-strated in food webs (Staniczenko et al., 2010)). In the con-text of software networks, this means that the lack of evo-lutionary capabilities in software service providers and con-sumers greatly reduces the robustness of the global software network (providers, consumers and connections). Today, the robustness of these software networks relies on either over-approximated redundancy (providers provide much more than needed in case the consumer’s demand increases) or on centralized techniques that assume a global view and knowledge of the network and its topology. The former so-lution which is the most commonly used today implies and results in a waste of resources, while the latter is rarely ap-plied because it is often impossible for software companies to build and have an accurate global view of the system (es-pecially concerning the interaction between them and their consumers). There exists a need for novel software engi-neering approaches to handle the uncertainty and dynamic-ity of Internet applications (Bertolino et al., 2015).
In this work, we investigate a novel approach to engi-neering software services deployed on evolving computing platforms. Following the intuition that "computer systems can be better understood, controlled, and developed when viewed from the perspective of living systems” (Forrest et al.,
2002), we developed EVOSERV, an ecologically-inspired
ALife individual-based model and simulator which mod-els software systems as an artificial life system. EVOSERV
mu-tualistic ecological interactions (e.g., bee/pollinator net-works). Treating consumers and providers as individuals
in an ecological system, EVOSERVenables the modeling of
evolution in a software system during the course of its life-cycle thereby allowing the investigation of the changes in robustness of the software system during its lifecycle. We
tune EVOSERVwith two large real-world software networks.
We propose four (4) major classes of localized strate-gies that describe and govern how consumers and providers evolve and adapt. These four (4) classes of strategies are generalized from the set of localized evolutionary/adaptation actions that are possible in a distributed software system.
Using EVOSERV, we empirically compare and contrast the
adaptability of various software systems subjected to these strategies focusing on the changes in robustness of the global software systems. We define robustness as the ability of con-sumers to survive the extinction of providers and adapt the notion of extinction sequence from ecology (Burgos et al., 2007) to measure it.
Our results empirically show that, localized adaptation of consumers and providers in software systems enables the emergence of global functional robustness. They empiri-cally prove that systems utilizing our localized adaptation strategies perform better than a random adaptation strategy (33% robustness with random adaptation vs. 46% with our adaptation strategies). We also run experiments that confirm the stability of these results at different scales and on differ-ent software systems.
In this paper, we develop three main contributions • EVOSERV1, an ALife, individual-based simulator that
ac-curately models the evolution and adaptation of a complex software system during its lifecycle and allows the inves-tigation of the resultant robustness.
• Empirical evidence showing that global robustness can emerge from localized evolution rules in provider/con-sumer software networks.
• Empirical data about two real-world provider/consumer software graphs in which we consistently observe a power-law distribution for (i) the number of services in consumers and (ii) the rate of service usage among con-sumers. We use this data to tune the initial bipartite net-work used in EVOSERV.
Bipartite interactions in Internet Computing
In this section, we introduce the bipartite graph model upon which our simulation is built, as well as the different evolu-tionary strategies and mechanisms that we experiment with. We chose a bipartite graph model as the foundation because it allows us to capture and represent the interactions and re-lationships present in a software network.
1 https://github.com/DIVERSIFY-project/ EVOSERV required provided 0..* clients 1..* hosts 1..* 1..* Consumer capacity:int Provider name:int Service C1 1,2 C2 1,3,4 C3 1,2,4 C4 2,3 P1(cap=3) 1,2,3 P2(cap=3) 1,2,3,4
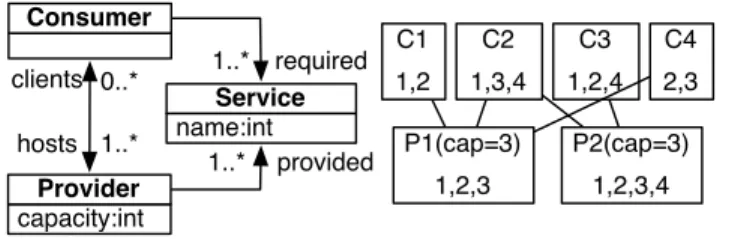
Figure 1: Model and one instance of software bipartite graph
Bipartite software interactions
The left part of Fig. 1 describes the data model we use to ab-stract bipartite software relationships between the different components of a software system.
• Provider individuals are an abstract representation of nodes on the Internet that provide micro-services to other nodes (e.g. a web server). A Provider P , is charac-terized by three attributes: provided, a list of services provided by P ; clients, the list of consumers that con-sume at least one service of P ; a capacity, the maxi-mum number of Consumers that can access one or more of P ’s services (every individual accessing P is counted once irrespective of the number of services accessed). • Consumer individuals aggregate remote services in
or-der to offer macro-services to their customers (e.g., a travel web site such as Expedia). A Consumer C is characterized by two attributes: required, a list that contains all the services that C needs; hosts, the set of providers to whom C connects to over the Internet in or-der to get all the services it needs (we do not impose a limit on the number of providers to whom a consumer can connect to).
A Service in our model refers to a resource that is being required or provided. A service is referenced by its name(an integer identifier in our model).
The right part of Fig. 1 displays an example of a software
system modeled in EVOSERV. It contains 4 consumers and
2 providers with both providers having a capacity of 3. Con-sumer C1 requires services 1 and 2 to function correctly and accesses those services through a connection to P 1; C2 re-quires services 1, 3 and 4 and accesses them through connec-tions to P 1 and P 2. Provider P 1 is currently at maximum capacity while P 2 can still serve one more client.
The following sub-sections describe the dynamic aspects of software bi-partite graphs. We distinguish between two
types of changes: adaptation and evolution. Adaptation
refers to changes to individuals nodes and it does not vary the composition of the set of nodes in the system, while
evo-lutionrefers to changes which vary the composition of the
system(ie. providers and consumers can appear and disap-pear over time).
Adaptation in E
VOS
ERVProvider Adaptation Providers adapt by changing the set
of services they offer. We experiment with two different types of adaptation operators
Random: A provider P chooses at random to either add a service or drop one of the services it provides.
Popular: A provider P chooses either to add a popular service to its list of services provided or to drop a unpopular service from its list of services provided. When P adds a ser-vice, it favors services that are popular among its consumers with more popular services having higher probabilities of being selected. Conversely, when P drops a service, ser-vices that are not popular among P ’s consumers have higher probabilities of being dropped. The probability of dropping a service increases with the number of consumers connected to P . This is in order to reduce the pressure on this provider when it’s at capacity. We assume that P can access the set of services required by its consumers.
Constraints on Provider’s adaptive behavior: Both adaptive behaviors described above are constrained such that, all consumers of a given provider, P , can always ac-cess what they require. Thus, if P decides to drop a Service, it first checks that none of its consumers would go extinct (each consumer provides a routine that assesses whether the Service is strictly required).
Consumer Adaptation Consumers adapt by changing the
links to providers through which they access their required services. We experiment with two different kinds of adaptive operators
Random: A consumer, C, chooses at random a new provider to link to.
Equitable: A consumer, C, attempts to optimize the diversity of its service provisioning by accessing a set of providers that maximizes its equitability (i.e. the
num-ber of times each required service is provided). Given
S = {s1, . . . , sn}, the set of services that a consumer
re-quires and #occsi, the number of times a service si is pro-vided through a link to a consumer, the Shannon index for a consumer is: Hi,P0 = − n X k=1 #occsk n ln #occnk n
and its equitability is exp(Hi,P0 ). Maximizing equitability ensures that a consumer has a set of connections which of-fers each required service an even number of times.The con-cept of equitability is taken from ecology where it is used to evaluate biodiversity.
In practice, many different advertisement or discov-ery mechanisms can be used to find the set of potential
providers. Our experiment does not intend to replicate
any particular mechanism but only assumes that at any point in time, consumers have access to a neighbourhood
of providers, which we pick as a random subset of the set of all providers.
Constraints on consumers adaptation: Both adapta-tion operators described above are constrained such that, each required service that was already provided remains pro-vided. Any existing link that only provides consumer C with services that are also provided through other links can be discarded, thereby allowing new links to be made to any provider in the neighbourhood who provides at least one of C’s required services thats currently unprovided.
Global constraints over the model to keep costs
compa-rable between different experiments :
The total number of links in the network or the total num-ber of services provided in the network can change over the adaptation process and can introduce a confounding bias. Allowing more links or introducing more provided services can have a positive impact on robustness by providing con-sumers with more opportunities to link to their required ser-vices. However, we wanted to prevent this phenomenon in order to isolate the effect of adaptation rules when evaluat-ing the impact on global robustness.
The number of services and links are therefore kept con-stant. This constraint is enforced in the following manner: the simulator allows a random set of nodes to run adaptations which decrease the number of links and services and collects tokens corresponding to these deletions. In a second step, those tokens are distributed randomly in order to allow some nodes to add links and services. This token system ensures the decentralized nature of our simulations while conserving some global constraints. In the real world, this corresponds to fixing the total amount of available resources in the soft-ware system (e.g., the number of services and the amount of bandwidth).
Ecological concepts for robust software
networks
In this work, we analogize a network of software services that run over the Internet to bipartite ecological graphs. This analogy comes with two essential principles that we build upon in this work: 1) species in ecological communities adapt in a completely decentralized manner to cope with a continuously evolving environment; 2) ecologists have de-veloped sound measures to quantify the robustness of a bi-partite graph as represented by interactions between species. In the following, we summarize these two ecological princi-ples.
Species adaptation in ecosystems is completely decentral-ized and is not driven by a global goal at the ecosystem level. Adaptation is necessary in the face of an evolving environ-ment; as environmental conditions change over time, species have to adapt (i.e. keep a good reproductive success) to their local conditions. The Red Queen hypothesis (Van Valen,
1973), named in reference to a statement2made to Alice by the Red Queen in Lewis Carroll’s Through the looking glass, crystallizes the idea that, species need to constantly evolve in order to survive, in the same way as Alice and the Red Queen need to constantly run to stay in the same place. The
Red Queen Hypothesisprovides a good theoretical raison
d’êtrefor adaptation, stating that, in order to increase the persistence of our Consumers and Providers individually, a constant adaptation is key to keeping a good fit to specific conditions. This hypothesis however lacks a comprehensive view at the macroscopic scale: is the robustness of our sys-tem an emergent property of such behavior?
Some experiments have shown that large levels of diver-sity and redundancy promote the stability of functional pro-cesses in ecosystems like biomass production (Tilman and Downing, 1994). However, the mechanisms underlying this experimental evidence remains elusive in the case of com-plex networks of interacting species. Mathematical models show that more complex systems (in terms of species rich-ness and number of interactions) are more likely to collapse. This incompatibility between theoretical and empirical ob-servations is known as May’s paradox (May, 1972). This paradox and more broadly, the relationship between com-plexity, evolution and stability is a still open fundamental question in ecology. Most of this previous work reasons on ecological graphs where nodes represent species, and edges ecological interactions (e.g. predation or parasitism). The topology of ecological graphs (emerging from ecological processes such as extinction, colonization, but also evolu-tion) is non random, and its structure seems to favour stabil-ity (Yodzis, 1981).
We investigate evolution and adaptation in software sys-tems in order to experiment with the emergence of global robustness through localized decentralized actions. Given a bipartite graph that models a network in which nodes are species and edges are species interactions, the robustness
measure(Burgos et al., 2007) quantifies the ability of one
level of the graph to survive the extinction of species in the other level. The primary extinction sequence can be per-formed according to different strategies: randomly remov-ing nodes, removremov-ing the most or least connected ones, etc. In the case of mutualistic graphs, as soon as a species looses all of its connections, it is unable to reproduce (for plants) or feed (for pollinators) and thus goes extinct. This is called a secondary extinction. Referring back to the network in Fig. 1: if P1 is removed, C4 goes extinct. If C1 has the ability to adapt, it can connect to P2 otherwise it also goes extinct, a secondary extinction; subsequently, when P2 is removed, the whole network goes extinct.
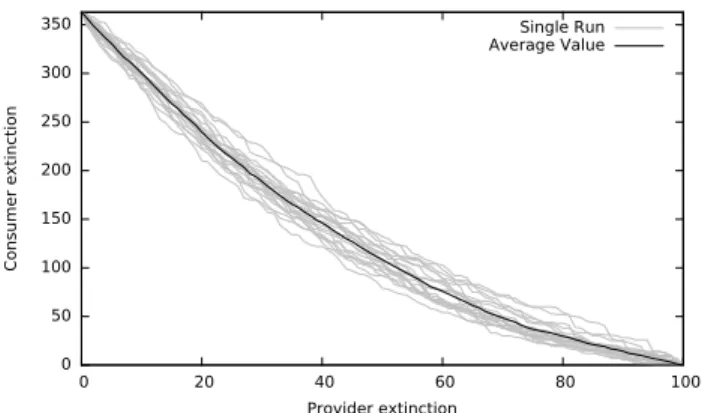
Fig. 2 plots the relationship between secondary and pri-mary extinctions. The robustness index is the area under the curve. In our experiments, we normalize the robustness
2
"Now, here, you see, it takes all the running you can do, to keep in the same place."
0 50 100 150 200 250 300 350 0 20 40 60 80 100 Consumer extinction Provider extinction Single Run Average Value
Figure 2: Relationship between secondary and primary ex-tinctions in a bipartite graph (with a random primary extinc-tion sequence)
index by considering it a ratio of the maximum robustness value (in Fig. 2 the robustness is thus area_under_curve350×100 ). Since primary extinctions are random, we compute several robustness indices on a given graph to obtain a mean. For example, Fig. 2 shows 20 runs and the mean value as a thick line: the lowest robustness index is 0.33 and the max is 0.4.
Experimental design
All of our experiments start with a bipartite graph that mod-els a software system and then simulates the evolution of that graph to evaluate the effect of the decentralized adaptation rules. In this section, we discuss how we set up the initial graph, and how we tune the different experimental parame-ters.
Mining software interactions to tune E
VOS
ERVWe analyzed two real-world software systems in order to generate real world data to aid us in tuning of our initial graph. We collected data about installations of WordPress3, an open-source content management system used to easily deploy web sites, and also data about web browsers. We se-lected these two case studies because both are very popular technologies (WordPress is deployed on 23% of the top 10
million web sites 4, and billions of web browsers are
de-ployed and used daily worldwide) and also because both technologies are open and can be easily extended by their users through the addition of plugins that provide specific functionalities (e.g., display photo, read pdf, etc.). For both case studies, we collected the number of plugins installed on each client in the dataset and the subsequent distribution of plugin usage. This data is used to tune the size of software entities in our graph, as well as the distribution of services on these entities.
3https://wordpress.org/ 4
http://w3techs.com/technologies/overview/ content_management/all/
Application size Number of applications 0 10 20 30 40 50 0 3 6 9 13 18 23 Services
Number of time requiered 0
50
100
200
0 7 15 24 33 42
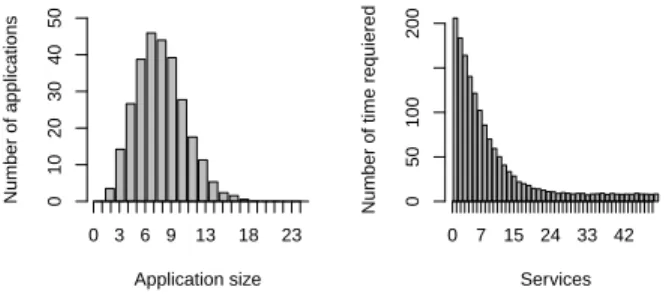
Figure 3: Number of Services per entity (left) and distribu-tion of Service usage (right) in the initial graph
WordPress: Analyzing the 500 000 top web sites5, we
selected the ones that use WordPress. This gave a list of 110 000 WordPress sites. We then crawled these sites to find
out which plugins they use. Analyzing this data6, we found
out that the number of plugins per site follows a poisson distribution with an average value of 5. The distribution of plugin usage follows a negative exponential slope.
Web browsers: Since browsers are installed on user ma-chines, we could not access this data directly. We therefore set up https://amiunique.org/, a website where we collect anonymous information about the browser, the list of fonts and plugins it contains from every visitor. By February 2015, the site had been visited by 63,000 unique visitors. All of the observed browsers contained a total of 1,920 different plugins. We observeed distributions very similar to the ones in WordPress: a negative exponential slope for the plugin usage distribution and poisson distribution with an average of 6 for the number of plugins per browser.
Tuning the initial model The initial graph for our
simula-tion had the following size: 300 Consumers, 100 Producers and 50 Services. The 1:3 ratio between the 2 first parameters was loosely based on a Cloud Service Brokerage example, with the values increased by an arbitrary multiplying factor of 100. We fixed the number of evolution cycles through which the bipartite graph is run to 500. We then used the data observed on real systems to tune the size of Consumers, as well as the distribution of the Service usage among these Consumers. As seen in Fig. 3, the size of Consumers fol-lows a poisson distribution of parameter 5.47, and the Ser-vice usage, a power law distribution of parameter 2.08.
Experiments
In order to evaluate the effect of the adaptation strategies de-scribed in section II, we run the simulation with four
differ-5http://www.alexa.com/topsites 6
Wordpress data available here: http:// diversify-project.eu/wordpress/
ent combinations of adaptive behaviors for Consumers and Providers.
random-random: Consumers and Providers adapt ran-domly. This is the baseline
random-popular: Consumers adapt randomly and
Providers adapt according to the popular adaptation behav-ior.
equitable-random: Consumers adapt according to the
equitableadaptive behavior and Providers adapt randomly.
equitable-popular: Consumers adapt according to the
equitableadaptive behavior and Providers adapt according
to the popular adaptation behavior.
To ensure statistical validity, we needed to run the sim-ulation and robustness computations a sufficient number of times. We utilized Monte Carlo estimation to determine the number of times needed.
• We determined that the robustness value of one graph should be the mean value computed over 50 extinction sequences (each sequence randomly picks providers that go extinct). Monte Carlo methods showed that, after 50 sequences, the variance of a new robustness value was be-low 0.05%
• We run each simulation over 50 different initial graphs and determined that, after 50 graphs, the variance for re-sults from a new simulation was below 0.01% .
Results
RQ1. Can local adaptation lead to the emergence
of global robustness in software systems?
This was the key research question for our work. We eval-uated the impact of the different adaptation strategies on the evolution of global system robustness. The “random-random” strategy was used as a baseline, mimicking how software systems currently do adapt. All of the adaptation strategies were subject to the same global constraints in the model; i.e. all consumers remain satisfied and the cost of the model (total number of services provided and total number of links) is kept constant.
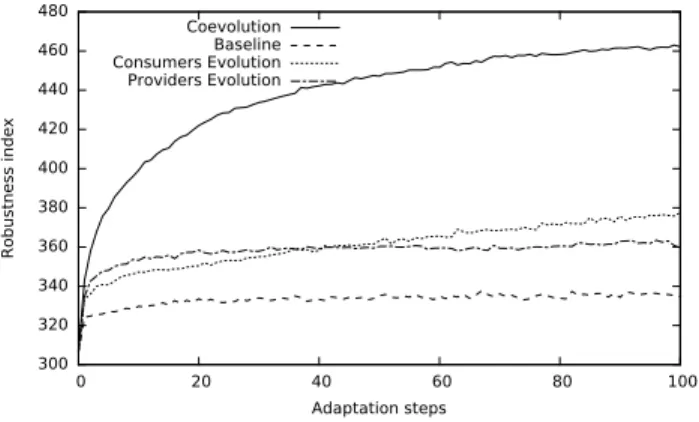
Fig. 4 shows the evolution of the robustness of the global system for the four strategies. This plot was obtained by av-eraging the results from 50 runs of the simulator on 50 ran-domly generated initial models. Table 1 presents the values for the average final robustness for the different strategies and their standard deviation.
These results show that, the localized adaptation opera-tors had a positive impact on the global robustness of the system when only one class of nodes(Providers and Con-sumers) was utilizing them (rows 2 and 3 in Table 1). More interestingly, the hybrid approach of all nodes utilizing their localized adaptation operators simultaneously(row 4 in Ta-ble 1) resulted in a much higher benefit than when only one was. This shows that there is a synergy between those decen-tralized strategies and this is in favor of the global robustness
Adaptation Strategy Robustness
Consumer Providers Average Std. Dev.
Random Random 33.4% 0.896
Equitable Random 37.7% 1.084
Random Popular 35.9% 1.018
Equitable Popular 46.2% 1.584
Table 1: Final robustness of the global system with four dif-ferent adaptation strategies (observations on 25 runs)
300 320 340 360 380 400 420 440 460 480 0 20 40 60 80 100 Robustness index Adaptation steps Coevolution Baseline Consumers Evolution Providers Evolution
Figure 4: Evolution of globalized robustness using different decentralized adaptation strategies
of the system. This result is interesting because the strate-gies used were only based on local knowledge and target local optimizations for individual Providers and Consumers. There was no explicit push for these individual strategies to have a positive effect on the global robustness of the system. Although the results from the simulations described so far are encouraging, we can only conclude from them that global robustness can emerge in theese specific simulation scenarios. In practice, a number of simplified decisions were made in the simulations. Firstly, the Providers and Con-sumers were constant. A real world system is more dy-namic with Providers and Consumers constantly appearing and disappearing and becoming either temporarily or perma-nently unavailable. Secondly, the distribution of Providers and Consumers and the distribution of Services were con-stant but may vary in real life. We decided to investigate the results of the simulation in the absence of such simpli-fications and also investigated if the results would hold for systems of a different scale. The next 3 research questions discuss these investigations.
RQ2. How sensitive are the adaptation rules when
relaxing topological constraints of the software
system?
This question focuses on the impact of the hard constraints of previous experiments (fixed size and topology of graph) on our results. We ran a set of experiments where Con-sumers and Providers evolved randomly (they could go
ex-tinct, be mutated, reproduce or be cloned allowing some new entities to appear) in parallel to the adaptation strategy. Re-production, cloning and extinction probabilities were set at 30%. New Consumers were produced by crossover of two ancestors with the new node containing a sub-set of the ser-vices of its ancestors required. New Providers were created using one of the two evolution strategies described below. Providers’ random evolution strategies : New Providers
are created by cloning an existing one and mutating the list of provided Services (add a new Service or remove one). Service mutation probability was set at 20%. Baseline Random adaptation with random evolution of
Providers.
Equitable popular Equitable-Popular adaptation with a random evolution of Providers.
Providers’ ecological evolution strategies : This
im-proves the random evolution strategy such that, when cloning a Provider, the mutation factor is no longer
a static probability. The mutation rate of a provided
Service depends on its success among the Consumers connected to it: the more successful a service, the greater the probability it will also be provided by the clone. This strategy introduces a form of environmental pressure in the adaptation, with the aim of creating offsprings that are more fit than their ancestors.
Baseline (ecology). Random adaptation with an ecologi-cal evolution of Providers.
Equitable popular (ecology). Equitable-Popular adap-tation with an ecological evolution of Providers. Fig. 5 shows the results for 4 experiments which com-bine the two adaptation strategies (Random and Equitable-Popular) with the two alternative evolutionary strategies: a fully random one and an ecology inspired one, which is shown to bring improvement slower than the original, but eventually to surpass it.
The impact on robustness was similar to the previous, more constrained, experiments. The main difference is that the rate of convergence is slower: the results of Fig. 5 are for 500 combined adaptation and evolution steps while on Fig. 4 only 100 steps were necessary when no evolution was simulated.
RQ3. How does the distribution of services among
consumers influence the results?
The distribution of services among the Consumers is a criti-cal parameter of the simulation. In all previous experiments, the size of Consumers followed a poisson distribution of pa-rameter 5.47 and the Service usage, a power law distribution of parameter 2.08. Since these distributions were tuned by observing real bipartite software interactions, we are con-fident about their relevance. Yet, the exact parameters of
Equitable popular Equitable popular (ecology) Baseline Baseline (ecology) R o b u s tn e s s i n d e x 300 320 340 360 380 400 420 440 460 480
Adaptation / evolution steps
0 100 200 300 400 500
Figure 5: Evolution of the overall robustness using different decentralized adaptation strategies in parallel with different system evolution.
those distributions will vary from one situation to the next (and even possibly over time).
This question addresses the sensitivity of the results with respect to these distributions. In order to do answer it, we replicated the simulation presented on Fig. 4 using graphs generated from different statistical distributions.
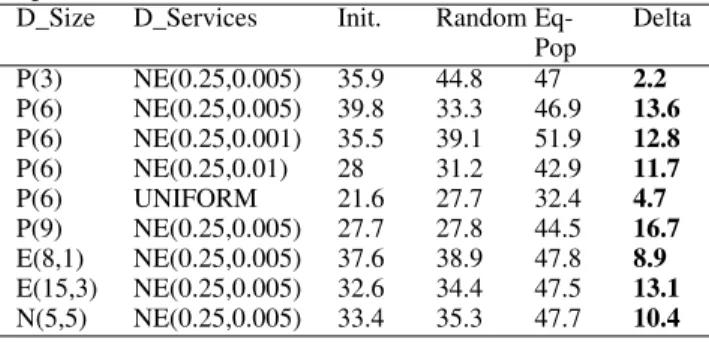
Table 2: Results for different initial distributions of nodes sizes and Services usage. P(λ) for a Poisson distribution, N(µ, σ) for a normal distribution, E(λ, min) for a power law with a minimum value of min and NE(λ, u) for a Negative Exponential distribution with an added constant u.
D_Size D_Services Init. Random Eq-Pop Delta P(3) NE(0.25,0.005) 35.9 44.8 47 2.2 P(6) NE(0.25,0.005) 39.8 33.3 46.9 13.6 P(6) NE(0.25,0.001) 35.5 39.1 51.9 12.8 P(6) NE(0.25,0.01) 28 31.2 42.9 11.7 P(6) UNIFORM 21.6 27.7 32.4 4.7 P(9) NE(0.25,0.005) 27.7 27.8 44.5 16.7 E(8,1) NE(0.25,0.005) 37.6 38.9 47.8 8.9 E(15,3) NE(0.25,0.005) 32.6 34.4 47.5 13.1 N(5,5) NE(0.25,0.005) 33.4 35.3 47.7 10.4
Table 2 presents the results of the simulations. The
first and second columns liindicates the parameters for the
distribution of Consumer size (Dsize) and Service usage
(Dservices) respectively. The next columns list the
robust-ness value of the initial network (Init.) and of the final network evolved with the baseline random (Rand.) and the equitable-popular (Eq − P op.) strategies. The last column indicates the difference in final robustness between both adaptation strategies. The results show that the guided strat-egy always performs significantly better than the baseline. The two lowest results (row 1 and 5) correspond to extreme situations. In row 1, a P(3) distribution makes the average size of Consumers 3, with a good portion of Providers and Consumers of 1 or 2. In that case, the exploration space is
very much reduced and the impact of the guided strategy is limited. In row 5 the Services are chosen using a uniform distribution: the nodes are provided with sets of Services that are completely independent from one another. When using a power law (all other rows in the table), the sets of Services are related and more similar. In practice, the uni-form distribution is unrealistic: there always are very pop-ular micro-services used by everyone (e.g., Google Analyt-ics).
RQ4. What is the effect of the system’s scale?
To assess the generality of the results beyond the fixed net-work size used in previous experiments (300 Consumers, 100 Producers and 50 Services), we repeated them at differ-ent scales and using differdiffer-ent ratios between the values. All experiments have shown a clear benefit of the Equitability-Popular strategy over the baseline with various degrees. For example, repeating the experiments with a number of 5000 Consumers and 1000 Providers yielded an initial robustness of 40.3 and a final average robustness of respectively 43.3 and 52.2 for the baseline and Equitability-Popular. With re-spect to scalability and sensibility to the different parame-ters, the Equitable-Popular strategy was always significantly better than the random strategy.
Related works
Lim and Bentley (2012) propose an ALife agent-based model to simulate the evolution of an ecosystem of soft-ware apps on an app store. They model app developers, app users and apps as agents and experiment with different behaviors for developers. Their goal is to determine what are the best strategies for app developers in order to create successful apps. They manage to identify a combination of strategies and frequency for each strategy with which they can reproduce the development Apple’s iOS app ecosystem. Cocco et al. (2014) have recently provided similar modeling to understand what strategies should be adopted by applica-tion developers. While these works adopt a model similar to our, their goal is different: understand good strategies for developers in their case, model good adaptation strategies for global robustness in our case.
Goings et al. (2012) present an ecology-based evolution algorithm that produces good behavioral models for com-plex software systems. They show that adapting ecological principles for evolution produces models of software that are more diverse and evolvable than the models produced by a more classical evolutionary algorithm. Similarly to our simulation, their evolutionary algorithm evolves models in a very constrained environment (fixed population and limited resources), which eventually pushes towards more diversity and good properties for future evolutions.
Another area of related work is the simulation of service-based systems (Wang et al., 2010; Kaur et al., 2013). This is a very active area as shown in the literature reviewed by
Smit and Stroulia (2013). They review 6 major frameworks for the simulation of service-oriented systems. Simulation are either based on the abstract description of the services or on more formal descriptions that rely on discrete-event se-mantics. These different models support different tasks such as testing, interaction vizualization, code generation or per-formance prediction. However, none of these frameworks evaluates the impact of perturbations, nor simulates decen-tralized evolution. Other works have evaluated the ability of service-oriented systems to sustain perturbations, such as denial-of-service attacks (Xu and Lee, 2003), but did not reason about the global dynamics of the system to establish robustness.
Conclusion
In this paper we have proposed EVOSERV, a simulation
model to experiment with decentralized adaptation strate-gies in distributed software systems. This simulation model is calibrated with data from actual software models. We have proposed a set of guided decentralized adaptation strategies and evaluated them against a random baseline in a set of different simulations. The results indicate that the combi-nations of the proposed Equitable and Popular local strate-gies significantly increases ability of the system to sustain the extinction of service Providers (i.e., called robustness in this paper). These results mark a significant first step to-wards the transposition of the ecological Red Queen
hypoth-esisinto actual software systems. Future work include two
main threads: analyze topological properties of the graph over the simulation to characterize the phenomena that fa-vor robustness emergence; deploy these behaviors on a con-trolled SOA system.
In the future, developers of platforms that provide micro-services and of service mash-ups that aggregate micro-services could enhance their products with simple decision making strategies, which benefit the local nodes and participate in a system-wide improvement of robustness.
Acknowledgements
This work is partially supported by the EU FP7-ICT-2011-9 No. 600654 DIVERSIFY project.
References
Albert, R., Jeong, H., and Barabási, A.-L. (1999). Internet: Diam-eter of the world-wide web. Nature, 401(6749):130–131. Bertolino, A., Blake, B., Mehra, P., Mei, H., and Xie, T. (2015).
software engineering for internet computing. IEEE Software, 32.
Brännström, A., Johansson, J., Loeuille, N., Kristensen, N., Troost, T. A., Lambers, R., and Dieckmann, U. (2012). Modelling the ecology and evolution of communities: a review of past achievements, current efforts, and future promises. Evolu-tionary Ecology . . ., 14:601–625.
Burgos, E., Ceva, H., Perazzo, R. P. J., Devoto, M., Medan, D., Zimmermann, M., and María Delbue, A. (2007). Why nest-edness in mutualistic networks? Journal of theoretical biol-ogy, 249(2):307–13.
Cocco, L., Mannaro, K., Concas, G., and Marchesi, M. (2014). Simulation of the best ranking algorithms for an app store. In Mobile Web Information Systems, pages 233–247.
Forrest, S., Balthrop, J., Glickman, M., and Ackley, D. (2002). Computation in the wild. In Park and Willinger (2005). Goings, S., Goldsby, H., Cheng, B. H. C., and Ofria, C. (2012). An
ecology-based evolutionary algorithm to evolve solutions to complex problems. In Proc. of the Int. Conf. on the Simula-tion and Synthesis of Living Systems (ALife).
Huhns, M. N. and Singh, M. P. (2005). Service-oriented comput-ing: Key concepts and principles. Internet Computing, IEEE, 9(1):75–81.
Kaur, N., McLeod, C., Jain, A., Harrison, R., Ahmad, B., Colombo, A. W., and Delsing, J. (2013). Design and simulation of a soa-based system of systems for automation in the residential sector. In Proc. of the International Conference onIndustrial Technology (ICIT), pages 1976–1981.
Lim, S. L. and Bentley, P. J. (2012). How to be a successful app developer: Lessons from the simulation of an app ecosystem. SIGEVOlution, 6(1):2–15.
May, R. M. (1972). Will a Large Complex System be Stable? Na-ture, 238(5364):413–414.
Park, K. and Willinger, W. (2005). The Internet as a large-scale complex system, volume 3. Oxford University Press. Rossberg, a. G., Matsuda, H., Amemiya, T., and Itoh, K. (2006).
Food webs: experts consuming families of experts. Journal of theoretical biology, 241(3):552–63.
Smit, M. and Stroulia, E. (2013). Simulating service-oriented sys-tems: A survey and the services-aware simulation framework. Services Computing, IEEE Transactions on, 6(4):443–456. Staniczenko, P. P. A., Lewis, O. T., Jones, N. S., and Reed-Tsochas,
F. (2010). Structural dynamics and robustness of food webs. Ecology Letters, 13(7):891–899.
Tilman, D. and Downing, J. A. (1994). Biodiversity and stability in grasslands. Nature, 367(6461):363–365.
Van Valen, L. (1973). A new evolutionary law. Evolutionary the-ory, 30:1–30.
Wang, W., Wang, W., Zhu, Y., and Li, Q. (2010). Service-oriented simulation framework: An overview and unifying methodol-ogy. Simulation, page 0037549710391838.
Xu, J. and Lee, W. (2003). Sustaining availability of web services under distributed denial of service attacks. IEEE Transactions on Computers, 52(2):195–208.
Yachi, S. and Loreau, M. (1999). Biodiversity and ecosystem pro-ductivity in a fluctuating environment: the insurance hypoth-esis. Proceedings of the National Academy of Sciences of the United States of America, 96(4):1463–8.
Yodzis, P. (1981). The stability of real ecosystems. Nature, 289:674–676.