UNIVERSITÉ DE MONTRÉAL
INDIRECT MEASUREMENT OF INTER-PARTICLE FORCES IN A GAS-SOLID FLUIDIZED BED AT HIGH TEMPERATURE WITH A SIMPLE APPROACH
NAVID ELAHIPANAH
DÉPARTEMENT DE GÉNIE CHIMIQUE ÉCOLE POLYTECHNIQUE DE MONTRÉAL
MÉMOIRE PRÉSENTÉ EN VUE DE L’OBTENTION DU DIPLÔME DE MAÎTRISE ÈS SCIENCES APPLIQUÉES
(GÉNIE CHIMIQUE) JUIN 2017
UNIVERSITÉ DE MONTRÉAL
ÉCOLE POLYTECHNIQUE DE MONTRÉAL
Ce mémoire intitulé:
INDIRECT MEASUREMENT OF INTER-PARTICLE FORCES IN A GAS-SOLID FLUIDIZED BED AT HIGH TEMPERATURE WITH A SIMPLE APPROACH
présenté par : ELAHIPANAH Navid
en vue de l’obtention du diplôme de : Maîtrise ès sciences appliquées a été dûment accepté par le jury d’examen constitué de :
M. PERRIER Michel, Ph. D., président
M. CHAOUKI Jamal, Ph. D., membre et directeur de recherche M. LATIFI Mohammad, Ph. D., membre
ACKNOWLEDGEMENTS
First, my highest appreciation is going to my supervisor, Prof. Jamal Chaouki, who at the first place put his trust on me and consistently allowed me to work freely, but steered me in the right direction whenever he thought I needed it.
The financial support provided by Total E&P, the industrial partner of this research chair and the Natural Sciences and Engineering Research Council of Canada (NSERC) is greatly appreciated. My sincerest gratitude goes to my dearest colleague, Dr. Jaber Shabanian who guided me through out every step of this work with his priceless experience and vast knowledge.
Special thanks to all my colleagues at PEARL research group, from whom I have learnt a lot during our precious group meetings and friendly discussions.
My deepest appreciation goes to the technicians in the Department of Chemical Engineering, particularly Robert Delisle and Sylvain Simard-Fleury for their excellent technical assistance. I would like to thank also my dear colleague, El Mahdi Lakhdissi, for the translation of the abstract to French.
Finally, I must express my very profound gratitude to my parents for providing me with unfailing support and continuous encouragement throughout my years of study and through the process of researching and writing this thesis. This accomplishment would not have been possible without them.
Thank you.
RÉSUMÉ
Le procédé de fluidisation est largement utilisé dans une multitude d’applications et de procédés chimiques et ceci grâce aux avantages qu’il procure tels qu’un traitement facile de la phase solide, une grande qualité de mélangeage des particules solides, un transfert de matière favorisé, une distribution uniforme de la température et une chute de pression réduite. Tous ces avantages rendent la fluidisation un grand concurrent aux réacteurs à lit fixe où tiennent lieu des procédés similaires. Cependant, l’hydrodynamique d’un tel système à hautes température n’est pas bien maitrisée et ceci dû à l’impact des niveaux élevés des forces inter particulaires (FIPs) dans des conditions extrêmes. En d’autres termes, la plupart des modèles et corrélations basées sur l’hydrodynamique et qui sont utilisées n’arrivent pas à prédire correctement les paramètres hydrodynamiques obtenus expérimentalement tels que la vitesse minimale de fluidisation Umf et la
vitesse du régime critique Uc car ces modèles et corrélations négligent le rôle des forces inter
particulaires à hautes températures. En d’autre part, la demande globale pousse les industriels à utiliser de plus en plus des matières premières de mauvaise qualité et qui ont une grande tendance à causer les phénomènes d’agglomération et de défluidisation à cause des niveaux élevés des forces inter particulaires. Ainsi, l’objectif de ce projet de recherche est d’introduire une nouvelle et simple méthode pour estimer les forces inter particulaires à hautes températures.
Comme première étape, nous avons mis le point sur l’effet de la viscosité et la densité de gaz sur l’hydrodynamique du lit comme Umf, le comportement des bulles et Uc quand le rôle des forces
inter particulaires à régir l’hydrodynamique du lit est perceptible. Ceci a été réalisé en mesurant Umf et Uc pour différentes températures allant de la température ambiante jusqu’à 650 ºC en utilisant
l’air et l’argon comme différentes phases gazeuses et le FCC, les billes de verre, et du sable siliceux grossier et fin comme différentes phases solides. Ces dernières ont différents points de fusion et appartiennent à Geldart A ou B en considérant leur tailles et masse volumiques. Nous avons démontré que pour le sable siliceux fin et grossier l’effet de la température sur les valeurs de Umf
et Uc et qui est liée directement à son effet direct sur les propriétés du gaz et le niveau des forces
hydrodynamiques FHDs peut être estimé correctement par les corrélations basées sur l’hydrodynamique. Cependant, nous avons trouvé que pour FCC et les billes de verre, les
corrélations hydrodynamiques n’arrivent pas à prédire correctement les valeurs de Umf et Uc
obtenues expérimentalement et ceci dû à l’effet significatif des forces inter particulaires. Nous avons aussi démontré que l’ordre de grandeur des forces inter particulaires peut être estimé en faisant la différence entre la valeur de la force de trainée calculée sur la base de Umf mesurée
expérimentalement et la valeur de la force de trainée obtenue pour Umf estimée par des
considérations purement hydrodynamiques pour une certaine température. Nous avons aussi validé notre estimation en mesurant la hauteur et l’aire sous le pic du graphe qui représente la chute de pression totale du lit en fonction de la vitesse superficielle du gaz pour les billes de verre et les particules FCC. Les résultats démontrent que les forces inter particulaires FIPs jouent un rôle plus important pour des particules qui ont un point de fusion plus bas en considérant la température de fonctionnement et cet effet peut être réduit en exerçant des forces hydrodynamiques plus élevées sur les particules, en l’occurrence, dans le cas de la fluidisation par l’argon.
Nous avons aussi expliqué la variation de Uc en fonction de la température en soulignant l’effet de
la température sur le comportement bouillonnant de lits de différents matériaux en considérant le ration FIPs/FHDs. Nous avons trouvé que la taille des bulles et la résistance de la phase d’émulsion à la rupture sont les paramètres principaux qui déterminent la vitesse de transition du gaz.
ABSTRACT
Fluidization process is being broadly used for numerous applications and chemical processes owing to the easy solids handling, high quality mixing of solids, promoted mass transfer, uniform temperature distribution and reduced pressure drop which makes it a promising competitor for similar processes using fixed bed reactors. However, the hydrodynamics of such a system at elevated temperatures is not well understood due to the impact of elevated levels of inter-particle forces (IPFs) at extreme conditions. In other words, most of the available hydrodynamic based models and correlations fail to predict the experimentally obtained hydrodynamic parameters such as Umf and Uc due to neglecting the important role of IPFs at high temperatures. On the other hand,
the global demand pushes the industries to increasingly use low quality feedstocks which have higher tendency toward agglomeration and defluidization because of an increased level of IPFs. Thus, in this research our focus is on introducing a new and simple method of estimation of IPFs at high temperature.
As a first step, we highlighted the influence of gas viscosity and density on the bed hydrodynamics such as Umf, bubble behavior and Uc when the role of IPFs in governing the bed hydrodynamics
was not discernible. We did so by measuring Umf and Uc at different temperatures from ambient
to 650 ºC using air and argon for FCC (86µm), glass beads (71µm), fine (226µm) and coarse silica sand (820µm) particles with different melting points belonging to Geldart group A and B considering their size and density. We showed that for coarse and fine silica sand particles the value of Umf and Uc change by temperature depending on its effect on the gas properties and the
magnuitude of HDFs and this trend can be well predicted by the hydrodynamic based correlations. However, we found that for glass beads and FCC particles the experimentally measured Umf and
Uc can not be well predicted by the hydrodynamic based correlations due to the significant effect
of IPFs. We also showed that by subtracting the values of drag force calculated at the experimentally measured Umf and the one obtained at predicted Umf by purely hydrodynamic
considerations we can estimate the magnitude of IPF that is present in the system at a certain temperature. We also validated our estimation by measuring the height and the area of the peak in the plot of total bed pressure drop against increasing superficial gas velocity for glass beads and
FCC particles. The results showed that IPFs plays a more important role for particles with lower melting point considering the operating temperature and this effect would be reduced when higher drag force is applied on the particles i.e. in the case of fluidization with argon.
We also explained the variation of Uc by temperature by explaining the effect of temperature on
the bubbling behaviour of beds of different materials considering the ratio of IPFs/HDFs. We found the bubble size and the resistance of the emulsion phase against break-up to be the main parameters to define the transition gas velocity.
TABLE OF CONTENTS
ACKNOWLEDGEMENTS ... III RÉSUMÉ ... IV ABSTRACT ... VI TABLE OF CONTENTS ... VIII LIST OF TABLES ... XI LIST OF FIGURES ...XII LIST OF SYMBOLS AND ABBREVIATIONS... XVII LIST OF APPENDICES ... XX
CHAPTER 1 INTRODUCTION ... 1
1.1 Problem Statement and Motivation ... 1
1.2 Objectives ... 3
CHAPTER 2 LITERATURE REVIEW ... 4
2.1 Basics of Fluidization ... 4
2.2 Application of High Temperature/Pressure Fluidized Bed (HTHP FB) ... 7
2.3 Hydrodynamic Forces (HDFs) ... 9
2.3.1 Drag Force ... 9
2.3.2 Buoyant Force ... 9
2.4 Inter-Particle Forces (IPFs) ... 10
2.4.1 Van der Waals ... 11
2.4.3 Material Bridge ... 12
2.4.4 Measurement of IPFs ... 14
2.5 Effect of Temperature on Hydrodynamic Parameters in a Fluidized-Bed with No/Negligible IPFs ... 17
2.6 Effect of Temperature on Hydrodynamic Parameters in a Fluidized-Bed in the Presence of IPFs ………...…...…………18
2.7 Hydrodynamic-Based Models and Correlations for Umf Prediction ... 21
CHAPTER 3 EXPERIMENTAL AND METHODOLOGY ... 25
3.1 Experimental Setup ... 25
3.2 Materials ... 30
3.3 Analysis Methods ... 32
3.3.1 Bed Pressure Drop ... 32
3.3.2 Standard Deviation ... 33
3.4 Experimental Procedure ... 33
CHAPTER 4 RESULTS AND DISCUSSION ... 35
4.1 Results and Discussion ... 35
4.1.1 Umf Measurements ... 35
4.1.2 Indirect Measurement of IPFs ... 49
CHAPTER 5 CONCLUSION AND RECOMMENDATIONS ... 58
5.1 Conclusion ... 58
5.2 Recommendations ... 59
APPENDIX A – EFFECT OF PRESSURE ON THE HYDRODYNAMICS OF GAS-SOLID FLUIDIZED BEDS ... 79 APPENDIX B – CORRELATIONS FOR BUBBLING TO TURBULENT TRANSITION VELOCITY (UC) ... 84
LIST OF TABLES
Table 2.1: Expected flowability of powders based on angle of repose [64] ... 15
Table 2.2: Powder classification based on HR [64] ... 15
Table 3.1: Solid materials used in the experiments ... 31
LIST OF FIGURES
Figure 2.1: Different fluidization regimes in a fluidized bed ... 5 Figure 2.2: Geldart classification of particles ... 6 Figure 2.3: Summary of more than 100 research done on the hydrodynamics of FBs at high pressure
and temperature ... 8 Figure 2.4: Liquid bridge formed between two identical particles. ... 12 Figure 2.5: Presentation of various IPFs along with the weight of the particle [33] ... 13 Figure 2.6: Dependance of Hausner Ratio (HR) for Al2O3 (3700 kg/m3) and TiO2 (4200 kg/m3)
powders using automatic tapping (HRa) and manual tapping (HRm). [63] ... 16 Figure 2.7: Variation of Umf by temperature for Geldart group D particles [77]. ... 18
Figure 2.8: Influence of pressure on Umf. ○-ballottini, d= 0.25 mm; ... 22
Figure 2.9: Effect of the dependence of Ɛmf on temperature on the estimation of Umf by
Carman-Kozeny equation. ― corrected Ɛmf, - - - ambient Ɛmf [15]. ... 23
Figure 2.10: Comparison between Umf obtained experimentally and by predictions from
Carman-Kozeny for different sizes of silica sand [15]. ... 24 Figure 3.1: High-temperature fluidized bed drawing. Bed and freeboard sections. ... 25 Figure 3.2: Filter design ... 26 Figure 3.3: Schematic drawing of the perforated distributor plate: (a) side view, (b) Top view, (c)
Bottom view ... 28 Figure 3.4: Pre-heating elements and heating jacket ... 28 Figure 3.5: Total bed pressure drop vs. superficial gas velocity plot in: (a) decreasing pass and (b)
increasing pass ... 33 Figure 4.1: Variation of total bed pressure drop in the decreasing superficial gas velocity pass at
Figure 4.2: Variation of minimum fluidization velocity of CS820 by the temperature compared to the prediction achieved by the Chitester et al.’s correlation [118]. ... 37 Figure 4.3: Variation of total bed pressure drop in the decreasing superficial gas velocity pass at
different temperatures for FS226 fluidized by Air at 1 < Ug < 5 cm/s. ... 38
Figure 4.4: Variation of total bed pressure drop in the decreasing superficial gas velocity pass at different temperatures for FS226 fluidized by Air at Ug > 5 cm/s. ... 38
Figure 4.5: Variation of minimum fluidization velocity of FS226 by temperature compared to the prediction achieved by theWen-Yu (W-Y) Eq. [119]. ... 39 Figure 4.6: Variation of total bed pressure drop in the increasing superficial gas velocity pass at
different temperatures for Cooked FCC86 fluidized by Air at 0.2 < Ug < 1 cm/s. ... 40
Figure 4.7: Variation of Minimum fluidization velocity of Cooked FCC86 by temperature compared to the predictions achieved by the Wen-Yu (W-Y) [119] and Carman-Kozeny (C-K) [121] correlation as well as the C-K correlation with a corrected value of Ɛmf by temperature
[15], [96]. ... 40 Figure 4.8: Condensation of water at the outlet of HTFB at temperatures higher than 500ºC causing
the particles to stick to the filter. ... 41 Figure 4.9: TGA results of Fresh and Cooked FCC86 ... 42 Figure 4.10: Variation of total bed pressure drop by increasing the superficial gas velocity at
different temperatures for GB71 fluidized by Air at 0 < Ug < 2 cm/s. ... 43 Figure 4.11: Variation of total bed pressure drop by increasing the superficial gas velocity at
different temperatures for GB71 fluidized by Air at Ug > 1 cm/s. ... 43 Figure 4.12: Variation of minimum fluidization velocity of GB71 by temperature fluidized with air
compared to Carman-Kozeny (C-K) [121] and C-K with corrected value of Ɛmf by temperature
Figure 4.13: Evolutions of in-bed and total bed pressure drops and the in-bed temperature readings (T4, T5, T6 and T7 respectively at 5, 12.5, 15 and 17.5 cm from the distributor plate) through a defluidization test for GB71 at Ug=1.1 cm/s. ... 45
Figure 4.14: Formation of hard agglomerates of GB71 after full defluidization at 500ºC. ... 46 Figure 4.15: Variations of the viscosities of Air and Argon (Ar) by temperature [81], [127]. ... 47 Figure 4.16: Variation of minimum fluidization velocity by temperature when fluidizing the
particles with Air and Ar in the decreasing pass for: (a) FS226, (b) FCC86 and (c) GB71. . 48 Figure 4.17 : Variation of minimum fluidization velocity of GB71 (●) by temperature fluidized
with (a) air and (b) argon compared to the predictions achieved by the C-K equation (- - -). ... 48 Figure 4.18: Variation of total bed pressure drop in the increasing superficial gas velocity pass at
different temperatures for GB71 fluidized by Ar at 0 < Ug < 1 cm/s. ... 49 Figure 4.19: Cubic stacking structure of particles with Nc = 6 ... 51
Figure 4.20: Individual IPFs value obtained for: (a) GB71 fluidized with Air, (b) FCC86 fluidized with Air, (c) GB71 fluidized with Argon and (d) FCC86 fluidized with Argon. ... 53 Figure 4.21: IPF/W value obtained for: (a) GB71 fluidized with Air, (b) FCC86 fluidized with Air,
(c) GB71 fluidized with Argon and (d) FCC86 fluidized with Argon. ... 54 Figure 4.22: Peak area evaluation as a qualitative estimation of IPFs. GB71 fluidized with air at
400 ºC. ... 55 Figure 4.23: The variation of normalized peak height and peak area in the plot of total bed pressure
drop against increasing gas velocity with temperature for: (a) GB71 fluidized with Air, (b) FCC86 fluidized with Air, (c) GB71 fluidized with Argon and (d) FCC86 fluidized with Argon. ... 56 Figure 4.24 : The variation of normalized peak area and IPFs/W with temperature for: (a) GB71
Figure 0.1: Variation of Umf with pressure for 0.7 mm sand particles ... 79
Figure 0.2: Variation of bubble size by pressure for 400 µm char particles fluidized by air [157]. ... 80 Figure 0.3: Summary of the effect of pressure and temperature on simple hydrodynamic parameters
of fluidization in the absence of IPFs ... 81 Figure 0.4: Summary of the effect of pressure and temperature on simple hydrodynamic parameters
of fluidization in the presence of IPFs for fine particles. ... 83 Figure 0.1: Variation of the standard deviation of gauge pressure signals by superficial gas velocity
for FS226 fluidized by Air at different temperatures. ... 86 Figure 0.2: Variation of Uc by temperature for FS226 fluidized by Air compared to the predicted
value by Chehbouni et al. [183]. ... 87 Figure 0.3: Variation of the standard deviation of gauge pressure signals by superficial gas velocity
for CS820 fluidized by Air at different temperatures. ... 88 Figure 0.4: Variation of the standard deviation of gauge pressure signals by superficial gas velocity
for FCC86 fluidized by Air at different temperatures. ... 89 Figure 0.5: Variation of Uc by temperature for FCC86 fluidized by Air compared to its value
estimated by Chehbouni et al. [183]. ... 90 Figure 0.6: Variation of the standard deviation of gauge pressure signals by superficial gas velocity
for FCC86 fluidized by Air at T > 350 ºC and Ug > Uc. ... 91
Figure 0.7: Variation of the standard deviation of gauge pressure signals by superficial gas velocity for GB71 fluidized by Air at different temperatures. ... 92 Figure 0.8: Variation of Uc by temperature for GB71 fluidized by Air compared to its value
estimated by Chehbouni et al. [183]. ... 92 Figure 0.9 : Variation of the standard deviation of gauge pressure signals by superficial gas velocity
Figure 0.10: Variation of Uc of: (a) FS226 (b) FCC86 and (c) GB71 by temperature for fluidization
with Air and Ar. ... 94 Figure 0.11: Variation of Uc by temperature for FCC86 fluidized by Air compared to its value
LIST OF SYMBOLS AND ABBREVIATIONS
Acronyms CS820 Coarse Sand (dp = 820 µm) FB Fluidized Bed FCC86 FCC (dp = 86 µm) FS226 Fine Sand (dp = 226 µm) GB71 Glass Beads (dp = 71 µm) HDF Hydrodynamic ForceHPHT High Pressure High Temperature HR Hausner Ratio
HTFB High Temperature Fluidized Bed IPF Inter-Particle Force
MSDS Material Safety Data Sheet PSD Power Spectral Density Symbols A Bed Section, (m2) Ar Archimedes Number, (-) Cd Drag Coefficient, (-) D Column Diameter, (m) dp Particle Size, (m)
Fb Buoyancy Force, (N)
Fc Capillary Force, (N)
Fd Total Drag Force, (N)
fd Single Particle Drag Force, (N)
FdƐ Total Drag Force Considering the Bed Voidage, (N)
Fvdw Van der Waals Force, (N)
g Gravitational Acceleration, (m/s2) H Bed Height, (m)
Hr Hardness of the softer particle, (N/m2)
hω Liftshits-Van der Waals Coefficient, (J) Nc Coordination Number, (-)
P Pressure, (Pa)
p̅ Mean Value of Pressure Data Points, (Pa) q Electric Charge, (C)
R Particle Radius, (m) Ras Radius of Asperity, (m)
Remf Reynolds Number at Umf, (m)
Rep Particle Reynolds Number, (-)
STD Standard Deviation of Pressure, (Pa) T Temperature, (ºC)
Uc Transition to turbulent, (m/s)
Ug Superficial Gas Velocity, (m/s)
Umf Minimum Fluidization Velocity, (m/s)
Utr Transition to Transport Regime Velocity, (m/s)
W Weight of the Particle, (N) Wb Buoyancy Weight, (N)
Z Working Distance of Van der Waals Force, (m) ΔP Pressure Drop, (Pa)
Greek Letters
µ Gas Viscosity, (Pa.s) Ɛ Bed Voidage, (-) Ɛmf Bed Voidage at Umf, (-)
γ Surface tension, (N/m) ϵ Permittivity, (F/m) θ Angle of Repose, (rad) ρf Fluid Density, (kg/m3)
ρfb Density of a Fluidized Bed, (kg/m3)
ρp Density of Particle, (kg/m3)
σ Standard Deviation, (-) τ Sintering Time, (s) φ Sphericity, (-)
LIST OF APPENDICES
Appendix A – Effect of Pressure on the Hydrodynamics of Gas-Solid Fluidized Beds ... 79 Appendix B – Correlations for Bubbling to Turbulent Transition Velocity (Uc) ... 84
CHAPTER 1
INTRODUCTION
1.1 Problem Statement and Motivation
Fluidized bed (FB) reactor are being used in a variety of applications in pharmaceutical, food, chemical, and petrochemical, due to their unique gas-solid mixing characteristics [1]–[3]. This feature provides FB reactors with enhanced mass and heat transfer quality [4]–[6]. In general, there are six well-known flow regimes i.e. fixed bed, homogeneous fluidization, bubbling, turbulent, circulating fluidization and pneumatic transport, each of which being separated by a certain gas velocity known as the minimum fluidization gas velocity (Umf), minimum bubbling gas velocity
(Umb), transition to turbulent gas velocities (Uc and Uk) and the transition to transport regime(Utr)
[7], [8]. Having a thorough vision of the value of these characteristic gas velocities leads us to a better understanding of the hydrodynamics of our FB system. For example, knowing the value of Umf provides us with an estimate of the amount of gas available in the emulsion phase according
to the two-phase theory which plays a great role in assessing the reaction performance of a catalytic FB reactor [9]. On the other side, Uc and Uk are important to avoid undesired solid loss due to a
maladjustment of operating gas velocity, mostly critical when expensive catalysts are involved or damage to the internal sections of the reactor such as cyclones and spargers [10]–[12]. Along with the gas velocity, gas properties also play an important role in defining the hydrodynamics of FB systems. Gas properties, namely gas density and viscosity, has a direct effect on the level of hydrodynamic forces (HDFs) exerted by the fluidizing gas on the solid particles [13]–[15]. Considering a system working at ambient conditions (pressure and temperature), it is simply the balance between HDFs that defines the fluidization state of the system. In more details when the drag force exerted by the fluidizing gas overcomes the weight of the solid particles it marks the start of fluidization or Umf [4], [16].
But not all the applications that we are dealing with in the industry is being held at ambient condition. Specifically speaking, processes such as FCC regeneration [1], [17], Coal combustion/gasification [18]–[21], polymerization [22]–[24] and mineral processing [25] happens at a considerably broad range of temperature up to 1700 °C and pressure up to 30 bars [26].
Changing the working pressure and temperature directly affects the gas properties which then also changes the level of HDFs working in the FB system. In a glance, the viscosity of fluidizing gas (µg) changes by Tn 0.6 <n< 1.0 and the density of the fluidizing gas (ρg) changes inversely by
temperature [27], [28].
In addition to the properties of the fluidizing gas, one should also consider the properties of the solid particles as they introduce another type of force, known as interparticle forces (IPFs), into the force balance along with the HDFs. These properties are also affected by the operating temperature. At high temperature and in the case of fluidization of fine particles or for the particles with low melting point compared to the temperature of the process, an increase in the level of IPFs can be observed. However, the change in the level of IPFs should be carefully analyzed by considering different types of IPFs and their dependance on temperature. In a nutshell, Van der Waals forces are mainly due to electrical charges on solid particles which will be decreased by increasing the temperature. On the other hand, IPFs sourced from the formation of liquid bridges and/or Higher contact surface due to the softening of low melting point solids could increase by temperature [29]– [36]. All the above-mentioned phenomena happening at the same time at extreme conditions makes it more and more complicated to predict the behavior of the FB system at extreme conditions. Investigation of the hydrodynamics of an FB system can be accomplished through different measurement techniques widely used by researchers. Monitoring the temperature, pressure [32], vibration [37] and electrostatic charges [38] all along with visual, X-ray radiography [39]–[41], radioactive particle tracking [32], [42]–[45] and optical fiber measurements give us a more and more clear picture of what happens in an FB system at different working conditions [46]. As a result, models and correlations are being proposed based on HDFs most of which fail to precisely predict the behavior of the FB system at an elevated temperature where IPFs also play and important role, depending on the type of particle in use which imposes the need for modification. This task is not possible unless we have an approach to measure the value of IPFs at different temperatures. The available measurement techniques such as shear cell and AFM techniques fail to well represent the real conditions in a fluidized bed as they are applied outside of a fluidized bed within a limited range of operating temperature. Moreover, qualitative methods such as Hausner
ratio and angle of repose measyrements can not quantify the value of IPFs and can not be used to develop correlations to predict the value of hydrodynamic parameters. Based on the mentioned problems and lack of knowledge we define the objectives of this work below.
1.2 Objectives
In this thesis, we review the models that are widely in use to investigate the behavior of gas-solid FB systems and compare them with the data obtained from our experiments at high temperature, using a variety of particles and fluidizing gases with different properties. As a result, the following objectives will be completed:
1. Measuring the simple hydordynamic parameters of fluidization ,Umf and Uc, at high
temperature
2. Evaluation of the precision of available hydrodynamic-based correlations to predict the behavior of an FB system using different solid particles and fluidizing gasses.
3. Indirect measurement of interparticle forces at high temperature
To achieve our aforementioned objectives we conduct a decent literature review on the effect of temperature in the presence and absence of IPFs in chapter 2. Chapter 3, presents the adopted methodology, experimental setup, and measurement techniques. Chapter 4 consists of a detailed presentation of results and our explanation. Finally, in Chapter 5 the conclusion of this work, as well as recommendations for future studies will be discussed. All references used are also listed at the end of Chapter 5.
CHAPTER 2
LITERATURE REVIEW
2.1 Basics of Fluidization
When a fluidizing gas suspends a fixed-bed of solid particles in a form that they act as a body of liquid, an FB system forms. For a better distribution of gas and to provide the initial energy for the gas to fluidize the solid particles, use of a distributor plate is mandatory [4], [16]. This liquid-like behavior of solid particles, which function as catalysts in most of the industrial applications, provides us with unique properties such as high gas-solid contact and high mass and heat transfer[16]. As the fluidizing gas passes through the bed, depending on the gas velocity and operating conditions, which directly affect the gas-solid and solid-solid interactions, different regimes take place in an FB system presented in Figure 2.1.
These regimes can be explained as follows:
Fixed-bed: This state is present in an FB system when the forces exerted by the fluidizing gas on the particles are not enough to overcome the resisting forces (Simply, the weight of the particles in the absence of IPFs). In this state, there is no mixing and temperature is also not uniformly distributed along the bed.
Particulate Fluidization: This is the state where the gas velocity is just enough to lift the particles. In another word, the forces exerted on the body of the particles can overcome their weight and the IPFs, if present and particles can move freely. The start of this state is marked by Umf and the
system is only consisted of emulsion phase.
Bubbling: By increasing the gas velocity in the case of fluidization of Geldart group A particles at the minimum bubbling velocity (Umb), the emulsion phase gets saturated and the excess amount of
gas appears in the system as bubbles. In this state, bubbles carry with them the bed material to the top of the bed, burst and particles fall again into the lower levels of the bed.
Turbulent regime: As the bubble size and velocity increases by superficial gas velocity through bubble coalescence, emulsion phase becomes diluted due to high level of entrainment and breaks up at the transition gas velocity, Uc. This is also accompanied by a higher rate of bubble break up
and a high intensity of gas-solid mixing which adds to the turbulency of the system. This regime is favorable in many applications such as FCC regeneration, due to its high gas-solid mixing, high gas hold-up, and uniformity of flow. It is note worthy that for beds with high H/D ratio as soon as the bubble size grows to the the diameter of the bed slug formation occurs which can be characterized by large fluctuations in bed pressure drop.
Fast fluidization and pneumatic transport: At very high gas velocities transition to fast fluidization occurs with high level of particle entrainment and annulus flow of gas. This regime is marked by Utr [4], [16].
Particulate Fluidization Bubbling Turbulent Regime Fast fluidization Pneumatic transport Figure 2.1: Different fluidization regimes in a fluidized bed
What can determine the occurrence of the above-mentioned regimes are gas velocity, gas and particle properties and the level of IPFs. A well-known classification of fluidizing particles from A to D has been done by Geldart based on the size and density of particles [47]. This classification is presented in Figure 2.2.
Figure 2.2: Geldart classification of particles
Geldart group C: Cohesive particles with very low flowability and high level of IPFs compared to their weight can be placed in this group. Bubbles do not appear in the fluidization of these particles. Instead, channel or slugg formation will occure by increasing the gas velocity. As a result, assisted fluidization methods should be applied to guarantee a uniform fluidization of these particles. Most of the particles smaller than 20 microns belong to this group.
Geldart group A: Most of the commercial catalysts belong to this group. These powders show a moderate level of IPFs depending on the working condition and the melting point of the particles. Also it is for this group of particles that dense phase expands after Umf and before Umb when bubble
start to form (Umb / Umf > 1). In the fluidization process of these partices, due to a constant bubble
coalescence and break up, bubbles grow to a maximum size and the fluidization quality is very smooth.
Geldart group B: The characteristic behavior of this group is that bubbles start to form as soon as the bed reaches to the fluidization state. In other word there is no dense phase expansion before the bubble formation set point. ( Umb / Umf = 1). In contrast to group A particles, bubble size can grow
Geldart group D: Large particles such as rice, nuts and vgetables in food industry are classified in this group. Large bubble formation makes the fluidization of these particles very poor with large pressure fluctuations. The fluidization of these particles is being carried out in spouted bed reactors. It should be expressed that by moving from Geldart group D towards C, the level of IPFs increases which, as mentioned before, affects the fluidization state as well as the hydrodynamics. Also an increased level of IPFs for any of these groups can change the fluidization behaviour and quality. For instance group A particles with an elevated level of IPFs can exhibit the characteristic behaviors of group C powders.
Knowing the above-mentioned basics of fluidization, it is time to do a more detailed explanation of effective factors in the fluidization process in the next section.
2.2 Application of High Temperature/Pressure Fluidized Bed (HTHP
FB)
Pressure and temperature are the most important parameters which can alter the behavior of an FB system. As a result of a growing market and an increasing need for a more efficient process, especially in biomass and energy section, nowadays there are less and less FB reactors working at ambient conditions.
The mining industry also benefits from FB reactors working at elevated pressures and temperatures. Specifically, in the gold refinery, application of high pressure and temperature oxidation eliminates fusion and formation of agglomerates [4].
Higher pressure not only reduces the size of the equipmnet in use by reducing the vlolume of the gas but also reduces the reaction time[48]. In the gasification process, it also eliminates some downstream steps such as compression units and also reduces the CO2 emission when
high-pressure boilers are put into action [49]. The temperature range of gasification process is set to be below the softening point of the coal particles, 950-1100 °C, and biomass, 800-950 °C[50]. In another example, comparing a low and high-pressure process in the production of methanol and ammonia shows higher coal consumption and lower power requirements in the compression unit.
In polyolefin production temperatures in the range of 40-120 °C is required which is relatively high considering the sintering/melting point of the feedstock (polyethylene). Pressures as high as 500 psig is also favorable to increase the heat transfer due to an increase in the unit volume heat capacity of the gas [23], [50].
In the production of Vinyl Chloride Monomer, the building block of PVC, is made through a thermal cracking process of ethylene dichloride in the presence of alumina-supported copper oxide catalysts which belongs to Geldart group A at 450–600 °C and 10–35 bar. To avoid agglomeration of the catalyst the temperature control is very essential [50].
Chemical looping for CO2 capture is highly in the center of attention due to the growing effect of
CO2 emission on global warming and environmental ctastrophies. A bubbling bed built in Instituto
de Carboquimica using alumina based copper oxide catalyste in the size range of 100-500 µm and working at 800 °C to avoid agglomeration of catalyst particles can achieve this goal with full conversion of the fuel to CO2 was obtained at CuO/Fuel molar flow ratios of higher than 1.4 [50].
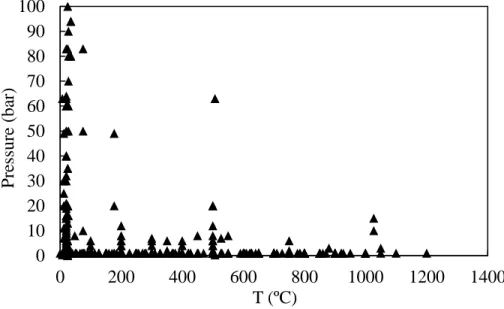
Figure 2.3: Summary of more than 100 research done on the hydrodynamics of FBs at high pressure and temperature
Although high pressure/temperature gas-solid fluidized beds are attracting more attention for industrial applications, there is limited understanding of bed hydrodynamics under extreme
0 10 20 30 40 50 60 70 80 90 100 0 200 400 600 800 1000 1200 1400 P re ssure (ba r) T (ºC)
conditions in the literature. A summary of more than hundred studies presented in Figure 2.3 shows that most of the work on high pressure/temperature FBs have either been conducted at low pressure and high temperature or at high pressure and low temperature.
2.3 Hydrodynamic Forces (HDFs)
To better understand the effect of operating conditions on the hydrodynamics of a gas-solid fluidized it is necessary to define different forces that is acting in such a system. Below you can find the definition of these forces along with their formulation.
2.3.1 Drag Force
The drag force exerted by the flowing gas on solid particles can be formulated as in Equation ( 1 )
𝐹𝑑 = 𝐶𝐷
𝜋𝑑𝑝2
4
𝜌𝑓𝑈𝑔2
2 ( 1 )
In this equation dp is the diameter of the fluidized particle, Ug is the superficial gas velocity of the
fluidizing gas and CD is the is the drag coefficient which is a function of Reynolds number.
𝑅𝑒𝑝 =
𝜌𝑓𝑈𝑔𝑑𝑝
𝜇 ( 2 )
where ρf and µ are the density and viscosity of the fluid, i.e., the fluidizing gas. Considering the
voidage of the bed, Ɛ, the drag force on a single particle can be calculated by Equation ( 3 ) [51], [52]. 𝐹𝑑𝜀= 𝐶𝐷𝜋𝑑𝑝 2 4 𝜌𝑓𝑈𝑔2 2 𝜀 −3.8 ( 3 )
2.3.2 Buoyant Force
It is observed that a fluidized bed of particles act as a body of liquid with a density formulated as in Equation ( 4 ) [53].
𝜌𝑓𝑏 = 𝜀𝜌𝑓+ (1 − 𝜀)𝜌𝑝 ( 4 ) with ρp being the density of the particle. The buoyant force exerted on the particles and the buoyant
weight can be calculated as in Equations ( 5 ) and ( 6 ) [54]. 𝐹𝑏= 𝜋𝑑𝑝 3 6 𝜌𝑓𝑏𝑔 = 𝜋𝑑𝑝3 6 (𝜌𝑓+ (1 − 𝜀)𝜌𝑝)𝑔 ( 5 ) 𝑊𝑏= 𝜋𝑑𝑝3 6 (𝜌𝑝− 𝜌𝑓)𝜀𝑔 ( 6 )
where, g is the gravitational constant.
By knowing the definition of different HDFs acting in a fluidized bed now we can have a global picture of the effect of pressure and temperature on the fluidization process. For Geldart group A where Rep << 1 the viscous effect becomes more dominant than the inertia effect and according to
the drag coefficient, 𝐶𝐷 = 24
𝑅𝑒𝑝, density of the gas is responsible for any change in the level of HDFs
[55]. Thus, the magnitude of the drag force increases by pressure and decreases by temperature. For Geldart group B drag force increases by pressure. While, increasing the temperature has a dual effect; temperature increases the gas viscosity while it has a decreasing effect on the gas density. So, the behavior of the bed in the presence of these particle is between group D and A particles with no IPFs [26]. The above-mentioned effects on the level of HDFs working in such systems affect the simple hydrodynamic parameters. A summary of the observed effects is presented in sections 2.5 and 2.6.
2.4 Inter-Particle Forces (IPFs)
There are different types of forces categorized as IPFs in the systems dealing with solid particles. Each type of these forces can be present or negligible in a certain working condition. In this section, we explain three type of IPFs known as Van der Waals, electrostatic and material bridge [33].
2.4.1 Van der Waals
Formation of dipoles due to orbiting electrons is responsible for Van der Waals forces leading to the nonideal behavior of gases. These dipoles change rapidly and form an electric field which also changes the polarity of a neighboring atom. The overall effect of this phenomena in the atomic scale can be transferred also to macroscopic scale, i.e., solid particles, resulting in attractive forces between them [56].
This type of attractive force can be formulated as Equation ( 7 ) [57], [58]:
𝐹𝑣𝑑𝑤 = ℎ𝜔 8𝜋𝑍2𝑅 (1 + ℎ𝜔 8𝜋2𝑍3𝐻 𝑟 ) ( 7 )
where ℎ𝜔 is the Liftshits-van der waals coefficient, which depends on the nature of the solid particles, and the contact medium and 𝐻𝑟 is the hardness of the softer particle (108 N/m2 for undeformable particles). Z is the distance where the Van der Waals force reaches to its maximum (usually 4 Å [57]) and R can be calculated as 𝑅1𝑅2
𝑅1+𝑅2 for two spherical particles with different radii R1 and R2. Considering the asperities of in-contact particles a value of Ras = 0.1 µm should be
considered in the evaluation of R [57], [58].
In a fluidized bed with solid particles smaller than 100 µm and in a condition that the moisture content is negligible, Van der Waals forces play an important role compared to other types of IPFs and even gravitational forces. This size range can be extended to even higher particle sizes in the presence of porous particles, deformable particles or the contact surface characteristics (contact area).
2.4.2 Electrostatic
Electrostatic forces are also present in the fluidized bed processing of nonconduction particles in a dry environment [57], [59], [60]. Charged particles in such systems can affect the flow properties in a gas-solid system. Coulomb’s law describes the force between two charged particles as in Equation ( 8 ):
𝐹𝑒 =
1 4𝜋𝜖
𝑞1𝑞2
𝑠2 ( 8 )
where q1 and q2 are the electric charges of the particles, s is the distance between the particles, and 𝜖 is the permittivity of the medium. This type of force has much smaller magnitude compared to the Van der Waals force and becomes negligible or zero in humid systems [60].
2.4.3 Material Bridge
2.4.3.1 Capillary or Liquid Bridge
When the moisture content of the fluidizing gas becomes condensed on the particles, a bridge of liquid will form in the small gap between the particles in contact as shown in Figure 2.4.
Figure 2.4: Liquid bridge formed between two identical particles.
This bridge due to the capillary effect in liquids exerts an attractive force on the particles keeping them from moving [58], [60], [61]. In a simplified method, the magnitude of capillary force can be calculated by Equation ( 9 ):
𝐹𝑐 = 2𝜋𝛾𝑅 ( 9 )
where 𝛾 is the surface tension of the bridged liquid and R is the particle radii. As before, asperities could be taken into consideration for a better approximation of this force.
To have a better picture of the importance of the IPFs in respect to the particle size the following schematic has been prepared by Seville et al. [33] for a particle with 0.1 µm asperities and density
of 3×10⁻³kg/m3
. We can see in Figure 2.5 that for a 100 µm particle, Van der Waals force is equal
to the weight of the particle and also when the capillary force is present its magnitude is higher than the Van der Waals force.
Figure 2.5: Presentation of various IPFs along with the weight of the particle [33] 2.4.3.2 Solid Bridge or Sintering
Another type of material bridge which forms due to diffusion in solid state or other mechanisms is referred to as sintering. This bridge grows with time according to Equation ( 10 ), in which x is the neck radii and τ is time and k is defined depending on the neck formation mechanism.
(𝑥 𝑅)
2 = 𝑘𝜏 ( 10 )
In a fluidized bed, a value of k can be calculated by Frenkel equation in Equation ( 11 ) for viscous sintering. This neck can be so strong to resist the high-intensity movement of solids in such a system and result in defluidization in a high-temperature process i.e. ash sintering in combustion, gasification and reduction of iron[33].
𝑘 = 3𝛾
2𝑅𝜇 ( 11 )
2.4.4 Measurement of IPFs
To date, different methods have been applied to evaluate the level and the importance of IPFs in systems dealing with solid particles such as Hausner Ratio and measurement of angle of repose [62]–[64], shear test [2], [65]–[67], Atomic Force Microscopy (AFM) approach [64], [66] and, torque measurement in fixed/fluidized bed of particles[67]–[69] none of which gives reliable and repeatable results or fail to fully represent the conditions in an FB.
Hakim et al. [64] classified cohesive properties of nanopowders by a classification system based on the measurement of repose angle and Hausner Ratio (HR) (Table 2.1 and
Table 2.2 ) with the HR being the ratio of the tapped bulk density to the loose bulk density. Loose bulk density is the density of the bulk body of loosely packed particles and tapped bulk density is referring to the bulk density after tapping the bed and settlement of the particles.
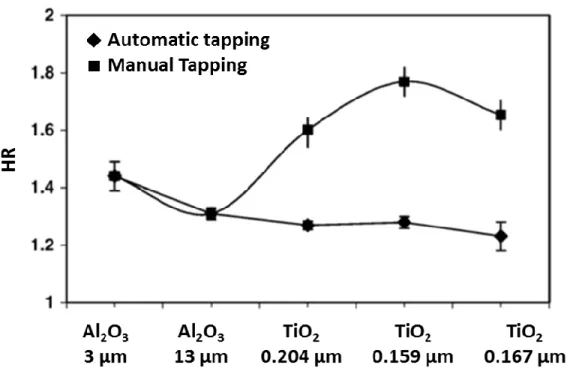
Fatah [63] Showed in his work that measurement of HR is highly dependant on the method used to tap the column of particles as presented in Figure 2.6 clearly expressing the uncertainty of this measurement technique which has also been approved by [70].
Table 2.1: Expected flowability of powders based on angle of repose [64] Angle of repose (θ) Expected flowability
55 < θ < 70 Very cohesive 45 < θ < 55 Cohesive 38 < θ < 45 Low flowability 30 < θ < 38 Medium flowability 25 < θ < 30 High flowability
Table 2.2: Powder classification based on HR [64] Hausner Ratio (HR) Geldart’s classification HR > 1.4 Type C powder
HR < 1.2 Type A powder
1.2 < HR < 1.4 May show the behavior of both Type A and Type C powders
Figure 2.6: Dependance of Hausner Ratio (HR) for Al2O3 (3700 kg/m3) and TiO2 (4200 kg/m3)
powders using automatic tapping (HRa) and manual tapping (HRm). [63]
Rasteh et al. [71] did a thorough joint study of the level of interparticle forces measured by AFM technique and hydrodynamic study of tapered fluidization. They showed that the smaller the particles, the higher the level of inter-particle forces will be. They also put an stress on the importance of IPFs for smaller particles.
However, this study has been done at ambient temperature due to limitations of AFM technique. Bruni et al. [67], [68] used a novel technique by coupling torque measurement and pressure measurement in a fluidized bed testing particles with different fines content. However, this intrusive method breaks up the solid structure formed because of IPFs and is not a good representative of the real fluidization process.
2.5 Effect of Temperature on Hydrodynamic Parameters in a
Fluidized-Bed with No/Negligible IPFs
In an FB system held at dry and ambient conditions consisting of Geldart Group B/D powders the ratio of IPFs/HDFs is negligible or zero. It is worth mentioning that large particles processed at high temperatures considering their melting point are not of the interest of this study and will not be discussed in this section.
In such system, the level of HDFs is more dominant compared to the IPFs. This means that one can easily predict the behavior of the bed according to the available hydrodynamic-based models considering the variation of gas properties by pressure and temperature [72]. These effects have been discussed in details in the following sections.
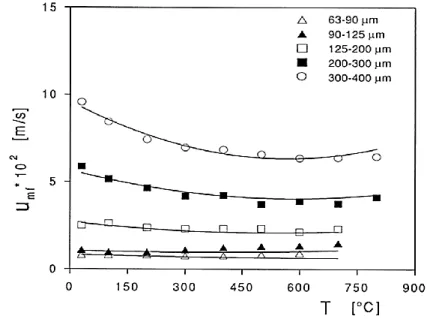
The effect of temperature in systems with no considerable ratio of IPFs/HDFs, i.e., Geldart group B and D, the dependence of Umf is based on the size of the particles. For group D particles Umf
increases by temperature due to a decrease in the density of the fluidizing gas [73]–[77] while, for smaller particles close to group B/D boundary it becomes independent of temperature as the flow regime is also at the border of viscous/inertia regime [15], [78], [79].
Figure 2.7: Variation of Umf by temperature for Geldart group D particles [77].
For the latter case by increasing the operating pressure, flow regime shifts towards the dominance of the inertia effect and as a consequence, Umf increases by temperature [80]. For lower Reynolds
numbers, i.e., small Group B particles, the dominance of the viscous flow regime results in a decrease of Umf by temperature as the viscosity of the gas increases [15], [73]–[75], [79]–[83]. As
drag force decreases with temperature in the case of using group D or very coarse group B particles, indentation formation on the roof of the bubbles enhances so that bubble break-up increases. This mechanism leads to a decreasing trend for the bubble size by increasing the temperature [84], [85]. Low energy bubbles, due to a lower gas density at high temperature, and higher rates of bubble break-up reduces the mixing quality and delays the transition to the turbulent regime [86]–[88].
2.6 Effect of Temperature on Hydrodynamic Parameters in a
Fluidized-Bed in the Presence of IPFs
As described in 2.4 IPFs are present in systems dealing with solid particles. The level of electrostatic IPFs can change at extreme conditions as conductivity increases [89]–[92]. However, temperature increases Van der Waals forces by increasing the dipole pulsation at the contact point
[57], [93]. Formation of solid-solid material bridge also increases due to softening of particles and also higher diffusion rate in the solid-state [1], [94], [95]. But the effectiveness of these forces depends solely on the magnitude of the ratio between IPFs and HDFs; For systems consisting of particles from group C, A and even coarser particles with specific characteristics, i.e., low melting/sintering point or soft particles, the magnitude of IPFs becomes so pronounced compared to HDFs that they cannot be neglected anymore [33], [36]. However, available models to predict the hydrodynamic behavior of the bed are not considering the effect of IPFs especially when it comes to extreme conditions, e.g., high temperature. Thus, most of the models fail to reproduce the experimental data obtained in such conditions as they only consider the modification of gas properties in extreme conditions and not the solid properties.
At high temperature effect of IPFs is present even before the fluidization state. An increase in the bed voidage in complete fixed-bed state Ɛ0 and just before fluidization Ɛmf has been observed in
many cases [36], [44], [96]–[99]. It was also reported that for such systems with moderate levels of IPFs, Umf can be delayed to higher values [15], [17], [67], [100], [101] and bubble-free
fluidization can be extended for Group B particles [98], [102]–[107]. This change of behavior from group B to group A or even C was reported repeatedly in the literature [17], [36], [98], [104], [105], [107] at a constant gas velocity. High degree IPFs also result in a more viscous emulsion phase which can hinder bubble growth and also bubble rise velocity. As a result, experiments which have been done at this condition usually report smaller bubble size, higher bed expansion, and bed voidage [36], [44], [86], [97], [108], [109]. Increasing the level of IPFs decreases the frequency of bubble movements in the bed, and hence, the rate of bubble break-up. [84], Uc is also delayed until higher gas velocities and entrainment is controlled [26]. On the other hand at the high level of IPFs, the formation of previously mentioned indentations decreases and bubbles grow larger. It was also observed that the bubble behavior of beds affected by IPFs can be different at moderate and high gas velocities so that at moderate gas velocities above Umb bubble size is lower compared to
systems unaffected by IPFs and at high gas velocity well-above Umb and close to Uc bubbles are
In this section, we will report different hydrodynamic observations in FB systems in which IPFs should be considered to clearly show the contradictory which is basically based on ignoring or underestimating the level of IPFs at extreme conditions.
The effect of temperature if it does not affect the level of IPFs has been explained in 2.5 for coarse particles where inertia flow regime is mainly dominant. However, when fine particles are in use and the level of IPFs is not negligible, the effect of temperature can be described using the magnitude of the ratio of IPFs/HDFs. In this case, an increase in temperature also increases the level of Van der Waals and solid-solid bridge IPFs [15], [96], [109]–[114].
From the hydrodynamic point of view, by increasing the operating temperature viscosity of the gas increases by Tn 0.6<n<1.0. Knowing that for fine particles the viscous regime is dominant, the magnitude of drag force increases due to an increase in the gas viscosity. It can be concluded that Umf decreases by this change. Temperature also increases the bed voidage in the fixed bed and
minimum fluidization state due to the reduced flowability and change in the packing behaviour of particles as a consequence of increased IPFs [15], [102], [110], [114], [115]. In other words, in the absence of IPFs particles can slip on each other and reach to a more packed state compared to the case in which high level of IPFs reduce the mobility of particles. Bubbling regime was also found to be affected by temperature so that the bubble size/frequency increases by temperature [116]. This was explained by a lower formation of indentations on the roof of the bubbles and a reduced bubble break-up which leads to a decreased Uc [116], [117].
Some literature did not only consider the variation in gas viscosity and the drag force but also the modification required due to an enhanced level of IPFs to explain the behavior of the bed [109]. When the temperature goes higher than a certain value the effect on the magnitude of the IPFs is higher than its effect on the gas viscosity. In this case, the hydrodynamics of the bed cannot be well determined by the variation of HDFs.
2.7 Hydrodynamic-Based Models and Correlations for U
mfPrediction
As previously mentioned the effect of pressure and temperature on the fluidization properties cannot be determined without considering the particle size. It is because of the particle size and of course the gas velocity that we can distinguish between inertia and viscous flow regimes to determine if the gas viscosity is important or the gas density. It is also the particle size that can dramatically affect the ratio of IPFs/HDFs at different operating conditions. This is also the case when it comes to using the proper correlations to predict the hydrodynamic parameters of fluidization, namely Umf and Uc, so that, for every group of particles and ranges of operation a
certain number of correlations become handy and the other ones are over/under predicting the parameter in question. In this section, we covered the most useful correlations and models for the prediction of Umf.
Chitester et al. [118]: For coarse particles, the following modification of Eregun’s equation can be used.
𝑅𝑒𝑚𝑓 = √(28.7)2+ 0.0494 𝐴𝑟 − 28.7 ( 12 )
Wen - Yu [119]: The correlation proposed by Wen and Yu is widely used to predict Umf and
different working conditions. However, this correlation under predicts this parameter at high temperature since they did not consider the augmented level of IPFs at high temperature. At this state gas, velocity should be increased to maintain the fluidization state [94].
The general form of this correlation is presented in Equation ( 13 ). 𝐴𝑟 = 1650𝑅𝑒𝑝,𝑚𝑓+ 24.5(𝑅𝑒𝑝,𝑚𝑓)
2
( 13 ) For small particles (Rep,mf < 20), we can simplify this correlation as in Equation ( 14 ).
𝑈𝑚𝑓= 𝑑𝑝
2(𝜌
𝑝− 𝜌𝑔)𝑔
1650𝜇𝑔 ( 14 )
For this range of particles, Umf decreases by temperature and is unaffected by pressure. For large
particles (Rep,mf >1000), we can rewrite Equation ( 13 ) as Equation ( 15 ).
𝑈𝑚𝑓2 = 𝑑𝑝(𝜌𝑝− 𝜌𝑔)𝑔 24.5𝜌𝑔
( 15 )
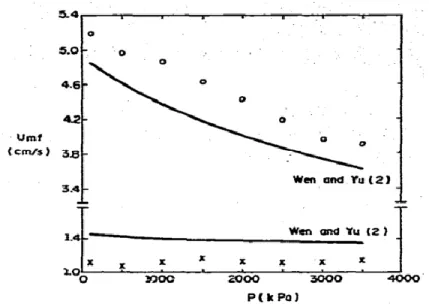
The only term that is affected by temperature and pressure for this range of particles is the gas density. Sobreiro et al. [120] tested the validity of this equation by comparing their experimental results with the value obtained from Wen-Yu presented in Figure 2.8.
Figure 2.8: Influence of pressure on Umf. ○-ballottini, d= 0.25 mm;
x-alumina,d= 0.125mm [120]
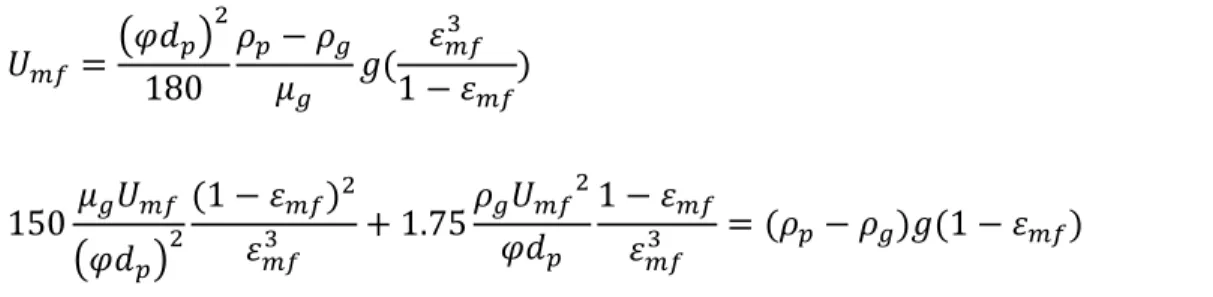
Carman – Kozeny [121], [122]: This correlation (Equation ( 16 ) ) along with the Ergun equation (Equation ( 17 ) ) is being used in the case of large particles i.e. Geldart group B and D.
𝑈𝑚𝑓= (𝜑𝑑𝑝) 2 180 𝜌𝑝− 𝜌𝑔 𝜇𝑔 𝑔( 𝜀𝑚𝑓 3 1 − 𝜀𝑚𝑓 ) ( 16 ) 150𝜇𝑔𝑈𝑚𝑓 (𝜑𝑑𝑝)2 (1 − 𝜀𝑚𝑓)2 𝜀𝑚𝑓3 + 1.75 𝜌𝑔𝑈𝑚𝑓2 𝜑𝑑𝑝 1 − 𝜀𝑚𝑓 𝜀𝑚𝑓3 = (𝜌𝑝− 𝜌𝑔)𝑔(1 − 𝜀𝑚𝑓) ( 17 )
In these equations, ϕ is the shape factor or sphericity of the particles and Ɛmf is the bed voidage
which is a function of temperature. If the bed voidage is considered unaffected by temperature, there will be a considerable underestimation of Umf at high temperature as shown by Formisani et
al. [15] in Figure 2.9.
Figure 2.9: Effect of the dependence of Ɛmf on temperature on the estimation of Umf by
Formisani et al. [15] tested the validity of this equation by comparing their experimental results with the value obtained from Carman-Kozeny equation with a corrected value of Ɛmf by temperature
presented in Figure 2.10.
Figure 2.10: Comparison between Umf obtained experimentally and by predictions from
Carman-Kozeny for different sizes of silica sand [15].
An elaborated list of other models and correlations is presented by Wu and Baeyens [28], Lin et al. [123] and Jiliang et al.[124] however, they are valid in a limited range of operating conditions and for a certain range of particle size.
CHAPTER 3
EXPERIMENTAL AND METHODOLOGY
3.1 Experimental Setup
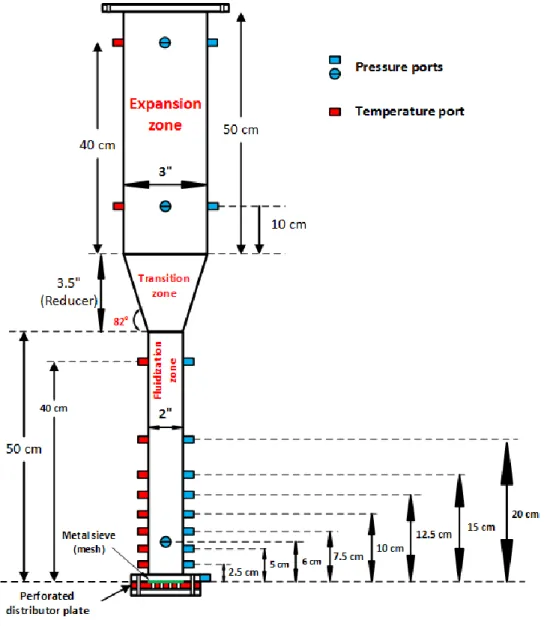
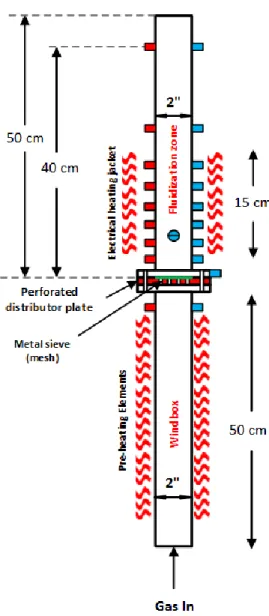
The hydrodynamic study was attempted at ambient pressure in a high-temperature fluidized bed (HTFB) capable of operating at temperatures as high as 800 ºC with a total height of 105 cm and an internal diameter of 5.25 cm (2 inches) for the fluidization section as shown in Figure 3.1.
At the outlet, we mounted a perforated steel pipe which was covered with glass wool to keep the particles from leaving the reactor at high gas velocity. To decrease the pressure drop caused by the filter we increased the filtering surface by choosing a 65 cm perforated steel pipe with an external diameter of 3.81 cm (1.5 inches) presented in Figure 3.2.
Figure 3.2: Filter design
The distributor plate was made out of a 0.635 cm (1/4 inch) thick aluminum plate with 19 holes with a large hole diameter of 3.175 mm on the top side and a smaller hole diameter of 0.5 mm on
the bottom side to simultaneously provide the high-pressure drop needed to uniformly fluidize the particles and diminish the chance of formation of long high velocity jets at the distributor plate (Figure 3.3). To avoid weepage of particles into the wind-box we also placed a 20 µm metal mesh on top of the distributor plate. We also filled the wind box (50 cm height and 5.25 cm diameter) with 5-10 mm sand particles to provide enough residence time for the passing gas to be adequately heated by the electrical heater.
(a)
(b)
Figure 3.3: Schematic drawing of the perforated distributor plate: (a) side view, (b) Top view, (c) Bottom view
Figure 3.4: Pre-heating elements and heating jacket
We heated up the fluidizing gas by a pre-heating electrical furnace (LINDBERG, 54332, 2070watts, Tmax=1200ºC) before entering the fluidized bed. We set the temperature of this section
according to the desired temperature set point of each experiment with the help of a 16 bit A/D data acquisition board using the LabVIEW v.12 program. The temperature of the pre-heating zone
was based on the readings from an OMEGA, type K thermocouple located at the bottom of the distributor plate. For a better temperature control, we also placed two electrical heating jackets (OMEGA, CRWS-123/120-A, 850 watts, Tmax=1000ºC) around the fluidization zone. The heating
power of these heating jackets was adjusted considering the readings of an OMEGA type K thermocouple located at 6 cm above the distributor plate. Also 6 OMEGA type K thermocouples were recording the temperature of the bed at 2.5, 5, 7.5, 10, 40 and 63.5 cm above the distributor plate during the experiments.
We controlled the gas flow by four calibrated rotameters to cover a wide range of gas velocities in the bed with different precision (0.0001 – 0.578 m/s at 25 ºC). The input flow control system can switch between air and argon as the fluidizing agent.
At each experimental temperature, we adjusted the gas velocity in increasing and decreasing passes with the purpose of hydrodynamic study through the global and local measurements of pressure signals. To do so, we used two differential pressure transducers, one gauge, and one absolute pressure transducer installed at different pressure measurement taps of the HTFB with the following orientation. We used a differential pressure transducer (JUMO, 404304/000-414-415-28-298, 0-100 mbar) to approximately measure the total bed pressure drop with the high and low-pressure ports installed respectively at 7 mm and 97.8 cm above the distributor plate. Also, another differential pressure transducer (JUMO, 404304/000-412-415-28-298, 0-50 mbar) with the high and low pressure ports was installed respectively at 6.3 and 12.5 cm above the distributor plate to measure the in-bed pressure fluctuations. The readings from this pressure transducer give us the ability to monitor the pressure fluctuations in the bed between the two ports of this device [125] considering a bed height of 15 cm. We installed a gauge pressure transducer (OMEGA, PX309-002G5V, 0-2 Psig) and an absolute pressure transducer (OMEGA, PX309-100A5V, 0-100 Pisa) installed respectively at 9.3 cm above and 3.3 cm below the distributor plate to monitor pressure signals in the dense bed and wind-box. Using an in-bed gauge pressure transducer monitors every pressure fluctuation that occurs within the bed [125] we used it to get the global picture of what is happening inside the bed. We set the sampling frequency of the pressure signal measurements at 400 Hz and we recorded the data used for Umf measurements for 1 minute and 2 minutes for the Uc
measurements with the help of a 16 bit A/D data acquisition board using the LabVIEW v.12 program.
3.2 Materials
In this research, we studied the fluidization behavior of different powders by the application of different fluidizing gas listed in
Table 3.1 and Table 3.2. We used different powders from Geldart group A , A/B, B and B/D with high and low melting points to investigate the effect of temperature on the hydrodynamic behavior of the bed and its effect on the level of IPFs.
We also used two different types of gas, air and argon, with different viscosity to see the effect of different level of HDFs, namely drag force, on the fluidization behavior and its impact on the importance of IPFs.
All the materials depending on their melting point and observations that we had were tested at ambient, 150, 250, 350, 450, 550 and 650 ºC at ambient pressure by the application of Air and Ar. A bed height equal to 15 cm has been fed into the reactor at each experiment.
We measured the loose bulk density (ρb,loose) and the tapped bulk density (ρb,tapped) of the particles
Table 3.1: Solid materials used in the experiments
Material Code Geldart
Classification ρp (kg/m3) dp (µm) ρb,loose (kg/m3) ρb,tapped (kg/m3) Tm1 (ºC) Fine Sand FS226 B 2656 226 1383 1503 ~1700 Coarse Sand CS820 B/D 2650 820 1313 1423 ~1700 Glass Beads GB71 A 2485 71 1405 1530 ~700 FCC2 FCC86 A 1460 86 820 900 > 900 Alumina
(Smelter Grade) SGA72 A 1875 72 1000 1155 ~2000
1From MSDS.
2 Cooked FCC particles, explained in 4.1.1 in more details.
Table 3.2: Fluidizing gases used in the experiments
Material Code ρg @ 20 ºC (kg/m3) µg @ 20 ºC ×10-5 (Pa.s) Air Air 1.20 1.81 Argon Ar 1.66 2.22
Density and viscosity of Air and Ar calculated according to Equations ( 18 ) - ( 21 ) [126], [127] 𝜇𝐴𝑖𝑟 = 1.46 ∗ 10−6 𝑇 1.504 (𝑇 + 120) ( 18 ) 𝜌𝐴𝑖𝑟 = 1.2 (293 𝑇 ) ( 19 ) 𝜇𝐴𝑟 = 44.997 + 0.63892 𝑇 − 0.00012455 𝑇2 ( 20 ) 𝜌𝐴𝑟 = 𝑃𝑀𝑀𝐴𝑟 𝑅𝑇 ( 21 )
3.3 Analysis Methods
As in this series of experiments we were using an opaque system we were not able to obtain any results by visual observations. Analysis of pressure fluctuations can provide information on different hydrodynamic phenomenon happening inside the fluidized bed if we use a high enough sampling frequency. This information, include the bubbling behavior i.e. bubble break-up and coalescence, and mixing characteristics of the solid particles [46], [128]–[132]. To remove the effect of gas flow fluctuations on the analysis data we subtracted the moving average with 0.2 Hz from the recorded data.
3.3.1 Bed Pressure Drop
The simple plot of the variation of the total bed pressure drop versus decreasing gas velocity was used for the determination of Umf as in Figure 3.5 (a). Also, the simple plot of the variation of the
total bed pressure drop versus increasing gas velocity can be used for the evaluation of the level of IPFs for group A particles since it is for this group of particles that an overshoot of the value of the total bed pressure drop at Umf indicates the extent of IPFs in the bed [33], [36] as in Figure 3.5 (b).
Figure 3.5: Total bed pressure drop vs. superficial gas velocity plot in: (a) decreasing pass and (b) increasing pass
3.3.2 Standard Deviation
Standard deviation is the most common mode of evaluation of pressure signals in the time domain. The standard deviation of a series of pressure data points pi can be calculated by Equation ( 22 ).
𝜎 = √ 1 𝑁 − 1∑(𝑝𝑖− 𝑝̅) 2 𝑁 𝑖=1 ( 22 )
In this equation N is the number of data points and p̅ is the mean value of pressure data points[133]. The value of standard deviation (STD) has direct relation with the mean bubble size leading us also to the determination of the turbulent transition velocity Uc [36], [134]–[138].
3.4 Experimental Procedure
To start each experiment, we calculated the exact amount of solid particles to have 15 cm of bed height based on the loose bulk density of powders presented in Table 3.1. Then, we were pouring the bed material into HTFB at a minimum gas velocity only to avoid weepage of particles into the wind-box. T otal be d pre ssure drop Ug Umf T otal be d pre ssure drop Ug Umf
We had to adjust the temperature separately in the wind-box and bed section. We were choosing the preheating temperature 100 ⁰C above the desired operating temperature and the temperature of the bed section based on the average temperature along the bed. All the calculations of gas velocity were also based on this value. For each operating temperature, the bed was kept in the fluidized state for 2-3 hours for the reactor to reach to the set point temperature before starting the measurements. We recorded the pressure signals in both increasing and decreasing passes for several Ug points.
After every experiment, we removed the filter and particles and refilled the required amount of particles to make sure that we have an equal amount of bed material in every set of experiment.
![Figure 2.5: Presentation of various IPFs along with the weight of the particle [33] 2.4.3.2 Solid Bridge or Sintering](https://thumb-eu.123doks.com/thumbv2/123doknet/2329675.31382/33.918.260.656.237.780/figure-presentation-various-weight-particle-solid-bridge-sintering.webp)
![Figure 2.7: Variation of U mf by temperature for Geldart group D particles [77].](https://thumb-eu.123doks.com/thumbv2/123doknet/2329675.31382/38.918.205.708.135.494/figure-variation-u-mf-temperature-geldart-group-particles.webp)