Contents lists available atScienceDirect
Physica B
journal homepage:www.elsevier.com/locate/physb
Structural, elastic and lattice dynamical properties of the alkali metal
tellurides: First-principles study
Z. Souadia
a, A. Bouhemadou
a,⁎, R. Khenata
b, Y. Al-Douri
c,daLaboratory for Developing New Materials and their Characterization, Department of Physics, Faculty of Science, University of Setif 1, Setif 19000, Algeria bLaboratoire de Physique Quantique et de Modélisation Mathématique (LPQ3M), Département de Technologie, Université de Mascara, 29000 Mascara,
Algeria
cNanotechnology and Catalysis Research Center (NANOCAT), University of Malaya, 50603 Kuala Lumpur, Malaysia dPhysics Department, Faculty of Science, University of Sidi-Bel-Abbes, 22000, Algeria
A R T I C L E I N F O
Keywords: Alkali metal tellurides First-principles calculation Elastic constants Phonon dispersions Dielectric properties
A B S T R A C T
We report a detailedfirst-principles density functional calculations to understand the systematic trends for crystal structure, elastic and lattice dynamical properties of the anti-fluorite alkali metal tellurides M2Te depending from the type of the M cations (M are Li, Na, K and Rb). The calculated equilibrium lattice parameters are in very good agreement with the available experimental data. Single-crystal and polycrystalline elastic moduli and their related properties of the title compounds were calculated via the stress-strain method. The relatively weak values of the calculated elastic moduli demonstrate the weak resistance of these compounds to applied external forces. Phonon dispersion curves throughout the Brillouin zone and corresponding density of states were calculated using the linear response approach. No imaginary phonon modes were found, which indicate the dynamical stability of the examined materials. The atomic displacements at Γ point were determined. Low-frequency dielectric properties and infrared response were investigated.
1. Introduction
The alkali metal chalcogenides M2Ch [M: Li, Na, K and Rb; Ch: O,
S, Se and Te], which crystallize in the face-centered cubic antifluorite (anti-CaF2-type) structure at ambient conditions [1], possess some
interesting physical properties, such as high-temperature properties, fast ionic conduction and wide band gap [2–17]. Owing to these aforementioned properties, the M2Ch materials are potential
candi-dates for several interesting technological applications, such as solid-state batteries[18–20], fuel cells, solid-state gas detectors[21,22]and photo-emissive ultraviolet light materials[23–25]. Among these inter-esting family members, the alkali metal telluride M2Te series [M: Li,
Na, K and Rb]– the considered compounds – have been the subject of numerous theoretical studies exploring some of their fundamental physical properties. Kikuchiy and co-workers [13] carried out first-principles density-functional calculations on the electronic properties of Li2Te, Na2Te and K2Te using the full-potential linearized
augmen-ted-plane-wave (FP-LAPW) method. Seifert-Lorentz and Hafner [26] investigated the structural and electronic properties of K2Te employing
a first-principles pseudopotential plane wave (PP-PW) approach. Eithiraj et al.[4]studied the electronic structure of Li2Te, Na2Te and
K2Te using the tight-binding linear muffin-tin orbitals (TB-LMTO)
method. Kalarasse and Bennecer[9]explored the elastic properties and lattice dynamics of Na2Te using the PP-PW method. Alay-E-Abbas and
co-workers[2,12]studied the structural, electronic and optical proper-ties of the M2Te [M: Li, Na, K, Rb] series using the FP-LAPW method.
Zhang and co-workers[5] investigated the lattice dynamic, thermo-dynamic and elastic properties of Na2Te using the PP-PW approach.
Bahloul and co-workers [7] studied the structural, electronic and elastic properties of Li2Te employing the PP-PW approach. Zhang
and Shi[10] investigated the lattice dynamics, thermodynamics and elastic properties of Li2Te through the PP-PW formalism. In spite of
these numerous already performed theoretical studies on the alkali metal tellurides M2Te [M: Li, Na, K, Rb], one can note that a lack of
information on some of their physical properties still exists up to now. On one hand, as far as we know, there are no theoretical or experimental investigations of the lattice dynamical, elastic and thermodynamic properties of the K2Te and Rb2Te systems. On the
other hand, no study was performed to investigate the systematic trends for the structural, elastic, lattice dynamical and thermodynamic properties of the M2Te family depending from the type of M elements
(M are Li, Na, K and Rb). Recently,first-principles investigations of the lattice dynamical and thermodynamic properties of materials have provided some quite satisfactory results [27–33]. In view of these
http://dx.doi.org/10.1016/j.physb.2017.07.004 Received 14 June 2017; Accepted 4 July 2017
⁎Corresponding author.
E-mail addresses:[email protected],[email protected](A. Bouhemadou).
Available online 04 July 2017
0921-4526/ © 2017 Elsevier B.V. All rights reserved.
circumstances, in the present paper a systematicfirst-principles study of the structural, elastic and lattice dynamical properties for the M2Te
[M: Li, Na, K and Rb] series was performed using the pseudopotential plane wave method within the generalized gradient approximation.
2. Computational details
All our first-principles calculations were performed within the framework of the density functional theory (DFT) and density func-tional perturbation theory (DFPT) using the pseudopotential plane-wave (PP-PW) method as implemented in the CASTEP (Cambridge Total Energy Package) code[33]. The electronic exchange and correla-tion potentials were described using the generalized gradient approx-imation GGA-PBEsol[34](it is termed also GGA08), which has been specially developed to improve the description of the exchange-correlation potential in solids. Norm-conserving pseudopotentials [33] were used to describe the interaction potential between the valence electrons and the nucleus and frozen electrons. A plane-wave basis set cut-off of 800 eV and a 15 × 15 × 15 Monkhorst–Pack scheme k-points grid[35]for the integration over the Brillouin zone (BZ) were applied to ensure sufficiently accurate total energy calculations. The optimized lattice parameters were calculated by using the Broyden˗Fletcher˗Goldfarb˗Shanno (BFGS) minimization algorithm [36]. The optimized geometry was performed with the following convergence criteria: (i) the total energy difference between two consecutive iterations were smaller than 5.0 × 10⁻⁶eV/atom and (ii) the stress was smaller than 0.02 GPa. The single-crystal elastic constants Cijs were determined from first-principles calculations by
applying a set of given homogeneous deformations with afinite value ε and calculating the resulting stress with respect to optimizing the internal atomic freedoms. The Cijs were obtained via linearfittings of
the stress-strain curves computed from accurate ab initio calculations [33]; the elastic stiffness tensor is related to the stress tensor and the strain tensor by Hooke's law. To determine the three independent elastic constants Cijs of a cubic system, namely C11, C44and C12, one
strain pattern with nonzeroε11andε23was used. The maximum strain
amplitude was set at 0.003. The lattice vibrational properties, namely the phonon dispersion curves, density of phonon states, dielectric tensors and thermodynamic properties were calculated using the linear response method within the density functional perturbation theory (DFPT)[37]. The dielectric tensor and the longitudinal-optical/trans-verse-optical (LO-TO) splitting are used to calculate the frequency-dependent optical properties in the infrared region (low-frequency region). The phonon frequencies were computed on a 10 × 10 × 10 q-points mesh in the BZ.
3. Results and discussion
3.1. Structural properties
At ambient conditions, the M2Te [M: Li, Na, K, Rb] compounds
crystallize in the anti-CaF2-type structure, space groupFm3m(no. 225),
with four formula units (Z = 4) per unit-cell[1].Fig. 1depicts one unit-cell of the K2Te compound as a representative of the M2Te (M: Li, Na,
K, Rb) series. The Te atom occupy the Wyckoff position 4a (0, 0, 0); the corner and face-centered positions, and the alkali metal atom M are located at the Wyckoff position 8c (0.25, 0.25, 0.25), filling the octahedral holes. Therefore, each Te atom is surrounded by eight M atoms and each M atom is attached to four Te atoms as it is shown in Fig. 1 by polyhedrons. Before performing calculations to obtain the elastic constants and lattice vibrational properties of the considered compounds, their equilibrium lattice parameters (a0) were determined
using the above-mentioned settings. Table 1 presents the obtained results along with the available theoretical and experimental data in the scientific literature. Our obtained values for all considered alkali metal tellurides are in excellent accord with the measured ones. Our
calculated values differ from the corresponding measured ones [1,2,26,38]by less than 0.4%, 0.6%, 1.0% and 0.7% for Li2Te, Li2Na,
Li2K and Li2Rb, respectively.Table 1shows also a good agreement
between our results and those from earlier calculations [2,4,5,7,9,10,26]. The lattice parameter a0 increases with increasing
atomic number Z of the alkali metal atoms,
i.e.,a0Li Te2 <a0Na Te2 <a0K Te2 <a0Rb Te2 . This trend can be attributed to the increase of the atomic radius (R) of the alkali metal atom M in the M2Te series (M: Li, Na, K, Rb) with the increase of their atomic
number Z, i.e.,R Li( ) <R Na( ) <R K( ) <R Rb( ). In order to obtain the bulk modulus B and its pressure derivative B’ values, the calculated primitive-cell volumes (V) as a function of pressure for each considered compound arefitted to the Murnaghan equation of state (EOS)[39]. The obtained values for B and B’, listed in Table 1, are in good agreement with the reported data in the scientific literature. The bulk modulus value decreases when going in the following sequence Li Te2 →Na Te2 →K Te2 →Rb Te2 , which is in accordance with the Cohen's approximation B~V−k[40].
3.2. Elastic constants and related properties
The single-crystal elastic constants Cijs are among the most
important parameters that characterize the physical properties of crystals. From a practical point, the elastic constants measure the resistance of a solid to an external applied macroscopic stress and their abilities to recover and regain their original shape after stress ceases. Thus, they provide important information regarding the strength, ductility and hardness of materials. In addition, some macroscopic elastic moduli such as the bulk, Young and shear moduli and Poisson's ratio, which characterize the mechanical properties of solids, can be obtained from the Cijs. From a fundamental viewpoint, the elastic
constants are the second derivative of the total energy with respect to strain. Therefore, from the elastic constants, one can derived valuable information on the mechanical stability and the stiffness of the binding between adjacent atomic planes, sound wave velocities, anisotropic character of the bonding, Debye temperature and so on. The computed single-crystal elastic constants C11, C12 and C44 for the examined
systems are quoted inTable 2as well as available values from other theoretical reports[5,7,9,10]for comparison. The obtained data allow us to make the following conclusions:
(i) No experiments have been conducted out to measure the single-crystal elastic constants Cijs to be compared with our obtained Fig. 1. The centered-faced cubic anti-fluorite Ca2T-type conventional unit-cell for the
results. However, we can state that there is an acceptable agreement with the available theoretical data for Li2Te[10]and
Na2Te [5,9] if we take into account that different
exchange-correlation potential functionals were used in these different works, which may explain the slight differences between the results.
(ii) For a cubic structure, the mechanical stability of a crystal can be judged via the Born stability criteria[41]:
C11+ 2C12> 0, C11− C12 > 0, C44> 0 (1) According to the listed data in Table 2, the Born stability criteria (1) are satisfied, implying that these alkali metal tellurides are mechanically stable.
(iii) The Cij values decreases when the alkali metal M atom in the
M2Te series is replaced in the sequence Li→Na→K→Rb,
indicating the decrease of the stiffness of the M2Te compounds
in the same sequence.
(iv) The relatively weak values of the elastic constants Cijs suggest the
weak resistance of these compounds against compressions and shear deformations.
(v) The elastic constant C11, which represents the stiffness against
compressional strain, is significantly higher than the C44and C12,
which represent the resistance against transverse strain, suggest-ing that the shear deformation is easier to take place than compression along the principle crystallographic directions. (vi) The sound wave propagations in a crystal are related to some
physical properties such as thermal conductivity. Acoustic wave velocities in a crystal can be obtained from the elastic constants through the resolution of Christoffel equation[42]. In a cubic crystal, the velocities of sound wave propagating in the [100,110] and [111] crystallographic directions are given by the following relationships: V[100]L = C ρ11/ , VT[100]1 =VT[100]2 = C44/ρ (2) V C C C ρ V C C ρ V C ρ = ( + + 2 )/2 , = ( − )/2 , = / L T T [110] 11 12 44 1 [110] 11 12 [110]2 44 (3) V C C C ρ V V C C C ρ = ( + + 4 )/3 , = = ( − + )/3 L T T [111] 11 12 44 1 [111] 2 [111] 11 12 44 (4)
The subscripts L and T stand to the longitudinal and trans-versal polarizations of the propagating sound wave. The computed sound velocities for the considered systems are listed inTable 3.
Table 1
The calculated lattice parameter a0(in Å), bulk modulus B (in GPa, derived from the EOS) and the pressure derivative of the bulk modulus B′ (dimensionless) compared to available
theoretical and experimental data in the scientific literature.
Li2Te Na2Te K2Te Rb2Te a0 Present work 6.491 7.269 8.068 8.442 Expt. 6.517a 7.314a, 7.329d 8.152a, 8.148e 8.490b 8.168d Others 6.559c, 6.478d6.532d, 6.37d, 6.483f, 6.518g, 6.347g, 6.518j, 7.246c, 7.285d, 7.383d, 7.107d, 7.210h, 7.209k 8.220c,8.114d, 8.237d, 7.919d, 8.233e, 8.152e 8.460d, 8.627d 8.258d, 8.233f B (EOS) Present work 28.22 20.12 14.83 13.09 Others 26.18c, 26.84d, 25.78d, 33.86d, 27.18f,26.03g, 29.76g 21.47c, 19.72d, 19.24d, 22.82d 13.99c,12.90e 12.08d, 12.21d 13.78d, 14.16d 14.69d, 23.61h, 23.59k 17.33d B' Present work 3.22 3.91 3.70 3.85 Others 4.68f, 3.89g 4.41h, 4.84k 4.3e 3.93g, aRef.[1]. bRef.[38]. cRef.[4]. dRef.[2,12]. eRef.[25]. fRef.[10]. gRef.[7]. hRef.[9]. kRef.[5]. Table 2
The calculated elastic constants (Cij, in GPa), bulk, shear and Young's moduli (B, G, E,
respectively, in GPa, derived from the Cijs), Poisson's ratio (σ, dimensionless), anisotropy
factor A, universal anisotropy index AUand anisotropy shear A
shearfor the Li2Te, Na2Te,
K2T and Rb2Te compounds. Property Li2Te Na2Te K2Te Rb2Te C11 44.60a 30.06a, 24.58a 18.40a 46.3b 38.14c, 38.06d C12 16.93a 11.20a, 9.71a 7.09a 17.62b 16.50c, 16.17d C44 20.57a 14.38a 8.27a 5.81a 16.42b 13.15c, 13.21d B (Cij) 26.15a 17.49a 14.67a 10.86a 27.01b 23.71c, 23.46d G 17.55a 12.14a 7.92a 5.74a 15.55b, 12.25d 16.92e, 25.58e E 43.02a, 39.19b 29.58a 20.15a 14.66a 39.73e, 61.04e 38.14b, 20.46d σ 0.2258a, 0.26b 0.2180a, 0.2711a 0.2750a 0.174e, 0.193e 0.275d B/G 1.49a,1.74b 1.44a, 1.85a 1.88a 1.20e, 1.30e 1.91d A 1.48a 1.52a, 1.11a 1.02a 1.145b 1.21d AU 0.19a 0.21a 0.013a 0.0009a Ashear 0.018a 0.021a 0.0013a 0.00009a aPresent work. bRef.[10]. cRef.[9]. dRef.[5]. eRef.[7].
One can appreciate that the longitudinal wave velocity is larger than the transverse ones and both longitudinal and transverse waves decrease in the same trend as the single-crystal elastic constants because the sound wave velocities are proportional to the square root of the corresponding elastic constants and inversely proportional to the mass density.
(vii) In general, the majority of the synthesized compounds are not single-crystal samples but they are in the form of aggregated mixtures of microcrystallites with random orientations. In these cases, it is not possible to measure the single-crystal elastic constants Cijs but instead of that, isotropic macroscopic
mechan-ical parameters, namely the bulk modulus (B) and shear modulus (G), may be measured. Since polycrystalline elastic moduli are more attractive in technological characterizations of materials, we calculated them from the obtained Cijs. Theoretically, the bulk
and shear moduli can be calculated from the Cijs via the
Voigt-Reuss-Hill averaging method [43–45]. For a cubic system, the bulk modulus is given by the same formula in both Voigt (BV) and
Reuss (BR) approximations:
C 2C
B = B = (V R 11+ 12)/3 (5)
The Voigt shear modulus (GV) and Reuss shear modulus (GR) are
defined by the following relationships:
G = (C − C +3C )/5V 11 12 44 (6)
C C
G = 5C (R 44 11− 12)/(4C44+ 3(C − C ))11 12 (7) Voigt and Reuss approximations result in the theoretical maximum and minimum values of these two moduli, respectively. According to Hill [45] approximation, the effective B and G moduli are approxi-mated by the arithmetic mean of the two mentioned limits–Voigt and Reuss: B= 1 B B G G G 2( + ); = 1 2( + ) V R V R (8) The Young's modulus E and Poisson's ratio σ for an isotropic material can be calculated from B and G via the following relationships:
E BG B G σ B G B G = 9 3 + ; = 3 − 2 2(3 + ) (9)
From Table 2, which lists the calculated values of the isotropic moduli: B, G, E andσ, one can make the following conclusions: a) There is a reasonable agreement between the bulk modulus value
calculated from the single-crystal elastic constants Cijs and its
corresponding value derived from the EOSfit. This may be a proof of the reliability of our predictions for the elastic constants. b) The relatively weak values of B, which represents the resistance to
volume change, G, which represents the resistance to shear deformation, and E, which is defined as the ratio of the tensile stress to the tensile strain, suggest that these compounds are characterized by a weak resistance to applied external stress. The decrease of the values of B, G and E in going from Li2Te to Rb2Te is
probably due to the increase of the unit-cell volume in the same sequence.
c) Poisson's ratioσ can provide important information regarding the characteristics of the bonding nature. The typical value ofσ for ionic crystals is 0.25 [46]. The Poisson's ratio values of the studied materials are close to 0.25, which suggests that the interatomic interactions in these compounds are central and consequently a higher ionic contribution in the interatomic bonding should be assumed.
d) By considering the shear modulus as representing of the resistance to plastic deformation and the bulk modulus as representing of the resistance to fracture, Pugh [47] introduced the B/G ratio as criterion to distinguish between the brittle and ductile character of solids. A low (high) B/G value is associated with brittleness (ductility). According to Pugh's criterion, the critical value of the B/ G ratio that separates brittleness and ductility is approximately 1.75 (it corresponds to σ = 0.6). The B/G ratio values presented in Table 2suggest that Li2Te and Na2Te are brittle while K2Te and
Rb2Te are ductile. On other hand, Frantsevich et al.[48]proposed
another criterion, which suggests to classify a compounds as ductile if σ > 1/3(σ = 1/3 corresponds to B G/ ≈ 2.67) and brittle if σ < 1/3. According to this criterion, all the herein considered compounds can be classified as brittle materials, which is in discrepancy with the Pugh criterion for the case of Li2Te and Na2Te, illustrating the
uncertainty of the concept.
(a) Elastic anisotropy of crystals reflects the anisotropy of their chemical bonding in different crystallographic directions. It is necessary and significant to estimate the elastic anisotropy of materials because it is highly correlated with the possibility to induce microcracks in the materials[49,50]and it has a significant influence on the nanoscale precursor textures in alloys[51]. Therefore, some approaches were developed in order to evaluate the elastic anisotropy in crystals. Three different indicators were used in this work to evaluate the elastic anisotropy of the considered compounds.
1) A usually used anisotropy factor; labelled Ziner's anisotropy index AZ, is given by the following expression[52]:
AZ = 2C44/(C11−C12) (10)
For a completely isotropic crystal,AZis equal to the unity; any deviation of AZfrom the unity is an indication of the presence of a
certain elastic anisotropy. The magnitude of the deviation of AZ
from the unity is a measure of the degree of the elastic anisotropy in the considered crystal. FromTable 2data, one can note that Li2Te,
Na2Te and K2Te have a certain degree of elastic anisotropy while
Rb2Te is practically an isotropic crystal.
2) A measurement of the elastic anisotropy in shearing ─ so-called percentage of elastic anisotropy in shearing AG─ is given by the
following expression[53]:
AG= (GV−GR)/(GV+GR) (11) The subscript R and V stand to the Voigt and Reuss approxima-tions. AGis null for the isotropic crystals. The percentages of shear
anisotropy of the studied materials are listed in Table 2. Li2Te
(A = 1.8%G ) and Na2Te (A = 2.8%G ) show a weak anisotropy while K2Te (A = 0.1%G ) and Rb2Te (A = 0.0%G ) are very close to the isotropic limit.
3) A measure of the elastic anisotropy accounting for both bulk and shear contributions is quantified by a universal index AU, defined as
follows[54]:
Table 3
Acoustic wave velocities for different propagating directions (in m/s), isotropic longitudinal, transverse and average sound velocities (Vl, Vtand Vm,respectively,in
m/s) and the Debye temperature (ѲD, in K) for the Li2Te, Na2Te, K2T and Rb2Te
compounds. Li2Te Na2Te K2Te Rb2Te VL[100] 3603.05 3164.49 3073.38 2363.36 VT[100] 2447.15 2189.23 1782.56 1328.08 VL[110] 3865.70 3415.64 3125.15 2373.31 VT1[110] 3603.051 2189.23 1782.56 1328.08 VT2[110] 2006.70 1930.74 1690.09 1310.16 VL[111] 3949.37 3571.04 3142.23 2376.62 VT[111] 2315.37 2057.90 1721.46 1316.14 Vl 3797.81 3349.79 3113.98 2371.28 Vt 2261.78 2011.34 1744.97 1320.84 Vm 2502.16 2224.87 1942.13 1470.79 ѲD 262.78 208.66 164.11 118.76
A G G B B =5 + − 6, U V R V R (12)
For an isotropic crystal, AUis equal to zero and any deviation of AU
from zero defines the extent of elastic anisotropy. The numerical estimations of AUfrom the calculated values of G
V and GR for the
considered materials are given inTable 2. The obtained results via AU confirm the already obtained results using other indexes; Li2Te and
Na2Te show a weak anisotropy while K2Te and Rb2Te are very close to
the isotropic limit.
(i) Debye temperatureθDis a fundamental parameter that is closely
related to many physical properties of solids, such as specific heat, melting temperature, thermal expansion coefficient, elastic con-stants and heat conductivity. One of the standard methods to calculate the Debye temperature (θD) is from the elastic constants
via the following equation[55]: ⎡ ⎣ ⎢ ⎛ ⎝ ⎜ ⎞⎠⎟⎤ ⎦ ⎥ θ h k n π ρ M V = 3 4 D B m 1 3 (13) In Eq. (13),Vm is the averaged sound velocity, h is the Plank's constant, kBis the Boltzmann's constant,ρ is the mass density, n is the
number of atoms in the unit-cell and M is the mass of atoms contained in the unit-cell.Vmis given by the following expression:
⎡ ⎣ ⎢ ⎢ ⎛ ⎝ ⎜ ⎞ ⎠ ⎟⎤ ⎦ ⎥ ⎥ V V V = 1 3 2 + 1 m t3 13 −1 3 (14) Here, Vland Vt are the longitudinal and transverse elastic wave
velocities defined by the following expressions[56]: ⎛ ⎝ ⎜ ⎞⎠⎟ ⎛⎝⎜ ⎞⎠⎟ V B G ρ V G ρ = 3 + 4 3 ; = l t 1 2 12 (15) The calculated Debye temperature θD and the isotropic sound
velocities of the investigated compounds are listed in Table 2. The progressive decreasing of the average sound velocities in the M2Te
series in the sequence: Li2Te→Na2Te→K2Te→Rb2Te explains the
low-ering of the Debye temperatures in the same sequential order.
3.3. Dynamical properties
3.3.1. Phonon dispersions and density of states
Phonons are the elementary excitations that influence some
physi-cal properties especially the thermodynamic behavior. Therefore, a systematic characterization of the phonon density of states and the dispersion relations for the alkali metal tellurides is highly desirable. The calculated phonon dispersion curves along several high symmetry directions in the Brillouin zone (BZ) and the corresponding total and projected atomic phonon densities of states (TDOS and PDOS) spectra for the Li2Te, Na2Te, K2Te and Rb2Te compounds at the optimized
lattice parameters are displayed in Fig. 2. The primitive-cell of the cubic anti-Ca2F-type structure contains three atoms that give rise to
nine phonon modes for a given wave vector q; three are acoustic modes and six are optical ones. Analysis of the calculated phonon dispersion curves and the DOS spectra allows us to make the following conclu-sions:
(i) No imaginary phonon frequency is observed in the entire BZ, demonstrating that the investigated four alkali metal tellurides are dynamically stable.
Table 4
Phonon frequencies at high symmetry points X and L (in cm−1) for the Li2Te, Na2Te,
K2Te and Rb2Te compounds. Li2Te Na2Te K2Te Rb2Te LTA 53.52a, 50.93b 45.72a, 46.29c 39.73a 31.95a LLA 102.80a, 103.28b 94.30a, 94.83c 83.92a 64.94a LTO1 250.62a, 284.57b 141.32a, 153.12c 100.50a 68.26a LLO1 252.04a, 287.56b 143.14a, 154.10c 103.94a 77.30a LTO2 260.78a, 295.62b 148.29a, 162.60c 111.57a 80.00a LLO2 334.25a, 356.65b 171.73a, 179.38c 118.77a 82.66a XTA 75.34a, 71.91b 66.43a, 66.93c 57.65a 47.60a XLA 101.47a, 105.52b 93.78a, 96.30c 74.46a 48.16a XTO1 217.35a, 253.77b 108.37a, 124.95c 78.78a 50.87a XLO1 220.52a, 251.72b 112.65a, 120.74c 83.25a 80.78a XTO2 270.86a, 308.98b 164.23a, 177.94c 122.89a 86.35a XLO2 381.47a, 407.17b 201.29a, 209.89c 139.79a 90.24a aPresent work (PP-PW, GGA08).
bRef.[10](PP-PW, LDA). cRef.[9](PP-PW, LDA).
Table 5
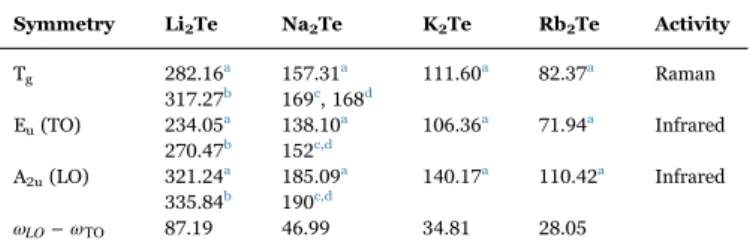
The assignment of the vibrational modes, their frequencies (in cm−1) and their activities at the Brillouin zone center for the Li2Te, Na2Te, K2T and Rb2Te along with available
theoretical results. Symmetry Li2Te Na2Te K2Te Rb2Te Activity Tg 282.16a 157.31a 111.60a 82.37a Raman 317.27b 169c, 168d Eu(TO) 234.05a 138.10a 106.36a 71.94a Infrared 270.47b 152c,d A2u(LO) 321.24a 185.09a 140.17a 110.42a Infrared 335.84b 190c,d ωLO−ωTO 87.19 46.99 34.81 28.05
aPresent work (using PP-PW with GGA08). bRef.[10].
cRef.[9].
dRef.[5](using PP-PW with LDA).
Fig. 3. Schematic representation of Eu (234.05 cm−1) and Tg(282.16 cm−1) optical
(ii) The main features of the obtained phonon dispersion curves are very close to those previously reported for Li2Te[10]and Ca2Te [5,9], which were obtained using the PP-PW method with the
local density approximation (LDA). We note here that the phonon dispersion curves are available in the scientific literature only for the Li2Te and Na2Te compounds. Therefore, this study is thefirst
theoretical prediction of the lattice dynamical properties for the K2Te and Rb2Te systems.
(iii) The curves of the longitudinal acoustic (LA) and transverse acoustic (TA) modes have a linear behavior in the neighbouring of theΓ point.
(iv) FromFig. 2, one can observe that the gap between the acoustic and optical branches decreases when going from Li2Te to Na2Te
to K2Te to Rb2Te in the M2Te series. There is a clear gap between
the acoustic and optical branches in the phonon dispersion curves of the Li2Te and Na2Te compounds, which merely reflects the
large mass difference between the anion Te and the cations Li and Na. The Li2Te and Na2Te phonon dispersion spectra exhibit great
similarities; the main differences are in the magnitudes of frequencies and the gap separating the optical branches from the acoustic ones. This mentioned gap does not appear at all in the K2Te and Rb2Te compounds. Besides, in the Rb2Te phonon
dispersion spectrum, there is an overlapping between the acoustic and optical branches.
(v) The longitudinal optical branch (LO) exhibit an upward disper-sion in Li2Te and Na2Te, aflat dispersion in K2Te and a
down-ward dispersion in Rb2Te along theΓ-X direction while it shows
an upward dispersion along the L-Γ direction in the four considered compounds and this dispersion increases from Li2Te
to Rb2Te.
(vi) The calculated phonon frequencies for the considered compounds at the high symmetry points X, L, W andΓ are summarized in Tables 3, 4. By comparing the phonon frequencies at these mentioned k-points, one can appreciate that the substitutions of the alkali metal in the M2Te series in the sequence:
Li→Na→K→Rbcauses a downshift of all the phonon frequen-cies. The width of the phonon band frequencies is approximately 381 cm−1 in Li2Te, 201 cm−1in Na2Te, 140 cm−1in K2Te and
110 cm−1in Rb2Te. The 1/ mre, where mreis the reduced mass of
all the atoms involved in the vibration, is equal to approximately 0.3897 in Li2Te, 0.2266 in Na2Te, 0.1828 in K2Te and 0.1398 in
Rb2Te. These results indicate that the width of the phonon band
frequencies is proportional to 1/ mre. This trend may be attrib-uted to the fact that the frequency of a harmonic oscillator can be calculated from the expression ω = k
m, where k is the force constant of the bond.
(vii) The total and projected atomic phonon densities (TDOS and PDOS) are depicted in the right panels ofFig. 2. The obtained DOS spectra are in good agreement with the available ones in the scientific literature for the Li2Te [10] and Na2Te [5,9]
com-pounds. It is known that the character of the lattice vibrational spectra of solids is governed by both the masses of the constituent atoms and the chemical bonding strengths. One can easily observe that the phonon spectra of the Li2Te and Na2Te
com-pounds are divided in two intervals of allowed frequencies separated by an obvious gap. The lower frequency interval, containing only acoustic modes, is attributed to the vibrations of the Te atom while the higher frequency, interval containing only optical modes, is due to the motions of the M (M: Li, Na) atom. The lighter atoms, i.e., Li and Na, move with higher frequencies and the heavier atom, i.e., Te, move with lower frequencies. In the case of K2Te, one can observe that the low
lying optical phonon modes have interaction with the acoustic phonon modes but it is still that the contribution of the Te (K) atom motion is mostly in the acoustic branches (optical branches) and its contribution to the optical branches (acoustic branches) is rather small. In the case of Rb2Te, these two frequency intervals
practically merge and both Rb and Te atom vibrations contribute
Fig. 4. Schematic representation of Eu(71.94 cm−1) and Tg(82.37 cm−1) optical phonon
modes in Li2Te, with atomic displacements at theΓ point (arrows).
Table 6
Electronic and static dielectric constants (ε∞and ε0, respectively), contribution to the dielectric constant from the IR-active phonon modes (εlat
0 ), Born effective charges for the cations(Z*(M: Li, Na, K, Rb)) and the anions (Z*(Te)), static refractive index (n(0)) and
static reflectivity (R(0)) for the Li2Te, Na2Te, K2Te and Rb2Te compounds.
s ε∞ ε0 ε0lat n(0) Z* (M) Z* (Te) R(0) Li2Te 4.97 9.36 4.39 3.06 1.023 −2.04 0.26 Na2Te 4.26 7.65 3.39 2.77 1.031 −2.06 0.22 4.45a 0.954a −1.908a K2Te 3.53 6.14 2.61 2.48 0.97 −1.95 0.18 Rb2Te 3.43 6.16 2.73 2.48 1.01 −2.03 0.18 bRef.[9].
with comparably intensities to the acoustic and optical branches. FromFig. 2, one can see that the contributions of the M (M: Li, Na, K, Rb) atom in the lower frequency interval and that of the Te atom in the higher frequency interval increase when going from Li2Te to Rb2Te. This indicates that the character of the lattice
vibrational spectra of the considered solids is governed by the masses of the constituent atoms.
3.3.2. Zone center phonon and dielectric properties
The lattice vibration modes withq≈ 0play a dominant role in the Raman scattering and infrared absorption. According to the group theory analysis, the irreducible representations of the optical phonon
modes at the Brillouin center,Γ point, are:
ΓOptical=E IRu( ) +T Rg( ) +A2u(IR) (16) Here, (IR) stands for infrared-active and (R) for Raman-active, A2u
is a single degenerate mode; Euis a doubly degenerated modes andTg are triply degenerated modes. The subscripts u and g represent the symmetric mode and the anti-symmetric one in the anti-symmetric center. The calculated phonon frequencies of these vibrational modes are given inTable 5together with their optical activities and along with the available theoretical results in the scientific literature. Unfortunately, no experimentalfindings are available in the scientific literature to be compared with our results. The obtained results are in
Fig. 5. Calculated real (ε1) and imaginary (ε2) parts of the dielectric function dielectric spectra for the Li2Te, Na2Te, K2Te and Rb2Te compounds. The damping was chosen to be 3% of
the frequency.
reasonable agreement with the available theoretical data for the Li2Te [10]and Na2Te[5,9]compounds. The triply degenerated phonon mode
T1g(without the LO-TO splitting) splits by the macroscopic Coulomb field into E (TO)u andA (LO)2u phonon modes. The ωLO−ωTOsplitting is given in Table 5. One can observe that the ωLO−ωTO splitting decreases when going from Li2Te to Rb2Te in the M2Te series,
indicating that the oscillator strength decreases in the same sequence. Generally, there are two factors that may control the relative positions of the LO and TO frequencies in materials: ionicity and mass ratio between the anion and cation. The LO-TO splitting, which is equal to approximately 87 cm−1in Li2Te, 47 cm−1in Na2Te, 34 cm−1in K2Te
and 28 cm−1in Rb2Te, shows a linear feature when it is plotted as a
function of m /mTe M, where mTeis the mass of the Te atom and mMis
the mass of the M atom (M: Li, Na, K, Rb). The m /mTe M is approximately 4.29 in Li2Te, 2.35 in Na2Te, 1.80 in K2Te and 1.22 in
Rb2Te. Thus, we conclude that the LO-TO splitting is mainly influenced
by the mass ratio between the cation and anion. It is found that the studied materials have 3 infrared-active optical modes and 3 Raman-active optical modes. From Table 5, one can note that our obtained values are slightly smaller than those reported in the scientific literature. This slight difference may be attributed to the fact that the GGA08 functional used in our work is different from the LDA used in the other calculations; each exchange-correlation potential is known by its own inherent defects.Fig. 3shows a schematic representation of the optical phonon Eu (234 cm−1) andTg (282 cm−1) modes in Li2Te as
representative for the M2Te (M: Li, Na) compounds with the atomic
displacements at theΓ point.Fig. 4shows a schematic representation of the optical phonon Eu(69 cm−1) andTg(79 cm−1) modes for Rb2Te
as a representative for the M2Te (M: K, Rb) with the atomic
displace-ments at the Γ point. Only the Li atom vibrations contribute to the optical modes in Li2Te while both Rb and Te atoms contribute to theTg optical modes. In the Eu mode, the vibration directions of the
neighbouring Li atoms are opposite but in theTgmode, they move in the same direction.
The low-frequency electronic dielectric (εα β, (∞)) and the Born effective charges (Z *α β, ) are defined by the following relationships:
ε π P E (∞) = 1 + 4 ∂ ∂ α β α β , (17) Z k V e P u k * ( ) = ∂ ∂ ( ) αβ α β (18)
Here,P is the macroscopic electronic polarization by the screened electricfield E and u kβ( )is the displacement of the k atom. Owing to the cubic symmetry of the considered compounds, the dielectric polariza-tion and Born effective charges are isotropic and consequently the macroscopic electronic dielectric (εα β, (∞)) and Born effective charges (Z *α β, ) tensors are diagonal with only one non-zero independent component. The calculated values for the electronic dielectric function ε∞and Born effective charges Z* for anions and cations of the examined systems are listed inTable 4and compared to the availablefindings in the scientific literature. There is a good agreement between our results and the available data in the scientific literature[9]. Our obtained values for the Born effective charges are very close to the nominal ionic value of−2 for the Te atom and +1 for the M (M: Li, Na, K, Rb) alkali atom. These results demonstrate the strong ionic character of the M-Te bonds and the weakness of the covalent character contributions in these bonds.
3.3.3. Infrared response
Usually, only the contribution of the electronic polarizations to the dielectric function is taken into account when studying the optical properties of materials. However, in the infrared region of the light spectrum – i.e., low frequency electric field –, the ionic materials absorb and reflect light strongly due to the interaction of the electrical field with transverse optical infrared-active phonons[9,57]. Therefore, in the condition of low-frequency electric field, we should take into account both the electronic and ionic polarizations. In this case, the dielectric function is given by the following relationship[57,58]:
∑
ε ω ε ω jε ω ε ε ω ω ω ω jγω ( ) = ( ) + ( ) = + − − + m LO m TO m TO m 1 2 ∞ ∞ , 2 , 2 , 2 2 (19) Here, ε ω1( ) and ε ω2( ) are the frequency-dependent real and imaginary parts, respectively, of the dielectric function ε ω( ), ωTO m, and ωLO m, are the transverse and longitudinal optical mode frequencies, respectively, andγis the damping coefficient. The calculated dielectric spectra of the considered materials in the frequency range 0–350 cm−1are depicted inFig. 4. In the case of an electrostaticfield, the static
dielectric constant ε0(ε0=ε(0))is given by the following expression:
∑
ε ε ε ω ω ω = + − m LO m TO m TO m 0 ∞ ∞ , 2 , 2 , 2 (20) The static dielectric constant ε0 can be also calculated using the Lyddane-Sachs-Teller relationship:∏
ε ε ω ω = m LO m TO m 0 ∞ , 2 , 2 (21) The calculated static dielectric constants ε0for the studied materials and the contributions of the infrared-active phonon modes to ε0(ε0lat) are listed inTable 6. From these obtained results, one can note that the studied M2Te compounds have an electronic dielectric constant slightlylarger than that of the lattice contribution. From the dielectric function dispersion (ε ω( ) =ε ω1( ) +jε ω2( )), one can calculate the dispersion relations for the refractive index n ω( ), extinction coefficient k ω( ) and reflectivity coefficientR ω( )using the following relationships:
ω ε ω ε ω ε ω n( ) = 1 2( ( ) +1 1( ) + ( ) ) 2 22 (22) k ω( ) = 1 ε ω ε ω ε ω 2(− ( ) +1 1( ) + ( ) ) 2 22 (23) R ω ε ω ε ω n ω k ω n ω k ω ( ) = ( ) − 1 ( ) + 1 = ( ( ) − 1) + ( ) ( ( ) + 1) + ( ) 2 2 2 2 2 (24) The refractive indexn( )ω and extinction coefficient k ω( ) spectra of the M2Te series are depicted inFig. 5and the reflectivityR ω( )spectra
are shown in Fig. 6. The static refractive index n(0) and static reflectivity R(0) are listed in Table 6. Fig. 6 shows that a strong infrared reflection, higher than 40%, occurs in the range 138–320 cm−1
(between ωTOand ωLO) in Li2Te, 121–183 cm−1in Na2Te, 97–139 cm−1
in K2Te and 76–110 cm−1in Rb2Te because the infrared-active modes,
resulting in a poor transmission property in this range. The reflectivity attains its maximum (between 85% and 90%) at 255 cm−1in Li2Te,
150 cm−1in Na2Te, 115 cm−1in K2Te and at 89 cm−1in Rb2Te (Fig. 7).
4. Conclusions
In summary, we investigated the structural, elastic and lattice dynamical properties of a series of alkali metal tellurides with the antifluorite structure, M2Te (M: Li, Na, K and Te), using the DFT and
DFPT with the GGA-PBEsol. The calculated equilibrium lattice para-meters fit very well with the measured ones. The calculated single-crystal and polysingle-crystalline elastic constants and their related properties reveal that the examined compounds are mechanically stable and characterized by a weak resistance to external applied strains. The phonon dispersion curves show that the investigated compounds are dynamically stable. The calculated phonon densities reveal that the acoustic modes are due principally to the Te atom vibration and the optical modes are due to the M atom vibration in the Li2Te, Na2Te and
K2Te compounds. In Rb2Te, both atoms Rb and Te contribute
comparatively in both acoustic and optical modes. The Raman and infrared frequencies were obtained and assigned using the irreducible representation of the symmetry group at the center of Brillouin zone. The electronic contribution to the dielectric constant is slightly larger than the lattice vibration one. We have investigated the dielectric properties and the infrared response spectra.
References
[1]E. Zintl, A. Harder, B. Dauth, Lattice structure of the oxides, sulfides, selenides and tellurides of lithium, sodium and potassium, Z. Elektrochem. 40 (1934) 588–593. [2]S.M. Alay-E-Abbas, N. Sabir, Y. Saeed, A. Shaukat, First-principles study of
structural and electronic properties of alkali metal chalcogenides: m2Ch [M: li, Na,
K, Rb; Ch: o, S, Se, Te], Int. J. Mod. Phys. B 25 (2011) 3911–3925.
[3] R.D. Eithiraj, G. Jaiganesh, G. Kalpana, M. Rajagopalan, First-principles study of electronic structures and ground-state properties of alkali-metal sulfides – Li2S,
Na2S, K2S and Rb2S, Phys. Status Solidi (b) 244 (2007) 1337–1346.
[4] R.D. Eithiraj, G. Jaiganesh, G. Kalpana, M. Rajagopalan, First-principles study of electronic structures and ground-state properties of alkali-metal selenides and tellurides (M2A) [M: li, Na, K; A: se, Te, Int. J. Mod. Phys. B 23 (2009) 5027–5037.
[5] X. Zhang, C. Hing, H. Ma, G. Shi, Z. Li, First-principles study on lattice dynamics, thermodynamics and elastic properties of Na2Te under high pressure, Phys. Scr. 88
(2013) 035602.
[6] R.D. Eithiraj, G. Kalpana, Magnetism induced by nonmagnetic dopant in Li2O,
Na2O, K2O and Rb2O:first-principles calculations, J. Mater. Sci. 47 (2012)
2316–2321.
[7] B. Bahloul, L. Amirouche, A. Dekhira, A. Bentabet, Ab initio study of the structural, electronic and elastic properties of anti-fluorite Li2X (X=S and Te) compounds under pressure effect, Comput. Mater. Sci. 86 (2014) 49–56.
[8] X. Zhang, C. Hing, H. Ma, G. Shi, Z. Li, Afirst-principles study on lattice dynamics, thermodynamics and elastic properties of lithium selenide under high pressure, Comput. Mater. Sci. 79 (2013) 903–907.
[9] F. Kalarasse, B. Bennecer, Elastic properties and lattice dynamics of alkali chalcogenide compounds Na2S, Na2Se and Na2Te, Comput. Mater. Sci. 50 (2011)
1806–1810.
[10] X.D. Zhang, H.F. Shi, Lattice dynamics, thermodynamics and elastic properties of Li2Te under high pressure:first principles study, Mater. Sci. Technol. 30 (2014)
732–738.
[11] S.V. Syrotyuk, V.M. Shved, Quasiparticle electronic band of the alkali metal chalcogenides, Condens. Matter Phys. 18 (2015).
[12] S.M. Alay-E-Abbas, A. Shaukat, FP-LAPW calculations of structural, electronic and optical properties of alkali metal tellurides: M2Te [M: li, Na, K and Rb], J. Met. Sci. 46 (2011) 1027–1037.
[13] H. Kikuchiy, H. Iyetomi, A. Hasegawa, Insight into the origin of superionic conductivity from electronic structure theory, J. Phys.: Condens. Matter 10 (1998) 11439–11448.
[14] W. Bührer, H. Bill, Lattice dynamics of Na2S, J. Phys. C: Solid State Phys. 13 (1980)
5495404.
[15] P.M. Mjwara, J.D. Comins, P.E. Ngoepe, W. Bührer, H. Bill, Brillouin scattering investigation of the high temperature diffuse phase transition in Li2S, Phys.:
Condens. Matter 3 (1991) 4289–4292.
[16] H. Khachai, R. Khenata, A. Bouhemadou, A. Haddou, A.H. Reshak, B. Amrani, D. Rached, B. Soudini, FP-APW+lo calculations of the electronic and optical properties of alkali metal sulfides under pressure, J. Phys: Condens. Matter 21 (2009) 095404.
[17] H. Khachai, R. Khenata, A. Bouhemadou, A.H. Reshak, A. Haddou, M. Rabah, B. Soudini, First principles study of the elastic properties in X2S (X=Li, Na, K and
Rb) compounds under pressure effect, Solid State Commun. 147 (2008) 178. [18] Hyungjun Noh, Jongchan Song, Jung-Ki Park, Hee-Tak Kim, A new insight on
capacity fading of lithium-sulfur batteries: the effect of Li2S phase structure, J.
Power Sources 293 (2015) 329–335.
[19] Md Jamal, G. Venugopal, Md Shareefuddin, M. Narasimha Chary, Sodium ion conducting glasses with mixed glass formers NaI-Na2O-V2O5-B2O3: application to
solid-state battery, Mater. Lett. 39 (1999) 28–32.
[20] Md Jamal, Md Shareefuddin, M. Narasimha Chary, Ionic transport and battery characterization studies on NaI-Na20-B203, J. Power Sources 58 (1996) 217–219.
[21] Motohiro Nagao, Akitoshi Hayashi, Masahiro Tatsumisago, Takahiro Ichinose, Tomoatsu Ozaki, Yoshihiko Togawa, Shigeo Mori, Li2S nanocomposites underlying
high-capacity and cycling stability in all-solid-state lithium-sulfur batteries, J. Power Sources 274 (2015) 471–476.
[22] Ki. Bong Lee, Michael G. Beaver, Hugo S. Caram, Shivaji Sircar, Performance of Na2O promoted alumina as CO2chemisorbent in sorption-enhanced reaction
process for simultaneous production of fuel-cell grade H2 and compressed CO2
from synthesis gas, J. Power Sources 176 (2008) 312–319.
[23] Hong-Ki Lee, Joong-Pyo Shim, Mi-Ja Shim, Sang-Wook Kim, Ju-Seong Lee, The characteristics of synthesized potassium hexatitanate and the manufacturing process of the matrix, Mater. Chem. Phys. 45 (1996) 243–247.
[24] D. Bisero, A. Di Bona, P. Paradisi, S. Valeri, K2Te photocathode growth: a photoemission study, J. Appl. Phys. 87 (2000) 543–548.
[25] X. Li, X. Zhao, Z. Chu, Z. Wang, Comparison study of Rb2Te and Cs2Te solar blind
ultraviolet cathodes, J. Vac. Sci. Technol. 34 (2014) 808–813.
[26] K. Seifert-Lorentz, J. Hafner, Crystalline intermetallic compounds in the K-Te system: the Zintl-Klemm principle revisited, Phys. Rev. B 66 (2002) 094105. [27] X. Zhang, W. Jiang, Elastic, lattice dynamical, thermal stabilities and
thermo-dynamic properties of BiF3-type Mg3RE compounds fromfirst-principles
calcula-tions, J. Alloy. Compd. 663 (2016) 565.
[28] X. Zhang, W. Jiang, First-principles investigation on vibrational, anisotropic elastic and thermodynamic properties for L12 structure of Al3Er and Al3Yb under high pressure, Philos. Mag. 96 (2016) 320.
[29] C.–Y. Yang, F.–P. Dai, R. Zhang, L.–H. Li, Q. Zhou, Elastic, phonon and thermodynamic properties of ZnAl2O4and ZnAl2S4compounds from
first–princi-ples calculations, Solid State Sci. 40 (2015) 7–12.
[30] A. Benmakhlouf, A. Bentabet, A. Bouhemadou, S. Maabed, R. Khenata, S. Bin-Omran, Structural, elastic, electronic and optical properties of KAlQ2(Q = Se, Te): a
DFT study, Solid State Sci. 48 (2015) 72–81.
[31] U. Koroglu, S. Cabuk, E. Deligoz, First-principles study of structural, elastic, electronic and vibrational properties of BiCoO3, Solid State Sci. 34 (2014) 1–7.
[32] J.-W. Yang, T. Gao, Y.-R. Gong, The disproportionation reaction phase transition, mechanical, and lattice dynamical properties of the lanthanum dihydrides under high pressure: afirst principles study, Solid State Sci. 32 (2014) 76–82.
[33] S.J. Clark, M.D. Segall, C.J. Pickard, P.J. Hasnip, M.J. Probert, K. Refson, M.C. Payne, First principles methods using CASTEP, Z. fuer Krist. 220 (2005) 567. [34] J.P. Perdew, A. Ruzsinszky, G.I. Csonka, O.A. Vydrov, G.E. Scuseria,
L.A. Constantin, X. Zhou, K. Burke, Restoring the density-gradient expansion for exchange in solids and surfaces, Phys. Rev. Lett. 10 (2008) 136406.
[35] J.D. Pack, H.J. Monkhorst, Special points for Brillouin-zone integrations, Phys. Rev. B 16 (1977) 1748.
[36] T.H. Fischer, J. Almlof, General methods for geometry and wave function optimization, J. Phys. Chem. 96 (1992) 9768.
[37] K. Refson, P.R. Tulip, S.J. Clark, Variational density-functional perturbation theory for dielectrics and lattice dynamics, Phys. Rev. B 73 (2006) 155114.
[38] K. Stöwe, S. Appel, Polymorphic forms of rubidium telluride Rb2Te, Angew. Chem.
Int. Ed. 41 (2002) 2725–2730.
[39] F.D. Murnaghan, The compressibility of media under extreme pressures, Proc. Natl. Acad. Sci. 30 (1944) 244–247.
[40] M.L. Cohen, Calculation of bulk moduli of diamond and zinc-blende solids, Phys. Rev. B 32 (1985) 7988.
[41] J.F. Nye, Physical Properties of Crystals: Their Representation by Tensors and Matrices, Oxford University Press, Oxford, 1985.
[42] L.D. Landau, E.M. Lifshitz, Theory of Elasticity, Course of Theoretical Physics, Pergamon Press, New York, 1980.
[43] W. Voigt, Lehrbuch der Kristallphysik, B.G. Teubner, Leipzig, Berlin, 1928. [44] A. Reuss, Berechnung der Fließgrenze, von Mischkristallen auf, Grund der
Plastizitätsbedingung für Einkristalle, Z. für Angew. Math. und Mech. 9 (1929) 49–58.
[45] R. Hill, The elastic behaviour of a crystalline aggregate, 1952, Proc. Phys. Soc. A 65 (1952) 349.
[46] J. Haines, J.M. Leger, G. Bocquillon, Synthesis and design of superhard materials, Annu. Rev. Mater. Res. 31 (2001) 1.
[47] S.F. Pugh, Relations between the elastic moduli and the plastic properties of polycrystalline pure metals, Philos. Mag. 45 (1954) 823–843.
[48] I.N. Frantsevich, F.F. Voronov, S.A. Bokuta, I.N. Frantsevich (Ed.)Elastic Constants and Elastic Moduli of Metals and Insulators Handbook, Kiev, Naukova Dumka, 1983, p. 60.
[49] V. Tvergaard, J.W. Hutchinson, Microcracking in ceramics induced by thermal expansion anisotropy, J. Am. Soc. 71 (1988) 157–166.
[50] P. Ravindran, L. Fast, P.A. Korzhavyi, B. Johansson, Density functional theory for calculation of elastic properties of orthorhombic crystals: application to TiSi2, J.
Appl. Phys. 84 (1998) 4891.
[51] P. Lloveras, T. Castán, M. Porta, A. Planes, A. Saxena, Influence of elastic anisotropy on structural nanoscale textures, Phys. Rev. Lett. 100 (2008) 165707. [52] C. Zener, Elasticity and an elasticity of Metals, University of Chicago Press, Chicago,
1948.
[53] H. Chung, W.R. Buessem, in: F.W. Vahldiek, S.A. Mersol (Eds.), Anisotropy in Single Crystal Refractory Compound, 2, New York, 1968.
[54] S.I. Ranganathan, M. Ostoja-Starzewski, Universal Elastic Anisotropy Index, Phys. Rev.
[55] O.L. Anderson, A simplified method for calculating the Debye temperature from elastic constants, J. Phys. Chem. Solids 24 (1963) 909.
[56] E. Schreiber, O.L. Anderson, N. Soga, Elastic Constants and their Measurements, McGraw-Hill, New York, 1973.
[57] X. Zhang, W. Wang, Q. Zeng, H. Li, First-principles study of the dielectric properties and infrared reflectance spectrum of Y2O3, Solid State Commun. 150
(2010) 360–363.
[58] V. Zelezny, E. Cockayne, J. Petzelt, M.F. Limonov, D.E. Usvyat, V.V. Lemanov, A.A. Volkov, temperature dependence of infrared-active phonons in CaTiO3: a