HAL Id: hal-01868702
https://hal.archives-ouvertes.fr/hal-01868702
Submitted on 5 Sep 2018
HAL is a multi-disciplinary open access
archive for the deposit and dissemination of
sci-entific research documents, whether they are
pub-lished or not. The documents may come from
teaching and research institutions in France or
abroad, or from public or private research centers.
L’archive ouverte pluridisciplinaire HAL, est
destinée au dépôt et à la diffusion de documents
scientifiques de niveau recherche, publiés ou non,
émanant des établissements d’enseignement et de
recherche français ou étrangers, des laboratoires
publics ou privés.
Particle design Part B: batch quasi-emulsion process and
mechanism of grain formation of ketoprofen
Fabienne Espitalier, Béatrice Biscans, C Laguérie
To cite this version:
Fabienne Espitalier, Béatrice Biscans, C Laguérie. Particle design Part B: batch quasi-emulsion process
and mechanism of grain formation of ketoprofen. Chemical Engineering Journal, Elsevier, 1997, 68
(2-3), pp.103-114. �10.1016/S1385-8947(97)00057-0�. �hal-01868702�
Chemical
Engineering
Journal
ELSEVIER Chemical Engineering Journal 68 ( 1997) 103-l 14Particle design
Part B: batch quasi-emulsion process and mechanism of grain formation
of ketoprofen
F. Espitalier, B. Biscans, C. Lagukie
Luhorutoire de G&e chmique, UMR CNRS 5503, ENS/CC. IH Chemin de la Loge, 31078 Toulouse Cede*, France
Received 23 April 1996; revised 9 October 1996; accepted 7 April 1997
Abstract
This study deals with the spherical crystallization process by the quasi-emulsion mechanism, applied to a pharmaceutical. The objective is to produce spherical agglomerates made of a number of small crystals of the drug, having properties adequate for direct compression when manufacturing tablets. The aim of this work is to make the link between the process and these properties. The different steps occurring in the process are the fortnation of an emulsion whose droplets are made of the drug dissolved in a solvent, the creation of the supersaturation of the drug in the droplets by mass and heat transfer and the nucleation, growth and agglomeration of drug crystals inside the droplets.
The process has been carried out in a batch laboratory scale device. The variation of the operating parameters on the one hand and of the relative proportions of the various components on the other have enabled us to determine the influence on the internal and external structures
of the produced agglomerates which influence the ability to be compressed. The identitication of the phenomena occurring has led to a
proposed mechanism for the formation of the agglomerates. 0 1997 Elsevier Science S.A.
Krywrds: Emulsion: Process; Spherical grains; Mass and thermal transfers; Crystallization
1. Introduction
In order to improve particle properties, new processescom- bining granulation and crystallization are being developed. This work deals with the spherical crystallization process by the quasi-emulsion mechanism applied to ketoprofen, aphar- maceutical drug [ I]. This process allows production of spherical grains made of small crystals of a drug that have adequate properties for direct compression when manufac- turing tablets [ 2,3].
The different steps occurring in the process are first the formation of an emulsion (the droplets are made of the drug dissolved in a good solvent and the continuous phase contains a poor solvent of drug and emulsifier), then the creation of the supersaturation of the drug into the droplets by mass and heat transfer, and finally the nucleation, the growth and the agglomeration of drug crystals inside the droplets [ 11.
13558947/97/$17.00 0 1997 Elsevier Science S.A. All rights reserved
P~~s1385-89~7(97)00057-0
2. Experimental apparatus and methods
2.1. Experimental apparatus
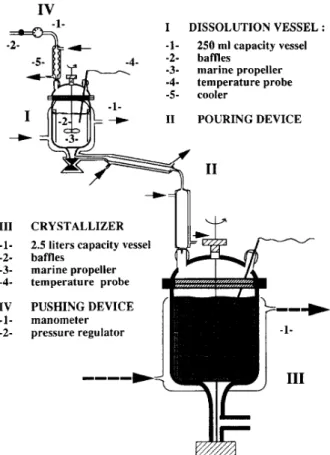
The experimental apparatus of the batch quasi-emulsion process is shown on Fig. 1. It is made up of four parts: a dissolution vessel (I), a transfer device (II), a crystallizer (III) and a pressurizing device (IV).
The dissolution vessel ( I- 1) is a reactor, 250 ml in volume, with an internal diameter of 60 mm in which the ketoprofen is dissolved in pure acetone. A cooler (I-5) prevents loss of acetone by evaporation. The crystallizer (III) is a 2.5 I capac- ity baffled vessel with an internal diameter of 1.50 mm. This vessel contains initially the aqueous solution. These tworeac- tors have baffles (1-2 and M-2) and marine propellers (I-3 and 111-3). The width of the baffles is equal to I /IO the internal diameter of reactors. The diameter of the propellers has been chosen in order that the ratio D,lD,. is between 0.4 and 0.6, so the propeller of the dissolution vessel has a diam-
104 F. Espirulier er al. /Chemical Engineering Journal 68 (1997) 103-114 IV I DISSOLUTION VESSEL : 250 ml capacity vessel baflles marine propeller temperature probe cooler POURING DEVICE III CRYSTALLIZER
-l- 2.5 liters capacity vessel -2- baffles -3- marine propeller -4 temperature probe / IV PUSHING DEVICE -l- manometer --+ -2- pressure regulator -l-
Fig. 1. Experimental apparatus of crystallization process by the quasi-emul- sion process.
eter equal to 40 mm and the propeller of the crystallizer 60 mm.
The organic phase is poured into the aqueous phase by means of two devices: a pressurized device (IV) and a flow- ing down device (II) ended by a capillary with a variable diameter ( 1 or 2 mm). The organic solution trickles down in a regular flowrate. The temperatures of the dissolution reactor and of the flowing down device are controlled.
2.2. Operuting conditions
For the experiment, first ketoprofen is dissolved in the dissolution reactor containing pure acetone at high tempera- ture, T,, which ranged between 48 and SO “C. The dissolution time of ketoprofen is fixed at 2 h for all experiments. Then water containing a polyvinylic alcohol, mowiol 8-88 (0 to 500X 10e6 kg mowiol kg-’ solution) is placed in a agitated crystallizer, and maintained at a temperature T2 lower than T,.
The relative proportion of ketoprofen/acetone has been chosen in accordance with the solubility curve of the keto- profen in pure acetone. The boiling temperature of solution gives the maximum temperature T, while the difference of temperature ( T, - Tz) is changed in the process by modifying 12.
The acetone + ketoprofen mixture is introduced at a con- stant flowrate into the aqueous solution. In the crystallizer,
an emulsion is formed and in few minutes these droplets are transformed into spherical solid grains.
The system is thermally controlled at T2 and the agitation of the system is maintained for at least 20 min. During this time, for a few experiments, sampling of suspension is carried out with a steel tube and a syringe, 50 ml in volume. These samples ( 1 to 2 ml) are immediately filtered with 0.45 km filters and preserved in order to follow the concentration of acetone and ketoprofen in the continuous phase.
At the end of the experiment, the agglomerated crystals are recovered by filtration, washed with distilled water and dried in a drying oven at 50 “C for more than 24 h.
The operating parameters of the experiment are the flo- wrate of the ketoprofen + acetone solution, the stirring rate in the crystallizer, the difference of temperature (T, - T2), the diameter of capillary ending the pouring system and the residence time of the agglomerates in the crystallizer. The parameters characterizing the relative proportions of the com- pounds of the solutions are ketoprofen/acetone, acetone/ water and mowiol/water ratios.
2.3. Amzlytical method 2.3.1. Solid characterization
The texture and the structure of grains obtained have been characterized by several techniques.
The flowability of grains is investigated by measuring the time, t,, required for 100 g of grains to flow through a cali- brated funnel. The flow has been recorded by a video camera in order to analyse the flow consistency. From the video film, the volume of grains falling in the graduated test tube is noted as a function of time.
Before this flow test, grains are divided twice into eight statistically equal samples by a RESCHT divider to measure their size and to observe their structures.
The median size and size distribution of a sample is meas- ured by a laser sizer GALA1 CIS- 1. The grains are suspended in distilled water in the cell of a laser sizer with a peristaltic pump for 5 min. Water is a non-solvent [ 1 ] and improves the dispersion of agglomerated grains. The mass of grains used is about 2 g. The GALA1 system of analysis gives access to statistical data. These statistical data, for example, are the size distribution in number, surface and volume. In this work, the results are presented in terms of volume. The mean diam- eter, &, and the standard deviation, (TV, are respectively given by the following equations:
(1)
(Td’ C(d,-&)2&dn, I”
C$dni 1 (2)
where dn, is the number percentage of particles with a mean diameter in class i equal to ( &)i.
The median diameter corresponds to the size at which the cumulative distribution curve equals 50%. The particles with
F. Espitaiier et al. /Chemical Engineering Journal 68 (1997) 103-114 105
Table 1
Size of grains before and after the tapping tests
Size data
Before the tests After the tests
Mean diameter (km) 259 215 Standard deviation (pm) 181 163 Median diameter (pm) 198 162 Fine particles (‘%) 10.66 18.07 Coarse particles (%) 9.98 6.13
a size smaller than 100 km have here been called fine and those with a size greater than 500 pm are called coarse par- ticles. The median diameter, the mean diameter, the standard deviation and the percentages of fine and coarse particles will be given as results of the distribution for each experiment.
In order to observe the shape, the surface topographies and the internal structures of grains we have used a scanning electronic microscope (SEM)
The apparent densities have been obtained by means of a Hosokawa powder analyser. A mass of grains corresponding to 100 cm3 in volume has been measured, before and after
10, 100, 200, 400 and 500 tappings; 500 are necessary to obtained the tapped apparent density. The apparent density, P”PP’ and tapped apparent density. pfapp, are given by the equations
pa,,=%
(g cm+>
where m, is the initial mass and mzOO is the mass after 500 tappings.
2.3.2. Liquid analysis
During the experiments, in order to investigate the diffu- sion process of acetone and ketoprofen, concentrations of those products are regularly measured in the continuous phase by high performance liquid chromatography. During the first seconds of the experiment, it is very difficult to separate the dispersed phase from the continuous phase: the droplets go through the filter and so the concentrations of acetone and ketoprofen in the continuous phase cannot be obtained.
3. Preliminary experiments 3. I. Strength
of
grainsDuring the analysis, the grains can be submitted to stresses modifying their size and shape. To analyse these stresses, tests of fragility have been carried out. Measurements of mean and median diameters and standard deviation against the cir-
culation time in the peristaltic pump used in size analysis have shown that the pump does not break the grains. In Table 1, size distributions of grains, before and after tapping tests. are reported for a standard experiment. The size distri- bution is shifted to smaller values.
3.2. Experiment reproducibility
Crystallization process reproducibility has been tested. Table 2 summarizes the operating conditions of these exper- iments. It can be seen that there are small differences of pouring flowrates and of mowiol concentration between these experiments. The results of these experiments, reported in the same table, show good reproducibility. The apparent den- sities and the tapped apparent densities are the same and the concentrations of acetone in mother liquors are quasi-equal:
&7% from the mean value. On the other hand, the concen- trations of ketoprofen do not seem reproducible. This heter-
Table 2
Operating conditions and results of experiments of reproducibility
Experiments 1 2 3 Operating conditions Stirring rate (rpm) Diameter of phial (m) AT (“C)
Pouring rateX IO’ (m’s-‘) W, X lOh (kg ketoprofen/kg suspension) 500 500 500 0.002 0.002 0.002 29.1 29 29 7.x 7.2 6.9 0.042 0.042 0.042 W,, X lOh (kg mowiol/kg suspension) 215 224 215 W, (kg acetone/ kg suspension) 0.022 Analysis of liquid filtrated
W’, (kg acetone/kg solution) W’, X 1 Oh (kg ketoprofen/kg solution)
0.022 0.024 0.025 432 228 367
Analysis of solid: apparent densities (g cmm7) Apparent density Tapped apparent density After IO tappings After 100 tappings After 200 tappings After 400 tappings After 500 tappings 0.47 0.47 0.47 0.5 1 0.52 0.52 0.49 0.50 0.50 0.5 1 0.52 0.52 0.52 0.53 0.53 o.s3 0.54 0.54 0.54 0.54 0.54 Size data before the tapping tests
Mean diameter (km) Standard deviation (pm) Median diameter (km) Fme particles (%) Coarse particles (c/o)
251 257 268 180 178 198 182 187 188 11.92 14.17 13.9 9.93 IO.04 12.8 Mass balance on solid
Initial mass of ketoprofen (g) Final mass of grains (g) Loss during filtration (g) Mass balance ((m) 90.78 90.92 90.59 87.33 87.22 87.20 0.84 0.44 0.72 - 2.9 -3.6 - 2.9 0.023 0.022
106 F. Espitalier et al. /Chemical Engineering Journal 68 (I 997) 103-l 14
Table 3
Operating conditions of experiments
Experiment no. W, (kg ketoprofenl W,X lo6 (kg W, (kg acetone/ AT (“C) Q,X 10h N (rpm) d, (m) Dissipated power kg acetone) mowiol/kg water) kg water) (rn’s-‘) P: x 10’ (W/kg
suspension) 2 4 6 8 9 10 11 12 13 14 15 16 17 18 19 20 21 22 23 24 25 26 21 28 29 30 31 1.92 1.93 1.92 1.92 1.93 1.91 1.95 1.91 1.92 1.94 1.98 1.93 I .93 I .93 1.93 1.93 1.94 1.94 1.94 0.98 1.93 1.96 1.73 1.88 1.94 1.92 1.91 1.01 1.91 1.79 1.94 230 240 230 220 230 232 230 230 228 229 224 230 230 230 232 243 225 218 966 253 225 161 223 227 225 225 512 239 237 227 0.024 29.1 7.8 516 0.002 8.7 0.025 29 7.2 516 0.002 8.7 0.024 29 6.9 516 0.002 8.7 0.024 28.9 0.3 1 516 0.001 8.7 0.023 29.2 0.94 516 0.001 8.7 0.024 28.4 2.0 516 0.001 8.7 0.024 29.5 2.0 516 0.001 8.7 0.024 28.3 2.4 516 0.001 8.7 0.024 29 6.1 516 0.00 1 8.7 0.023 9.4 2.4 516 0.001 8.7 0.023 13.9 2.3 516 0.00 1 8.7 0.024 18.9 2.4 516 0.00 1 8.7 0.024 39.5 2.2 516 0.00 1 8.7 0.024 28.9 2.4 664 0.00 1 18.7 0.024 40 1.3 516 0.00 I 8.7 0.04 29.2 2.5 516 0.00 1 8.4 0.055 28.8 2.3 516 0.001 10.7 0.078 28.9 2.3 516 0.00 1 7.2 0.023 29.2 0.94 516 0.001 8.7 0.025 27.7 3.5 516 0.001 8.9 0.055 27. I 2.9 516 0.001 10.7 0.023 0.9 1.5 516 0.001 8.7 0.026 29.4 1.3 516 0.001 8.7 0.024 38.4 2.2 516 0.00 I 8.7 0.054 27.1 3.0 450 0.001 7.3 0.078 21.7 2.7 416 0.001 8.7 0.023 26.2 3.0 516 0.001 8.7 0.028 27.7 3.5 516 0.001 8.9 0.024 28.3 2.4 516 0.00 I 8.7 0.025 30.4 1.89 516 0.001 8.7 0.055 28.5 1.89 516 0.001 10.7
ogeneity could be developed during filtration or during sampling of the solution or from a very quick evolution of sample concentration with time. However, the absence of reproducibility of ketoprofen concentrations must be mini- mized because these concentrations are lower than 2000 ppm. The error made during the quantity determination is lower than 1%.
The diameters of grains are reproducible about 2 to 4% around the mean value. Finally, the reproducibility of process experiments based on size distribution can be considered as satisfactory.
4. Experimental results
The operating conditions of the different experiments are summarized in Table 3. Experiments are carried out over 20 min because the composition of the continuous phase becomes almost constant after this period. Two experiments have required more time (experiments 10 and 22). Experi- ments at different stirring rates have determined an operating range. The minimal stirring rate equal to 402 rpm corresponds to the stirring rate under which spherical grains adhere to
each other in the crystallizer after 20 min. The upper limit (664 rpm) is fixed by the design of the equipment.
4.1. Solvent transfer
The transfer of solvents is influenced by several factors. The influence of the following parameters on the mass trans- fer of acetone are discussed here: the initial temperature T2 and the acetone/water, mowiollwater and ketoprofenlace- tone ratios.
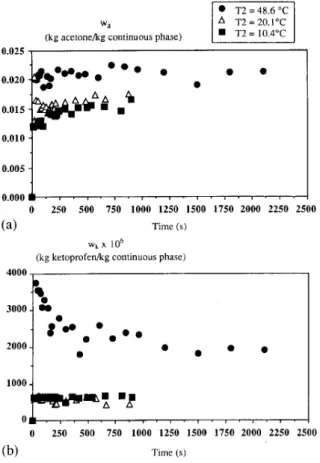
In order to investigate the contribution of temperature, T, has been maintained at a constant value as T2 has been varied. Experiments have been carried out with three different tem- peratures T2. The results are shown in Fig. 2(a) and (b). The final mass fraction of acetone in the continuous phase increases by increasing the temperature and tends towards a maximum equal to W,l( 1 + W,). A low difference of initial temperatures between the two phases accelerates the mass transfer of acetone outside the droplets. However, we have observed that this low difference leads to an agglomeration of grains in the crystallizer. Fig. 2(b) shows that the mass fraction of ketoprofen reaches a maximum and then decreases down to a quasi-constant mass fraction. For the experiment
F. Espitalier et al. /Chemical Engineering Journal 68 (1997) 103-114 107
l T2 = 48.6 “C
wz A TT=ZO.IT
(kg acemnwkg continuous phase) n T2 = 10.4’C
0 250 500 750 1000 1250 1500 1750 2000 2250 2500
(4 Time (s)
Wk x 106
(kg ketoprofenfig continuous phase)
1
I
1000
-
m=t
‘b
Ok.,.,.,.,.,.,.,.,.,.
0 250 500 750 1000 1250 1500 1750 2000 2250 2500 (b) Time (s)Fig. 2. Evolution of mass fractions in continuous phase in accordance with initial temperature Tz of (a) acetone; (b) ketoprofen.
with a temperature TZ of 48.6 “C, the maximum mass fraction reaches 3733 ppm. In that case, it can be assumed that an excess of ketoprofen is carried out by a strong flux of organic phase. Then, ketoprofen crystallizes and the formed crystals stick on the grains, leading to a decrease of mass fraction of dissolved ketoprofen in the continuous phase.
Experiments have been carried out with three different mass ratios, 0.026, 0.054 and 0.078 kg acetone/kg water. Fig. 3(a) and (b) show respectively the influence of this parameter on the mass fraction of acetone and of ketoprofen in the continuous phase. The maximum mass fraction of ace- tone increases when the initial ratio increases (Fig. 3(a) ). According to Fig. 3 (b) , the initial value of ketoprofen mass fraction increases when the ratio of acetone/water increases. But the initial ratio of acetone/water does not influence the final mass fraction of ketoprofen in the continuous phase. This mass fraction is constant and equal to 505 + 52 ppm.
Two ratios of mowiol/water have been studied, 223 X 10Ph and 5 12 X 10Ph kg mowiol/kg water. The final mass fractions of acetone and ketoprofen in solution are not influenced by the ratio of mowiol/water. In the same way, the evolution of the mass fraction of acetone in the continuous phase is not influenced by the ratio of ketoprofen/acetone.
According to our results two basic parameters influence this transfer: the difference of temperatures (T, - T2) and the initial mass ratio (acetone/water).
A A/W = 0.026 kg acetone/kg water n A/W = 0.054 kg acetone/kc water 0 A/w = 0.078 kg acetone& water
0.04 n W n . n n 0.02 AAAAA A 250 500 750 Time (s) Wk x 106
(4 O
(kg de ketopmfenikg continuous phase)
:::: : 2500 2000 b 1500 1000 n m n M 500 Oo Ap 200 AA0 tA8 0m n 0 250 so0 750 1000 1250 1500 1750 2000 (b) Time (s)
Fig. 3. Evolution of mass fractions in continuous phase in accordance with initial mass ratio of acetone/water of (a) acetone; (b) ketoprofen.
4.2. Grain properties 4.2.1. Apparent densities
The apparent densities of agglomerates depend on the flo- wrate at which the ketoprofen solution was poured. Apparent density and tapped apparent density, for experiments 4 to 9, decrease when the flowrate increases. For flowrates higher than 2.4 cm3 sP ‘, the apparent density and tapped apparent density remain constant and respectively equal to 0.47 and 0.50 g cmP3. However, a flowrate lower than 0.3 cm3 s- ’ permits us to obtain an apparent density equal to 0.53 g cm-’ and a tapped apparent density equal to 0.6 I g cm ‘. These two values are interesting to give adequate properties of com- primability to the drug. The evolution of apparent densities in accordance with tapping number and different flowrate values has been studied. We have noted that the densities increase sharply from the first 10 tappings. Then the apparent densities continue to increase more slowly. These densities remain constant after 200 tappings.
From results corresponding to experiments 8, 10, 1 I, 12 and 13, the difference of temperature (AT= T, - T2) does not have a significant effect on the apparent densities. When AT is small (for AT= 10 “C and smaller values) agglomer- ation of grains has been observed in the crystallizer. This agglomeration begins after about 20 min. For higher AT
108 F. Espitaiier et al. /Chemical Engineering Journal 68 (19971103-l 14
( = 40 “C), the required residence time is higher than 20 min: zrains need 60 min to solidify. An experiment with A Tequal to zero has been done. The grains formed are agglomerated and need 35 min to solidify. The results concerning the influ- ence of tapping number on apparent densities are identical to results observed during the study of the influence of flowrate.
Two stirring rates have been studied: 5 16 and 664 rpm. In the presented results, the dissipated power and the rate of breaking the pouring jet vary from one experiment to another. The dissipated powers are given in Table 3. The apparent densities are not modified by agitation.
Two diameters of pouring capillary have been used: 1 and 2 mm (experiments 1 and 6). The study has been made with a constant linear rate. This diameter has no influence on apparent densities.
Fig. 4 shows the influence of the relative proportions of acetone/water on the apparent densities for experiments 8. 16, 17 and 18. The variation of this ratio involves the variation of the suspension volume into the crystallizer. In practice, to increase the ratio of acetone/water, the mass of water has to be decreased because of the limited capacity of the dissolution reactor. Therefore, the dissipated power is modified even if the stirring rate is kept constant. Identical stirring rates lead to the same break ofjet. Points I,2 and 3 on Fig. 4 correspond to the same stirring rate (5 16 rpm), and points I, 2 and 4 are made for the same dissipated power. At constant dissipated power, the apparent densities decrease when the ratio of ace- tone/water increases. But for constant stirring rate, the ratio of acetone/water has no influence on the apparent densities.
Table 4
Influence of flowrate on distribution size
Apparent density (p/cm’)
4 0.00 0.01 0.02 0.03 0.04 0.05 0.06 0.07 0.08 0.09 0.10
W. (kg acetone/kg water)
Fig. 4. Influence of initial mass ratio of acetone/water on apparent density and tapped apparent density.
The Carr index is equal to the relative difference between the apparent tapped density and the apparent density. Fig. 4 shows that these two apparent densities are quasi-equal for a mass ratio equal to 0.055 kg acetone/kg water. So, for iden- tical stirring rates, but with different dissipated powers, the Carr index decreases. The decrease of this index leads to a better flowability of grains.
Three relative proportions of mowiol/water have been studied: 0, 230X lop6 and 960X 10eh kg mowiol/kg water (experiments 5, 19 and 29). These experiments have shown that an emulsifier is necessary to form the droplets (experi- ment 29) and for high mowiol/water a coalescence of grains is observed (experiment 19). This agglomeration leads to an important loss of product during filtration. Apparent density
No. Flowrate X I Oh Mean diameter Standard deviation Median diameter Percentage lower Percentage higher (m’s-‘) (pm) (km) (v-m) than 100 pm than 500 km Before 500 tappings 15 1.3 260 184 199 11.30 9.90 13 2.2 237 171 179 11.62 7.67 After 500 tappings 4 0.3 I 240 183 174 23.92 9.17 5 0.94 223 179 156 23.89 7.96 6 2.0 214 167 153 21.51 7.11 7 2.0 217 174 150 24.94 7.58 8 2.4 233 183 166 25.94 8.38 9 6.1 224 177 165 24.38 7.32 Table 5
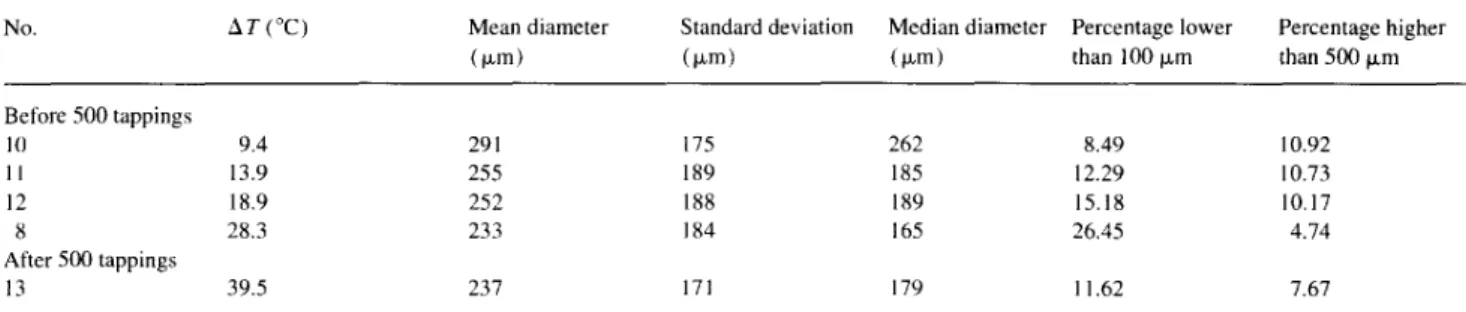
Influence of temperature difference &Ton distribution size
No. AT (“C) Mean diameter (i-m)
Standard deviation Median diameter Percentage lower Percentage higher (km) (km) than 100 p,m than 500 km Before 500 tappings 10 9.4 291 175 262 8.49 10.92 11 13.9 255 189 185 12.29 IO.73 12 18.9 252 188 189 15.18 10.17 8 28.3 233 184 165 26.45 4.74 After 500 tappings 13 39.5 237 171 179 1 1.62 7.67
F. Espitalier et ul. /Chemical Engineering Journal 68 (19Y7) 103-114 109
sharply increases when the relative proportion of mowiol/ water decreases.
4.2.2. Size distribution
The results of size analysis are reported in Table 4. The size analysis shows that the median diameter and the per- centage of coarse grains decrease when the flowrate increases and the percentage of fine particles is quasi-constant. How- ever after the tapping tests, the size distributions are the same for all flowrates.
Table 5 gives the results of size analysis as function of AT. When AT increases, the median diameter and the percentage of fine particles decrease.
The median diameter is reduced and the percentage of fine particles enlarges when the stirring rate increases (from 26%
for 5 16 rpm to 3 1% for 664 rpm) . The mean diameter of grains increases from 220 to 270 pm when the diameter of the capillary increases.
Experiments 8, 16, 17 and 18, reported in Table 6, show that an increase of the acetone/water ratio causes an increase of the median diameter (234 urn for experiment 17 and 474 pm for experiment 18) and an increase in the number of coarse particles. The percentage of fine particles increases when the acetone/ water ratio decreases.
Median diameter and percentage of coarse particles are enlarged by an increase of relative proportion of mowiol/ water (because of the agglomeration phenomenon).
The percentage of fine particles is high (between 19 and 25%). When the ketoprofen ratio decreases (for experiments 8 and 20)) the percentage of fine particles seems to decrease.
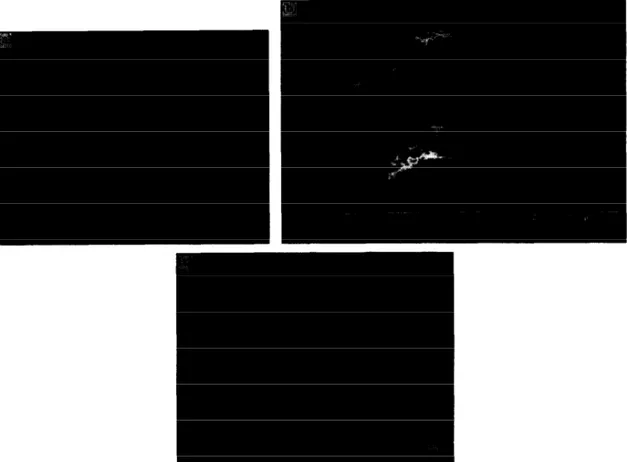
Fig. 5. Grains obtained by the quasi-emulsion process: (a) spherical grain; (b) non-spherical grain (experiment 18) ; (c) deformed sphere (experiment 10). Table 6
Influence of initial acetone/water ratio on size data
No. Acetone/water ratio Mean diameter Standard deviation Median diameter Percentage lower Percentage higher (kg acetone/kg water) (km) (wm) (km) than 100 )*m than 500 pm
Before tapping 18 17 After tapping 18 16 8 0.078 486 211 414 1.93 42.81 0.055 278 162 234 4.81 7.55 0.055 267 159 220 5.42 7.19 0.040 245 186 177 16.68 10.24 0.023 233 183 165 25.94 8.38
110 F. Espitalier et al. /Chemical Enginrrring Jownai 68 (1997) 103-I 14
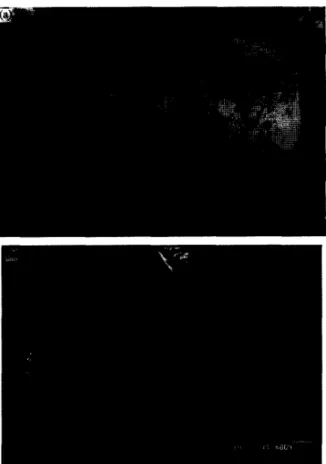
Fig. 6. Coalescence and agglomeration during the process: (a) coalescence of droplets leading to a deformed grain (AT= 9.4 “C, experiment IO); (b) agglomeration of grains (966 ppm mowiol, experiment 19); (c) deformed grain (966 ppm mowiol, experiment 19).
4.2.3. Flowability
All samples have flow time ranged between 7.5 and 13 s. Only two experiments lead to a flow time higher than 15 s (experiments I9 and 11) . These results have been compared to results obtained with glass balls with a mean diameterequal to 250 Km. In that case, the flow time is equal to 3 s. So the flowability of grains is good while their flow times are higher than those of glass balls. Properties of the product can explain this difference. The study of flow by camera has shown that the flow is not regular.
5. Grain structure
SEM photographs of the agglomerated crystals of ketopro- fen have shown that two shapes of agglomerates and two internal structures can be found.
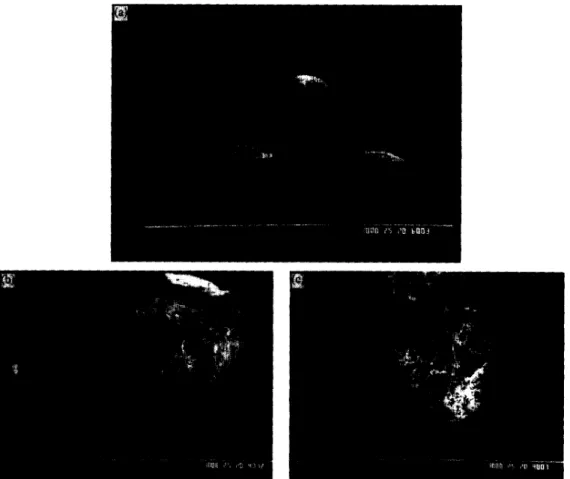
5. I. External structure
Spherical grains (Fig. 5(a), experiment 13) and non- spherical grains (Fig. 5(b), experiment 18) are obtained. Among non-spherical grains, some are elongated (Fig. 5 (b) ) and some are deformed spheres (Fig. 5(c) ) . Three parame- ters have an influence on the form of the grains: difference of initial temperature, initial concentration of mowiol and initial ratio of acetone/water.
The sphericity of grains decreases when the acetone/ water ratio increases. For a ratio higher than 0.060 kg acetone/kg water, we have systematically found elongated grains. The difference of temperature and the concentration of mowiol can lead to coalescence of droplets or to agglomeration of grains in the crystallizer. Fig. 6(a) (experiment 10, AT= 9.4 “C) and Fig. 6(b) (experiment 19: 966 ppm mowiol) show respectively the coalescence of droplets before the crystalli- zation and agglomeration of grains. Fig. 6(c) displays the distortion of droplets during the process due to an high con- centration of mowiol (experiment 19). The grains in Fig. 6(b) have an external surface rougher than those obtained with lower concentration of mowiol (Fig. 7(a), experiment 4). The difference of temperature also seems to have an effect on the surface of grains. Fig. 7(a) (AT< 35 “C) and Fig. 7(b) (AT> 35 “C, experiment 13) exhibit dif- ferent surface states. For AT lower than 35 “C, the faces of crystals on the surface are perceptible (Fig. 7(a)), and for AT higher than 35 “C, developed faces are oblique and dis- organized (Fig. 7(b) ) The mechanism of grain formation varies as a function of AT.
Moreover, several holes randomly scattered over the sur- face of all the agglomerates have been observed. Two expla- nations can be given:
l these holes may be created by impacts (impacts of agglom- erates/stirrer, impacts of agglomerates/baffles)
F. Espitalier et al. /Chemical Engineering Journal 68 (1997) 103-114 111
Fig. 7. Surface and oriented crystal faces: (a) the faces most developed are visible (AT< 35 “C, experiment 4); (b) the developed faces are oblique (AT>35”C,experiment 13).
l inter-facial movements caused by opposite mass transfers of two solvents can create brutal jets of solvents that run through the inter-facial crust [ 41.
5.2. Internal structure
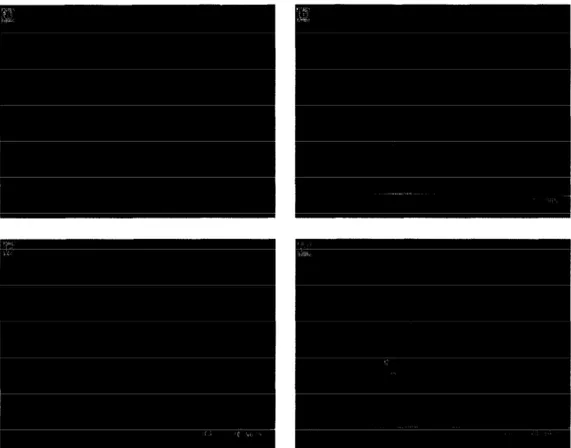
A cut made on grains has permitted us to observe internal structures. Two types of internal structure exist:
0 hollow spherical agglomerates (see Fig. 8 (a) ) l full spherical agglomerates (see Fig. 8 (b) ) .
The hollow grains have a dense crust in which the crystals seem to have two orientations. On the edge of the grain, the longest faces of the crystals are perpendicular to the radius of the grain. These crystals form the first crust. From this first crust, other crystals are developed: their longest faces are now parallel to the radius of the grain (see Fig. 8 (c) ) . These crystals form the second crust.
The internal structure depends essentially on the difference of temperatures between the two phases and on the initial ratio of acetone/water. In the hollow grains, the thickness of the crust surrounding the grains is a function of the difference of temperature ( T, - T2). When this difference decreases, the thickness of the crust increases and this crust becomes more dense. So we can suppose that only one crust is formed for A T higher than 35 “C. The single presence of the second crust
explains the difference of external surface for AT higher than 35 “C. Fig. 8(a), (b) and (d) illustrate the influence of ratio of acetone/water on the internal structures for ratios equal respectively to 0.023,0.052 and 0.078 kg acetone/kg water. In this case, the crust observed occupies all the grain and becomes dense when the initial ratio increases. These differ- ences of internal structures explain the low Cat-r index obtained for the initial ratio equal to 0.055 kg acetone/kg water (see Section 4.2.1, Fig. 4). Full grains are formed when the initial ratio becomes higher than 0.05 kg acetone/ kg water. The other grains have a hollow structure.
6. Mechanism of formation of grains
The different structures obtained by varying the two main operating parameters (difference of initial temperature and acetone/water ratio) are illustrated by Fig. 9. Three steps must be taken into account to explain the formation of the grains: formation of droplets, creation of supersaturation and crystallization of ketoprofen into droplets. When the droplets are formed, three phenomena are in competition: mass trans- fer, heat transfer and internal hydrodynamic circulation. 6.1. Size of droplets
The initial size of droplets influences the importance of the previously cited phenomena. The size of droplets depends essentially on the flowrate of the organic solution, on the diameter of the falling jet, on the proportion of mowiol in water and on the stirring rate. The size of droplets induces the different internal structures observed: those with one crust, with two crusts, and full internal structure. The mech- anism of formation is summarized in Fig. 10. The various steps described are explained below.
4.2. Creation of supersaturation
The heat and mass transfers lead the droplet to a supersat- uration state allowing crystallization. This has been studied separately from equilibria data. Here, we divide the droplet into different concentric layers in order to analyse the super- saturation in the droplet. The supersaturation ratio in a layer j is called s’. The layers are numbered from the solid/liquid
interface.
Determination of equilibrium data of the ketoprofen/ace- tone/water system has shown that the solubility ofketoprofen increases in the acetone + water solvent as the temperature increases [ 51. So, the temperature of hot droplets formed in the cold continuous phase decreases from the interface to the centre. The droplet develops a higher supersaturation ratio at its surface than in its centre (S’ > S’ > S3 > 5“’ > S5.. ) . There- fore, by creating a difference of temperature (T, - T2), the crystals of ketoprofen appear preferentially at the interface.
Moreover, for the ternary system, ketoprofen/acetone/ water, at constant temperature, the solubility of ketoprofen
112 F. Espitalier et al. /Chemical Engineering Journal 68 (I 997) 103-I 14
Fig. 8. Hollow and full grains: (a) hollow grain (acetone/waterratio <0.055 kg acetone/kg water, experiment 16); (b) full grain (acetone/waterratio > 0.055 kg acetone/kg water, experiment 17); (c) enlargement of grain crusts presented in Fig. 6(a); (d) full grain (acetone/water ratio > 0.070 kg acetone/kg water, experiment 18)
increases for low water percentage, then decreases when the water proportion increases (see part A of this work [ 61) . If water enters into the droplet at constant temperature, the con- centration of water decreases as the radius decreases. But, when the mass ratio of acetone/water is higher than 0.67 kg acetone/kg water + acetone mixture, the solubility of keto- profen reaches a maximum for a value between 0.86 and 0.93 kg acetone/kg water + acetone mixture and the supersatura- tion cannot be reached only by water addition [ 51. The tem- perature of the droplet must also be reduced for the creation of supersaturation. So, by combining the effect of temperature
sphericity of grain decreases I I b I I
full non spherical - 10 5 ate1 0 O.Ol/ 0.02 0.04 O.fS 0.06 0.07 0.08 0.09 0.10 I thick crust
Fig. 9. Summary of different structures as function of AT and initial mass ratio of acetone/water.
and water penetration, the profile of supersaturation ratio can be for example: S’ > S* > S” and S’ <Y’ and X’ > S5 > s” with S’ < s”. So with such a profile crystals can appear everywhere in the droplet.
The internal circulation homogenizes the concentration in the droplet.
6.3. Ctytallization
The internal structures can be explained from the impor- tance of the different phenomena.
63.1. Grains with a hole
These grains are formed from small droplets: the diameter of the droplet is lower than a critical diameter. The magnitude of the critical diameter can be calculated by modelling the transfer in the droplets [ 71.
6.3.1.1. Grains with one crust
When the difference of temperature between the organic phase and the aqueous phase is large (A T higher than 35 “C), one crust is formed by thermal effect. This crust then reduces the mass transfer of solvents. In this crust, the crystals have no preferential direction. This phenomenon is frequently encountered in the spray drying process.
F. Espitalier et al. /Chemical Engineering Journal 68 (I 997) 103-I 14
- Emulsifier z Mass transfers
II Crystals without preferential direction Crystals with preferential direction Fig. 10. Mechanism of grain formation by the quasi-emulsion process
6.3.1.2. Grains with two crusts 7. Conclusion When the difference of temperature is lower than 35 “C,
most grains have a crust with two juxtaposed solid layers at their periphery. In that case, the mass transfer and the internal hydrodynamics are in competition.
Since the supersaturation limit is reached preferentially at the interface, the crystals appear at the surface of the grains. The liquid circulates in the droplet at rates higher than those produced by the mass transfer. These hydrodynamic move- ments allow the first crystals to grow. Since this circulation follows the periphery of the droplet, the growth of faces that are perpendicular to the movement is favoured [ 81. The long- est faces of crystals are perpendicular to the radius of the grain. These crystals form the first crust. When this crust becomes compact, internal circulation is reduced so only mass transfer continues through the first porous crust and the crystals grow in a direction parallel to the flux of transport or to the radius of the grain. These crystals form the second crust. They probably continue to grow during drying.
This work gives an analysis of spherical crystallization experiments carried out in a batch laboratory scale device. The influences of operating parameters have been studied: difference of temperature; initial mass ratios of acetone/ water, mowiol/water, and ketoprofen/acetone; organic solu- tion flowrate; stirring rate, and capillary diameter. The anal- ysis of these influences has permitted us to propose a mechanism of grain formation. This mechanism involves three steps: formation of droplets, creation of supersaturation by mass and heat transfer, and crystallization of ketoprofen in the droplets.
Three internal structures have been identified: 0 internal structure with one crust
l internal structure with two crusts
0 full internal structure.
The internal structure of grains depends on the initial size of droplets because this size governs the importance of phe- nomena occurring in the droplets. Modelling of grain for- mation has been published elsewhere [ 71.
63.2. Full grains
Grains are formed from droplets with a diameter larger than the critical diameter. In that case, the internal liquid circulation created in the droplet is less important than that produced by the mass transfer. Since the rates of mass transfer are important, the induction time preceding the nucleation is very long (see part A of this work [ 61) . The internal circu- lation favours mixing in the liquid droplet. In these condi- tions, when nucleation occurs, the fine nuclei agglomerate to create a network of fine pores. In addition, ketoprofen pres- ents a narrow metastable zone in the presence of crystals (part A of this work). Primary nucleation is then followed by secondary nucleation in the droplet. A full grain is then created after these two waves of nucleation.
Acknowledgements
The authors wish to acknowledge Rhone-Poulenc-Rorer Company and the French Minis&e de 1’Enseignement SupC- rieur et de la Recherche (MESR) for their financial support of this project.
Appendix A. Nomenclature d diameter (m)
114 F. Espitalier et al. /Chemical Engineering Journal 68 (1997) 103-114
(cl,),
GA
DP Q m. m500 NQC
s
T T, T2 W, M’kW,
wkmean number diameter in class i (m) mean volume diameter in class i (m) diameter of the propeller (m) diameter of the reactor (m) initial mass with no tapping (g) initial mass after 500 tappings (g) rate of rotation (rpm)
flowrate ( m3 s- ‘) supersaturation ratio (-) temperature (“C)
temperature of dissolution (“C)
initial temperature of water in crystallizer (“C) mass fraction of acetone in continuous phase (kg acetone/kg mixture)
mass fraction of acetone in continuous phase (kg ketoprofen/kg mixture)
mass ratio of acetone in water (kg acetone/kg water)
mass ratio of ketoprofen in acetone (kg ketoprofen / kg acetone)
AT difference of initial temperatures between the dispersed and continuous phases (“C)
%P , apparent density (g cmm3) p 2PP tapped apparent density (g cm-‘) ud standard deviation (m)
[ I ] F. Espitalier, Ph.D. Thesis, INP Toulouse, France, 1994.
[2] A. Sano, T. Kuriki, Y. Kawashima, H. Takeuchi, T. Hino, T. Niwa, Chem. Pharm. Bull. 37 (8) (1989) 2183-2187.
[ 31 Y. Kawashima, in: D. Chulia, M. Deleuil, Y. Pourcelot, (Eds.), Powder Technology and Pharmaceutical Processes, Elsevier Science B.V., Amsterdam, The Netherlands, 1994, ch. 14, part 1, pp. 493-5 11. [4] R. Clift, J.R. Grace, M.E. Weber, Bubbles, Drops and Particles,
Academic Press, New York, 1978.
[5] F. Espitalier, B. Biscans, S. Peyrigain, C. Laguerie, Fluid Phase Equilibria 113 (1995) 151-171.
[6] F. Espitalier, B. Biscans, C. LaguCrie, Chem. Eng. J. 68 (1997) 95% 102.
171 F. Espitalier, B. Biscans, J.R. Authelin, C. LaguCrie, Trans. Inst. Chem. Eng. 75 A ( 1997) 257-267.