HAL Id: tel-02610413
https://tel.archives-ouvertes.fr/tel-02610413
Submitted on 17 May 2020HAL is a multi-disciplinary open access archive for the deposit and dissemination of sci-entific research documents, whether they are pub-lished or not. The documents may come from teaching and research institutions in France or abroad, or from public or private research centers.
L’archive ouverte pluridisciplinaire HAL, est destinée au dépôt et à la diffusion de documents scientifiques de niveau recherche, publiés ou non, émanant des établissements d’enseignement et de recherche français ou étrangers, des laboratoires publics ou privés.
Analytical Developments for Measuring Atmospheric
Peroxy Radicals
Ahmad Lahib
To cite this version:
Ahmad Lahib. Analytical Developments for Measuring Atmospheric Peroxy Radicals. Theoretical and/or physical chemistry. Ecole nationale supérieure Mines-Télécom Lille Douai, 2019. English. �NNT : 2019MTLD0022�. �tel-02610413�
N° d’ordre: INDIANA UNIVERSITY
THESE
présentée en vue d’obtenir le grade deDOCTEUR
enDiscipline : Sciences de la Terre et de l’Univers Spécialité : Optique et Lasers, Physico-Chimie, Atmosphère
Par
Ahmad LAHIB
DOCTORAT DE L’UNIVERSITE DE LILLE DELIVRE PAR IMT LILLE DOUAI Titre de la thèse :
Analytical Developments for Measuring Atmospheric Peroxy Radicals Date de soutenance prévue le 16 décembre 2019 devant le jury d’examen : Rapporteur Lisa WHALLEY Senior Scientist, NCAS, Leeds (UK) Rapporteur Christopher CANTRELL Professeur, LISA, Université de Paris
Examinatrice Manuela CIRTOG Maître de conférences, LISA, Université de Paris
Examinatrice Christa FITTSCHEN Directrice de Recherche CNRS, PC2A, Université de Lille Examinatrice Gisèle EL DIB Maître de conférences, Institut de Physique de Rennes Examinateur Philip STEVENS Professeur, Indiana University (USA)
Examinateur Sébastien DUSANTER Maître Assistant, IMT Lille Douai Directeur de thèse Alexandre TOMAS Professeur, IMT Lille Douai
Laboratoires d’accueil : Sciences de l'Atmosphère & Génie de l'Environnement, IMT Lille Douai O'Neill School of Public and Environmental Affairs, Indiana University (USA)
Ecole Doctorale SMRE 104 (ULille, ULCO, UVHC, Centrale Lille, Chimie Lille, IMT Lille Douai)
3
Acknowledgments
This project was in fulfillment of obtaining a doctoral degree at University of Lille. Apart from the efforts of myself, the success of any project depends largely on the encouragements and guidelines of many others.
First of all, I would like to thank my committee members: Lisa Whalley, Christopher Cantrell, Christa Fittschen, Manuela Cirtog and Gisèle EL Dib for accepting to be part of my defense and to review my work.
I take this opportunity to express my gratitude to the people who have been instrumental in the successful completion of this project. I would like to show my greatest appreciation to Sebastien Dusanter and Philip Stevens, Alexandre Tomas for their support and supervision throughout the duration of this project. I cannot say thank you enough for their tremendous support and help. I feel motivated and encouraged every time I attended their meeting and without their encouragement and guidance, this project would not have materialized.
I would like also to express my deepest appreciation to Sebastien Dusanter, he provided me the possibility to complete this project even stimulating the suggestions, encouragement and coordinate writing this manuscript as well.
I thank all my labmates, especially Marius Duncianu for his unyielding patience and helps with PERCA technique, Colleen Rosales for offering her time and help using the FAGE technique and Vinay Kumar for experiences and the time we worked together on VOC measurements and Zachary Payne, Brandon Bottorff and Emily Reidy for the interesting conversions we shared. I want to thank also all members at IMT LILLE DOUAI and Indiana University who indirectly contributed to this project.
Last, but not least, I thank my family, especially my lovely wife Douaa Hamad, for their never-ending support and constant encouragement. You have been the ultimate person motivation behind this work. Love You.
4
"There are no secrets to success. It is the result of preparation, hard
work, and learning from failure." -- Colin Powel
1
Table of contents
General Introduction ... 14
Chapter 1. Bibliographical Context ... 20
1.1 Tropospheric Chemistry of ROx radicals ... 20
1.1.1 Radical Initiation ... 23
1.1.2 Radical Propagation ... 29
1.1.3 Radical Termination ... 35
1.1.4 Ozone production and destruction ... 38
1.2 Measuring peroxy radicals in the atmosphere ... 40
1.2.1 Matrix Isolation and Electron Spin Resonance Spectroscopy ... 40
1.2.2 Chemical Ionization Mass Spectrometry ... 41
1.2.3 Chemical Amplification ... 43
1.2.4 Laser Induced Fluorescence-Fluorescence Assay by Gas Expansion & ROx Laser Induced Fluorescence ... 52
1.2.5 ROx calibration techniques... 59
1.3 Field measurements of ROx radicals in the troposphere ... 64
1.3.1 Interferences for OH and HO2 measurements in FAGE and CIMS... 65
1.3.2 Model-measurement comparisons of ROx radicals ... 68
1.4 Outline of Dissertation ... 71
1.5 References ... 73
Chapter 2. Development and characterization of a chemical amplifier for peroxy radical measurements in the atmosphere ... 92
2
2.2 Introduction ... 96
2.3 Experimental Section ... 101
2.3.1 Description of the chemical amplifier ... 101
2.3.2 Calibration of the Chain Length ... 104
2.4 Box modeling of the amplification chemistry ... 106
2.5 Results & Discussion ... 108
2.5.1 Gas Reagents Optimization ... 109
2.5.2 Linearity of the chemical amplifier response (ΔNO2) with HO2 ... 113
2.5.3 Dependence of the CL on RH ... 114
2.5.4 Quantification of T(RO2) for several RO2 radicals ... 116
2.6 Field deployment of the chemical amplifier ... 119
2.7 Estimation of the detection limit ... 122
2.8 Conclusion ... 123
2.9 Supplementary material ... 126
2.10 References ... 134
Chapter 3. Implementation of the ROxLIF technique on a Laser-Induced Fluorescence/Fluorescent Assay by Gas Expansion instrument ... 154
3.1 Introduction ... 154
3.2 Description of the Indiana University ROxLIF instrument ... 154
3.2.1 Experimental apparatus ... 155
3.2.2 Quantification of OH fluorescence signals using FAGE and ROxLIF ... 161
3.2.3 Calibration of the instrument ... 163
3
3.3.1 F0AM ... 170
3.3.2 Chemical mechanism ... 170
3.4 Characterization of the instrument ... 171
3.4.1 HO2 Wall loss in the conversion flow-tube ... 172
3.4.2 Dependence of the RO2-to-HO2 conversion chemistry on operating conditions ... 174
3.4.3 Calibration of COH and CHO2 ... 185
3.4.4 Calibration of CHO2FT and CRO2FT ... 189
3.4.5 Conclusions about calibrations ... 194
3.4.6 Figures of merit under laboratory conditions ... 195
3.5 Deployment at the Indiana University Research and Teaching Preserve ... 196
3.5.1 Ambiant (outdoor) campaign ... 197
3.5.2 Indoor campaign ... 205
3.5.3 Figures of merit under field conditions ... 207
3.6 Conclusions ... 209
3.7 References ... 212
Chapter 4. Preliminary analysis of the ROx intercomparison campaign ... 232
4.1 Introduction ... 232
4.2 Description of the Helios chamber and the conducted experiments ... 235
4.2.1 Characteristics of the HELIOS chamber ... 235
4.2.2 Instruments coupled to HELIOS ... 236
4.2.3 Description of HELIOS experiments ... 239
4.2.4 Description of the PERCA calibrations ... 242
4.3 Comparison between measured peroxy radicals ... 245
4
4.3.2 Ozonolysis experiments under dark conditions ... 257
4.3.3 Conclusions ... 268
4.4 Modeling comparison ... 271
4.4.1 Oxalyl chloride photolysis experiments ... 271
4.4.2 Ozonolysis experiments under dark conditions ... 280
4.5 conclusion ... 288
4.6 References ... 290
5
List of Figures
CHAPTER 1
Figure 1.1 Simplified schematic of tropospheric photochemistry ... 22
Figure 1.2 Reaction schematic of the ozonolysis of an alkene ... 25
Figure 1.3 Contributions of initiation processes to the total initiation rate of ROx radicals in a forested area………..…. ... 26
Figure 1.4 Contributions of initiation processes to the total initiation rate of ROx radicals in Mexico City during MILAGRO 2006. ... 27
Figure 1.5: OH and HO2 production rates during the ORION99 campaign. ... 28
Figure 1.6 Reaction mechanism of isoprene oxidation ... 32
Figure 1.7 Schematic mechanism of auto-xidation ... 33
Figure 1.8 Propagation rates of OH, HO2 and RO2 radicals in a forested and urban environments….35 Figure 1.9 Contributions of termination reactions to the total termination rate of ROx radicals in the urban environment of Mexico City. ... 37
Figure 1.10 Contributions of termination reactions to the total loss rate of ROx radicals in a forested area. ... 38
Figure 1.11 Schematic of the ROx-CIMS instrument ... 42
Figure 1.12 Schematic representation of the PEroxy Radical Chemical Amplification system ... 44
Figure 1.13 Amplification chemistry of a PERCA system. ... 45
Figure 1.14 Dependence of the PERCA CL on both CO (a) and NO (b) ... 48
Figure 1.15 Dependence of the PERCA CL on relative humidity . ... 49
Figure 1.16 RH-dependence of the CL for both PERCA and ECHAMP. ... 51
Figure 1.17 University of Lille-FAGE instrument ... 53
Figure 1.18 Schematic of the ROx-LIF instrument ... 56
Figure 1.19 ROx-LIF - Relative detection sensitivity for HO2 and CH3O2 as a function of the gas residence time in the conversion flow-tube. ... 57
Figure 1.20 ROx-LIF - Relative sensitivity for HO2 and CH3O2 as a function of NO in the conversion flow-tube …………. ... 58
Figure 1.21 Cross-section view of the calibrator based on the water-vapor UV-photolysis technique .. 61
6 CHAPTER 2
Figure 2.1 Schematic of the IMT Lille Douai PERCA instrument ... 102
Figure 2.2 Chain length dependences on reagent gases for the PERCA (CO/NO) approach. ... 110
Figure 2.3 Chain length dependences on reagent gases for the ECHAMP (ethane/NO) approach. ... 112
Figure 2.4 Scatter plot of ΔNO2 with HO2 for the ECHAMP approach.. ... 114
Figure 2.5 Dependences of experimental and modeled CL on RH for the PERCA ... 116
Figure 2.6 Dependence of T(RO2) (ECHAMP approach) on average organic nitrate yields. ... 119
Figure 2.7 Peroxy radical measurements performed in Douai (France) by chemical amplification using the PERCA approach ... 120
Figure 2.8 Peroxy radical measurements performed in a mobile photo-reactor during the CERVOLAND 2018 field campaign ... 122
Figure S2.9 Schematics of a home-made 3D printed nylon injector... 126
Figure S2.10 Sequence of steps required for the measurement of a peroxy radical mixing ratio. ... 127
Figure S2.11 kw(HO2) and kw(50%C2H5O2+50%HO2) measured at 23±2 °C for the PFA inlet ... 129
Figure S2.12 Two reactors operated in background mode for a duration of 12 hours to estimate limits of detection……….. ... 130
Figure S2.13 Dependence of the CL on NO for reactors made of different types of materials ... 131
Figure S2.14 Dependence of the CL on ethane for reactors made of different types of materials ... 131
CHAPTER 3 Figure 3.1 Schematic of the IU ROxLIF instrument ... 157
Figure 3.2 OH Rovibrational peaks observed near 308 nm during laboratory experiments. ... 159
Figure 3.3 Schematic of the IU LIF-FAGE instrument. ... 160
Figure 3.4 Schematic of the ROxLIF and FAGE calibration source ... 164
Figure 3.5 Ozone-photodiode signal relationship for the ROx calibrator ... 166
Figure 3.6 Quantification of OH wall losses inside the calibrator. ... 167
Figure 3.7 HO2 wall loss inside the calibrator ... 168
Figure 3.8 HO2 wall loss in the conversion flow-tube ... 173
Figure 3.9 Time scale of the CH3O2 conversion chemistry. ... 176
Figure 3.10 Time scale of the CH3O2 conversion chemistry. ... 177
7
Figure 3.12 Simulations of the CH3O2 conversion chemistry – NO dependence. ... 179
Figure 3.13 Dependence of the C2H5O2 conversion chemistry on NO... 180
Figure 3.14 Simulations of the CH3O2 conversion chemistry – CO dependence. ... 182
Figure 3.15 Experimental and modeled dependences of the C2H5O2 conversion chemistry on CO .... 183
Figure 3.16 Model simulations of the CH3O2 conversion chemistry – Pressure dependence.. ... 184
Figure 3.17 FAGE OH & HO2 sensitivity factors as a function of water mixing ratios. ... 187
Figure 3.18 Calibration of the ROxLIF sensitivity towards CH3O2 and HO2 radicals. ... 189
Figure 3.19 ROxLIF CH3O2 & HO2 sensitivity factors as a function of water mixing ratios. ... 190
Figure 3.20 Experimental and modeled dependences of CHO2FT on the flow-tube residence time. ... 192
Figure 3.21 Experimental and modeled dependences of CCH3O2FT on the flow-tube residence time. .. 193
Figure 3.22 Limits of detection for HO2 and RO2 under laboratory conditions.. ... 196
Figure 3.23 Map of the sampling site ... 198
Figure 3.24 Time series of NO, NO2, J(NO2), O3, T, RH, and H2O from July 17 to July 24, 2019 during the iRACE field campaign. ... 202
Figure 3.25 Time series of RO2 and HO2 from July 17 to July 24, 2019 during the iRACE field campaign. ... 204
Figure 3.26 10 mins average ratios of [HO2] over [HO2]+[RO2] measured between 7:00 AM and 7:00 PM during the iRACE campaign. ... 205
Figure 3.27 Indoor measurements of RO2 and HO2 during mopping activities on August 2nd. ... 207
Figure 3.28 Limits of detection for HO2 and RO2 measurements for a duration of 2.5 hours. ... 208
CHAPTER 4 Figure 4.1 Picture of the chamber. ... 236
Figure 4.2 Average calibration curve of the chemical amplifier CL during the peroxy radical intercomparison. ... 244
Figure 4.3 Peroxy radical and ancillary measurements for 8 October 2018.. ... 248
Figure 4.4 Scatter plot between PERCA and SAMU measurements for 8 October 2018. ... 249
Figure 4.5 Scatter plot between FAGE and SAMU measurements for 8 October 2018... 249
Figure 4.6 Peroxy radical measured when the chamber is brought under dark conditions - PERCA 251 Figure 4.7 Peroxy radical decay rates observed by PERCA and SAMU ... 252
8
Figure 4.9 Scatter plot between PERCA and SAMU measurements for 12 October 2018. ... 256 Figure 4.10 Scatter plot between FAGE and SAMU measurements for 12 October 2018... 256 Figure 4.11 Peroxy radical and ancillary measurements during the 1-pentene ozonolysis experiment at HELIOS on the 10 October 2018. ... 260 Figure 4.12 Scatter plots between PERCA and SAMU measurements data on the 10 October 2018 . 261 Figure 4.13 Scatter plots between FAGE and SAMU measurements data on the 10 October 2018…….261 Figure 4.14 Peroxy radicals and ancillary measurements during the α-pinene ozonolysis experiment at HELIOS on the 15 October 2018. ... 265 Figure 4.15 Scatter plot between PERCA and SAMU measurements on the 15 October 2018 ... 266 Figure 4.16 Scatter plots between FAGE and SAMU measurements on the 15 October 2018 ... 267 Figure 4.17 Scatter plot of the difference observed between PERCA and SAMU during ozonolysis experiments vs. O3 mixing ratios. ... 269 Figure 4.18 Impact of O3-pentene and O3-α pinene reactions on NO2 production in the PERCA reactors run under amplification and background modes.. ... 270 Figure 4.19 Model-measurement comparison of peroxy radicals for the 8 October experiment – H2/(ClCO)2……… ... 275 Figure 4.20 Comparison of measured and modelled (ClCO)2 mixing ratios for the 8 October experiment………. ... 275 Figure 4.21 Model-measurement comparison of peroxy radicals for the 12 October experiment – H2/ CH4/(ClCO)2……. ... 278 Figure 4.22 Comparison of measured and modelled (ClCO)2 mixing ratios for the 12 October experiment. ... 278 Figure 4.23 Model-measurement comparison of peroxy radicals for the 10 October experiment – 1-pentene/O3……. ... 282 Figure 4.24 Comparison of measured and modeled mixing ratios of 1-pentene and ozone. ... 283 Figure 4.25 Modelled OH and speciation of peroxy radicals for the pentene/O3 experiment. ... 283 Figure 4.26 Model-measurement comparison of peroxy radicals for the 15 October experiment – α-pinene/O3…….. ... 285 Figure 4.27 Modelled OH and speciation of peroxy radicals for the α-pinene/O3 experiment... 286 Figure 4.28 Most abundant RO2 species simulated for the α-pinene/O3 experiment. ... 287
10
List of Tables
CHAPTER 1
Table 1.1 Rate constants and Lifetimes of selected VOCs with OH, O3 and NO3 during daytime and
nighttime……….21
Table 1.2 ROx-LIF - Experimental relative sensitivity for different RO2 radicals ... 59
Table 1.3 Summary of established ROx measurement techniques ... 64
CHAPTER 2 Table 2.1 Summary table of targeted VOCs. ... 108
Table 2.2 Operating conditions for the PERCA and ECHAMP approaches ... 113
Table 2.3 RO2 to HO2 transmission – T(RO2 ... 118
Table S2.4 Reaction scheme used to model the CL for PERCA and ECHAMP. ... 133
CHAPTER 3 Table 3.1 Specification of the chemical mechanisms used in this study ... 171
Table 3.2 Time scale of the RO2 conversion chemistry - comparison of different sets of operating conditions……….175
Table 3.3 Time scale of the RO2 conversion chemistry – Impact of OH and RO2 wall loss rates ... 177
Table 3.4 Characteristics of the IU-ROx-LIF instrument. ... 185
Table 3.5 Conversion of organic peroxy radicals into HOx in the FAGE detection cell. ... 188
Table 3.6 Experimental sensitivity factors for CH3O2 and HO2 at different residence times. ... 191
Table 3.7 Measured relative sensitivity of the ROxLIF instrument for different RO2 ... 194
Table 3.8 Characteristics of the instruments used during iRACE by various institutions ... 200
CHAPTER 4 Table 4.1 Specifications of instruments used during the peroxy radical intercomparison ... 237
Table 4.2 Experiments conducted during the peroxy radical intercomparison ... 240
Table 4.3 Experimental conditions on 8 October 2018 - H2 / (ClCO)2 ... 246
Table 4.4 Experimental conditions on 12 October 2018 (H2/CH4/(ClCO)2) ... 253
Table 4.5 Experimental conditions on 10 October 2018 (1-pentene/O3)... 258
11
Table 4.7 Specifications of the model used to simulate radical concentrations in the H2/(ClCO)2 and H2/CH4/(ClCO)2 experiments. ... 273 Table 4.8 Specifications of the model used to simulate radical concentrations in the pentene/O3 and α-pinene/O3 experiments... 280
12
14
General Introduction
The troposphere is the region of the Earth's atmosphere in which we live and into which many chemical compounds are emitted as a result of biogenic processes and human activities. These compounds, emitted from both natural and anthropogenic sources (Atkinson, 2000; Koppmann, 2007), undergo physicochemical transformations that affect both air quality and climate. Indeed, these emissions contribute to smog and acid rain formation, stratospheric ozone depletion, and global warming (Kerr, 1991; Madronich et al., 2015). The discovery of these environmental issues has increased the worldwide interest to investigate atmospheric chemistry during recent decades, with the goal to develop efficient strategies to mitigate their consequences. Large amounts of volatile organic compounds (VOCs) are emitted into the troposphere with an estimated flux of 1250 Tg year-1 (1012 g) (Atkinson and Arey, 2003), approximately 140 Tg year-1 due to anthropogenic activities(Goldstein and Galbally, 2007) and the rest from biogenic emissions (Guenther et al., 1995, 2012; Sindelarova et al., 2014). Our atmosphere has the ability to remove most of these pollutants through oxidation processes initiated by several oxidants such as the hydroxyl (OH) and nitrate (NO3) radicals, chlorine atoms (Cl) and ozone (O3) (Monks, 2005).
Among these species, OH plays a key role in the self-cleaning capacity of the atmosphere (Montzka et al., 2011) due to its high reactivity with both organic and inorganic species (lifetime lower than a second), and drives the lifetime of most VOCs. Although atmospheric concentrations of OH are usually small, ranging from a few 105 cm-3 at night up to 2×107 cm-3 during the day (Heard and Pilling, 2003; Monks, 2005), its important role in atmospheric oxidation is due to a radical reaction cycle initiated when OH reacts with VOCs, which leads to the production of organic peroxy (RO2)
and hydroperoxy (HO2) radicals, which can then recycle back to OH through reactions with
nitrogen monoxide (NO).
Peroxy radicals (HO2 + RO2) are also short-lived species (lifetime of a few tens seconds)
playing an essential role in the formation of ozone (Atkinson, 2000) and secondary organic aerosols (Kroll and Seinfeld, 2008a), with both of these secondary pollutants being formed in smog episodes. The oxidizing capacity of the global atmosphere of the Earth is mainly controlled by OH, and as a consequence peroxy radicals due to their propagation to OH, whose spatial distribution has a major impact on the concentration and distribution of greenhouse gases. Thus, understanding the variability of these radicals, along with their souces and sinks is crucial to
15
evaluate future changes of the chemical composition of the atmosphere, with implications for both air quality and climate change.
Measurements of atmospheric peroxy radicals, which are present at low concentrations (106-109 cm-3) and that exhibiting short lifetimes require sensitive and selective techniques. Various instruments using different experimental approaches have been developed over the last few decades to measure peroxy radicals, including Matrix Isolation Electron Spin Resonance spectroscopy (MIESR) (Mihelcic et al., 2003, 1985), Laser-Induced Fluorescence-Fluorescent Assay by Gas Expansion (LIF-FAGE) (Stevens et al., 1994a; Hendrik Fuchs et al., 2008; Dusanter et al., 2009b; Faloona et al., 2004; Heard, 2006) and the ROxLIF variant(Hendrik Fuchs et al., 2008; Whalley et al., 2018a) , Chemical Ionization Mass Spectrometry (CIMS) (Albrecht et al., 2019; Edwards et al., 2003; Hornbrook et al., 2011; Kukui et al., 2008a) and Chemical Amplification (CA, PERCA: PEroxy Radical Chemical Amplifier, ECHAMP: Ethane-Based Chemical Amplification) (Cantrell et al., 1984; Hernández et al., 2001; Kartal et al., 2010; Liu et al., 2009; Wood and Charest, 2014). However, it was recently highlighted that some of these techniques may suffer from interferences (Fuchs et al., 2011; Stone et al., 2012) and it is therefore important to improve our technological understanding of peroxy radical measurements. This is a prerequisite for accurate field measurements as well as for kinetic studies of atmospheric reactions in the laboratory.
The main objective of this work is to improve our knowledge on two measurements techniques: Chemical Amplification and ROxLIF. CA is an indirect technique for measuring the sum of peroxy radicals (HO2+RO2) whose simplicity and low cost make it attractive for intensive
field measurements. This technique involves the chemical conversion of all peroxy radicals into nitrogen dioxide (NO2) and its subsequent quantification using an NO2 analyzer. The ROxLIF
technique allows measuring both HO2 and the sum of organic peroxy radicals (RO2) separately
through a selective conversion of these radicals into OH, which is then quantified by laser induced fluorescence at low pressure (Fuchs et al., 2010, 2008). During this work, a CA instrument was built, characterized and tested for field measurements at IMT Lille Douai, France, while the ROxLIF technique was implemented on an existing FAGE instrument and tested in the field at
Indiana University, United States.
The first chapter of this manuscript describes the tropospheric chemistry involving initiation, propagation and termination reactions of ROx radicals (OH, HO2, RO and RO2) and
16
provides a brief overview of field measurements for these species. The instruments developed for ROx measurements in ambient air are also described. This chapter ends by introducing the
objectives of the work reported manuscript herein.
Chapter 2 describes the development of a dual channel CA at IMT Lille Douai. This chapter reports the characterization of two different amplification chemistries based on the PERCA (PEroxy Radical Chemical Amplifier) and ECHAMP (Ethane-Based Chemical Amplification) approaches. This characterization work consisted in the optimization of reagent gases, the quantification of radical wall losses inside the instrument, and the calibration of the instrument’s response (and its humidity dependence) to different peroxy radicals. Both laboratory experiments and model simulations were used to provide a detailed description of the two amplification chemistries. Finally, the instrument was tested by performing ambient measurements.
Chapter 3 describes the construction and characterization of the ROxLIF conversion flow-tube that was coupled to the existing Indiana University-FAGE instrument. Similar to the CA apparatus, a combination of laboratory experiments and model simulations were used to characterize optimum conditions for the addition of reagent gases, to assess radical wall losses in the conversion flow-tube and to calibrate the instrument’s sensitivity to both HO2 and RO2 radicals.
This chapter also reports the first deployment of the Indiana University-ROxLIF for outdoor and indoor measurements of peroxy radicals.
Chapter 4 reports an intercomparison of the CA developed in this study with a ROxLIF
instrument developed at the University of Lille (PC2A laboratory) and a CIMS instrument from the LPC2E laboratory (University of Orleans). This intercomparison exercise was conducted at the HELIOS chamber (ICARE, Orleans) where different pools of peroxy radicals were generated in the chamber under dark and irradiated conditions using different chemical systems. This chapter describes the agreement between the different instruments and shows how the measurements compare to preliminary box model simulations.
18
20
Chapter 1. Bibliographical Context
This chapter provides a detailed description of the chemistry of peroxy radicals in the atmosphere and highlights their initiation, propagation and termination pathways. The different techniques used for measuring ROx (OH, HO2, RO2) radicals in the atmosphere and their suitability
for field measurements are also discussed. Finally, a brief overview of their measurements in the field is presented.
1.1 Tropospheric Chemistry of ROx radicals
The fate of volatile organic compounds (VOCs) in the troposphere depends on physical processes such as wet and dry depositions (Chen et al., 2019; Mellouki et al., 2015) as well as chemical processes, including direct photolysis and chemical reactions with oxidants such as OH (hydroxyl radical), NO3 (nitrate radical) and O3 (ozone). Table 1 reports rate constants of a few
selected anthropogenic and biogenic VOCs with these different oxidants and their associated lifetimes. Oxidation reactions initiated by OH are thought to be the most important during daytime due to its high reactivity (bimolecular rate constants usually ranging from 10-13 up to 10-10 cm3 molecule-1 s-1). While O3 only reacts with unsaturated VOCs with bimolecular rate constants that
are several orders of magnitude lower than for OH, its larger concentration can balances its lower reactivity and this oxidant is also important during daytime. For instance, sesquiterpenes (-carryophylene in Table 1.1) exhibits a lifetime with respect to O3 oxidation that is smaller than for
OH oxidation. Interestingly, NO3 oxidation is not important during the day due to its efficient
photolysis its reaction with NO, however, its build-up in the dark conditions can lead to a significant impact of this oxidant on VOC oxidation rates at night such as seen for α-pinene.
21
Table 1-1 Rate constants and Lifetimes of selected VOCs with OH, O3 and NO3 during daytime and nighttime. VOC Rate constant (298 K) (cm3 molecule-1 s-1) Lifetime (days) OH O3 NO3 Daytime OHa O3b Nighttime O3c NO3d Methane 6.4×10⁻¹⁵* - 1.0×10⁻¹⁸∞ 3.6×10³ 2.3×10⁶ Hexane 5.2×10⁻¹²** - 1.1×10⁻¹⁶ ͋ 4.5 2.0×10⁴ Toluene 6.1×10⁻¹²*** - 7.0×10⁻¹⁷ ͋ 3.8 3.3×10⁴ Isoprene 1.0×10-10* 1.3×10-17 ͋ 7.0×10⁻¹³ ͋ 0.2 2.6 6 3.3 α-pinene 5.3×10-11* 8.4×10-17 ͌ 6.2×10⁻¹² ͋ 0.4 0.4 0.9 0.4 -carryophylene 2.0×10⁻¹⁰ ͌ 1.2×10⁻¹⁴ ͌ 0.1 2.8×10⁻³ 6.6×10⁻³
*Atkinson et al., 2006; **Atkinson, 2003; ∞Atkinson et al., 1997; ***Atkinson, 2007; ͌ (R. Atkinson, 1997); ͋ (Atkinson and Arey,
2003), aAssuming the day time (6am- 6pm) [OH] = 106 molecules cm-3, b Assuming the day time (6am- 6pm) [O
3] = 7×10¹¹
molecules cm-3, c Assuming the night time (6pm-6am) [O
3] = 3×10¹¹ molecules cm-3, d Assuming the night time (6pm-6am),
[NO3] = 107 molecules cm-3
The reaction of a VOC with OH will lead to the formation of an organic peroxy radical (RO2) through the addition of OH to an unsaturated carbon or the abstraction of an hydrogen. RO2
will then react with NO (NO > approx. 100 ppt) to form an alkoxyl radical (RO), which will further react with O2, isomerize or decompose to produce the hydroperoxyl (HO2) radical. HO2 is known
as a temporary reservoir of OH since it subsequently react with NO (or O3) to reform OH
(Finlayson-Pitts and Jr, 2000). It is interesting to note that the oxidation of VOCs initiated by either O3 or NO3 will also lead to the formation of peroxy radicals and OH, which will then increase the
pool of ROx (OH, HO2, RO2) radicals involved in the cycling chemistry shown in Figure 1.1.
This fast cycling of radicals controls many aspects of atmospheric chemistry such as the formation of ozone, through the conversion of NO into NO2 when peroxy radicals react with NO,
and the formation of secondary organic aerosols (Finlayson-Pitts and Jr, 2000). This radical cycling also controls the removal of the most abundant atmospheric VOCs such as methane and other greenhouse gases that affect the radiative balance of the atmosphere (Monks, 2005). Because of
22
the important role played by both OH and peroxy radicals in the atmosphere, their sources and sinks have been the subject of intensive research as summarized in recent reviews (Clemitshaw, 2004; Heard and Pilling, 2003; Monks, 2005; Stone et al., 2012).
Figure 1.1 Simplified schematic of tropospheric photochemistry (adapted from Ren et al., 2009)
The reactions shown in Figure 1.1 can be grouped in 3 categories to characterize the ROx
chemistry: initiation (grey), propagation (red), and termination (purple):
Initiation reactions (radical sources) lead to radical production from closed-shell molecules. For instance, HONO photolysis leads to the formation of OH.
Propagation reactions lead to the conversion of one radical species into another one. For instance, HO2 propagates to OH by reaction with NO.
Termination reactions (radical sinks) occur when two radical species react with each other to form a closed-shell molecule. For instance, OH is terminated through its reaction with NO2 to form nitric acid (HNO3).
23 1.1.2 Radical Initiation
1.1.2.1 Initiation pathways
On a global scale, OH is primarily initiated as a result of ozone photolysis at wavelengths less than 310 nm, resulting in the formation of an excited oxygen atom, O(1D), as shown in R1. Collisions of O(1D) with ambient oxygen or nitrogen molecules (M in R2) quench it back to its ground atomic state, O(3P), which subsequently reacts with molecular oxygen to reproduce O3.
However, the large abundance of water vapor in the troposphere opens a path for collisions of O(1D) with H2O towards the formation of hydroxyl radicals, as shown in R3.
R1 𝑂3+ ℎ𝑣 → 𝑂2+ 𝑂(1𝐷) 𝜆 < 310 𝑛𝑚
R2 𝑂(1𝐷) + 𝑀 → 𝑂(3𝑃) + 𝑀
R3 𝑂(1𝐷) + 𝐻2𝑂 → 2 𝑂𝐻
The fraction of O(1D) atoms that forms OH depends on the water-vapor concentration. In the lower troposphere where the water concentration is fairly high (mixing ratios ranging from 1-3%), approximately 10% of O(1D) reacts with H2O leading to form OH (Monks, 2005).
While R1 and R3 are the main contributors to the formation of OH in the global troposphere (Monks, 2005), there are additional sources (see Figure 1.1) involving the photolysis of OH-precursors such as nitrous acid (HONO) (R4) and hydrogen peroxide (H2O2) (R5).
R4 𝐻𝑂𝑁𝑂 + ℎ𝑣 → 𝑂𝐻 + 𝑁𝑂 𝜆 < 400𝑛𝑚
R5 𝐻2𝑂2+ ℎ𝑣 → 2𝑂𝐻 𝜆< 366 𝑛𝑚
The photolysis of HONO (R4) at short wavelengths (300-400 nm) acts as an important source of OH radicals in ozone-deficient polluted air masses (Finlayson-Pitts and Jr, 2000). HONO usually
24
accumulates during nighttime and provides an early morning pulse of radical formation shortly after sunrise, before O3 photolysis becomes important since HONO is photolyzed at longer
wavelengths than O3 (Spataro and Ianniello, 2014) .
Another initiation route of OH that has received a lot of attention is the reaction of ozone with unsaturated VOCs such as alkenes (Paulson and Orlando, 1996; Johnson and Marston, 2008). This type of reactions does not require photons and can also operating at night in contrast to the photolytic sources (R1-R5). The exact mechanism for ozonolysis reactions differ between the various alkenes, but a large fraction of the products are radicals. For instance, the reaction of the simplest alkene (ethene, C2H4) is believed to proceed by the formation of a biradical species,
CH2OO (R6), also known as a Criegee intermediate, whose subsequent decomposition produces
HOx (OH, HO2) radicals.
R6 𝑂3+ 𝐶2𝐻4 →→ 𝐶𝐻2𝑂𝑂 + 𝐶𝐻2𝑂
A more general mechanism for the ozonolysis of alkenes is thought to proceed through the reaction of ozone with alkene to produce an energy-rich primary ozonide (Path 1 in Figure 1.2). The decomposition (Path 2) of this ozonide produces a carbonyl and a Criegee intermediate (red box) (Baker et al., 2002; Kroll et al., 2001). The Criegee intermediate can be formed in either syn or anti configuration. The Criegee intermediate maintains an excess of energy of the excited ozonide, and can decompose (Path 3a-3b) or become stabilized (Path 4) through collisions with the bath gas by transferring its energy. The OH generated during alkene ozonolysis is typically the result of syn-Criegee intermediate decomposition, but anti-syn-Criegees have shown to contribute up to one third of the OH yield (Kroll et al., 2001).
25
Figure 1.2: Reaction schematic of the ozonolysis of an alkene (Kroll et al., 2001).
The photolysis of Oxygenated VOCs (OVOCs) that are of primary origin, i.e. emitted in the atmosphere by natural or anthropogenic sources, or secondary origin, i.e. produced during the oxidation of primary VOCs, can also act as an important source of ROx radicals. For instance,
formaldehyde (HCHO), glyoxal (CHOCHO), and other dicarbonyls such as methyl glyoxal (CH3C(O)CHO) can easily be photolyzed to produce two radical species.The photolysis of HCHO
at short wavelengths (λ < 334 nm), an important HOx radical source in the remote atmosphere
(Fleming et al., 2006), can produce two HO2 radicals as shown in reactions R7-R9 (Monks, 2005).
R7 𝐻𝐶𝐻𝑂 + ℎ𝑣 → 𝐻 + 𝐻𝐶𝑂 𝜆 < 334 𝑛𝑚
R8 𝐻𝐶𝑂 + 𝑂2 → 𝐻𝑂2+ 𝐶𝑂
R9 𝐻 + 𝑂2+ 𝑀 → 𝐻𝑂2+ 𝑀
The thermal decomposition of Peroxyacyl Nitrates (RC(O)O2NO2) which only formed from
the peroxyacetyl radicals and NO2, known as PAN species, is an additional source of organic
peroxy radicals in the lower troposphere. Peroxy acetyl nitrate (CH3C(O)O2NO2) is the most
abundant PAN species in the troposphere, with typical atmospheric mixing ratios ranging from a few ppt in the remote marine boundary layer to several ppbv in heavily polluted urban regions. Its decomposition into peroxy acetyl radicals (CH3C(O)O2) as shown in R10 is very sensitive to
temperature (Zheng et al., 2011), with a PAN lifetime ranging from about 30 minutes at 298 K to 8 h at 273 K. This behavior makes PAN species important sources of peroxy radicals and NOx
26
if the decomposition rate is lower than the formation rate, PAN formation becomes a net sink of peroxy radical
R10 𝐶𝐻3𝐶(𝑂)𝑂2𝑁𝑂2 → 𝐶𝐻3𝐶(𝑂)𝑂2+ 𝑁𝑂2
1.1.2.2 Comparison of initiation rates between different types of environments
The importance of each type of initiation reactions has been studied in environments characterized by different VOC emissions and NOx levels such as forested areas (Wolfe et al., 2011; Whalley et al., 2012; Griffith et al., 2013a; Heard and Pilling, 2003; Stone et al., 2012), urban areas (Heard and Pilling, 2003; Dusanter et al., 2009b; Volkamer et al., 2010; Stone et al., 2012), and the remote marine boundary layer (Berresheim et al., 2002; Creasey et al., 2003; Heard and Pilling, 2003; Stone et al., 2012). For instance, an investigation of the ROx radical budget in a
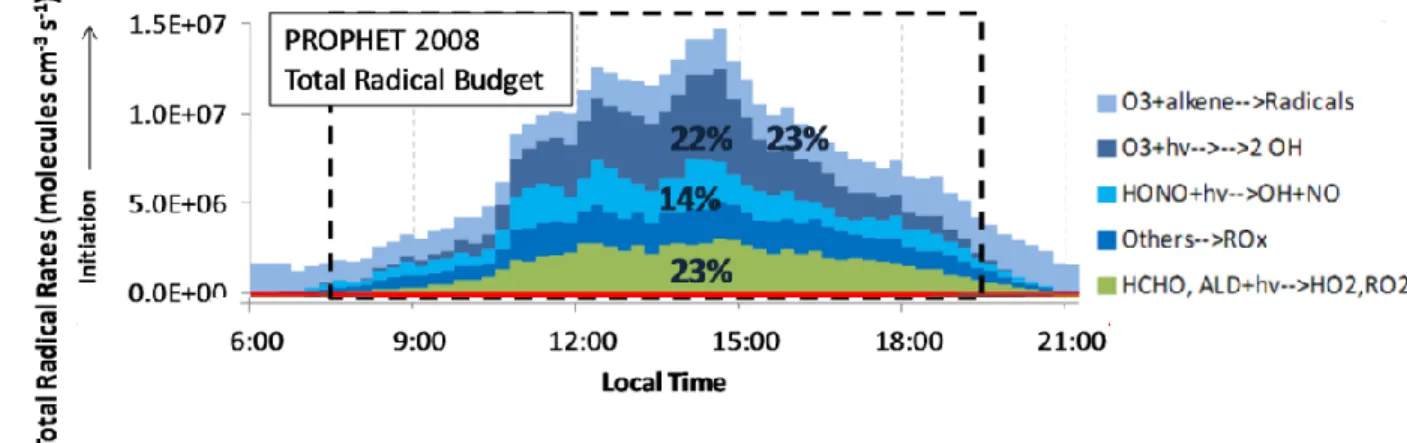
low-NOx/high-isoprene forested environment (Griffith et al., 2016) revealed that photolytic processes
(R1-R3, R4, R5 and R7) are the main sources of radicals as shown in Figure 1.3 (73% of the total initiation rate on average). For the campaign average, photolysis of O3, HCHO and HONO
contributed to 22%, 23% and 14% of the total initiation rate, respectively. The contribution of ozonolysis reactions was also significant and account for 23% of the total initiation rate.
Figure 1.3: Contributions of initiation processes to the total initiation rate of ROx radicals in a forested area (Griffith et al., 2013a).
For urban areas as shown in Figure 1.4, which are characterized by high emissions of anthropogenic species (VOCs and NOx), the photolysis of HONO is the main contributors for
radical initiation, usually overpassing ozone photolysis. For example, a radical budget analysis performed in Mexico City during the 2006 MILAGRO campaign (Dusanter et al., 2009b) shows
27
that HONO photolysis accounted for 35% of the total ROx initiation rate, which is approximately
6 times larger than O3 photolysis in this environment. The impact of O3-alkene reactions and
HCHO photolysis was also significant with contributions in the range of 19-25 % to the total ROx
initiation rate.
Figure 1.4: Contributions of individual processes to the total production rate of ROx radicals in Mexico City during MILAGRO 2006. The insert in the upper right panel displays a breakdown of the O3-alkene contribution.
(Dusanter et al., 2009b).
Marine environments are characterized by low concentrations of reactive VOCs (NMHCs and OVOCs) and little or no influence from anthropogenic activities. Figure 1.5 shows the calculated OH and HO2 production rates during the Observations at a Remote Island of Okinawa
intensive field campaign (ORION99) in the northern part Okinawa Island, a subtropical island in Japan (Kanaya et al., 2001a). The major initiation pathways for OH and HO2 are the photolysis of
28
Figure 1.5: OH and HO2 production rates during the ORION99 campaign (Kanaya et al., 2001a).
Photolysis processes are the main contributors to the radical budget in the three different environments discussed above. However, the most important photolysis process depends on the environment. For instance, the photolysis of O3 plays a significant role in the production of radicals
in environments characterized by low NOx emissions such as forested and marine environments.
The photolysis of HONO and formaldehyde are a common sources of radicals in the 3 environments. High daytime HONO concentrations observed in a number of field studies in urban(Acker et al., 2006; Elshorbany et al., 2010; Villena et al., 2011) and rural areas (Kleffmann et al., 2003; He et al., 2006; Zhou et al., 2011) makes it most important source of radicals in these environments.
of non-photolytic processes, the O3-alkene reactions make a dominant contribution for the radical
budget in urbanized areas and forests where the emissions of anthropogenic or biogenic unsaturated VOCs are important.
29 1.1.3 Radical Propagation
As shown in Figure 1, there are various reactions leading to the propagation of ROx radicals. For
the sake of clarity, below we present 4 groups of reactions leading to (1) the propagation of OH (but also NO3 and Cl) to peroxy radicals, (2) the propagation of RO2 to HO2, (3) the propagation
of peroxy radicals to OH, and finally (4) the interconversion between OH and HO2.
1.1.3.1 Propagation from oxidants (OH, NO3, Cl) to peroxy radicals (RO2, HO2)
In the remote troposphere, OH predominantly reacts with CO (R11) and CH4 (R12), the
second most efficient anthropogenic climate-forcing gas after carbon dioxide, to form HO2 (R9)
and the methyl peroxy (CH3O2) radical (R13).
R11 𝑂𝐻 + 𝐶𝑂 → 𝐶𝑂2+ 𝐻
R9 𝐻 + 𝑂2+ 𝑀 → 𝐻𝑂2+ 𝑀
R12 𝑂𝐻 + 𝐶𝐻4 → 𝐻2𝑂 + 𝐶𝐻3
R13 𝐶𝐻3+ 𝑂2+ 𝑀 → 𝐶𝐻3𝑂2+ 𝑀
OH can also react with formaldehyde (R14 and R8) and hydrogen peroxide (H2O2) (R15) to form HO2:
R14 𝑂𝐻 + 𝐻𝐶𝐻𝑂 → 𝐶𝐻𝑂 + 𝐻2𝑂
R8 𝐻𝐶𝑂 + 𝑂2 → 𝐻𝑂2+ 𝐶𝑂
R15 𝐻2𝑂2+ 𝑂𝐻 → 𝐻𝑂2 + 𝐻2𝑂
In areas impacted by biogenic or anthropogenic emissions, reactions of OH with larger VOCs lead to its propagation to organic peroxy radicals (RO2), which in turn react further to form closed-shell
30
(Atkinson and Arey, 2003). It is interesting that the reaction of, the initial reaction for the oxidation of alkanes (R14) proceeds through a hydrogen abstraction:
R14 𝑅𝐻 + 𝑂𝐻 → 𝑅 + 𝐻2𝑂
R15 𝑅 + 𝑂2+ 𝑀 → 𝑅𝑂2+ 𝑀
Reaction R14 leads to the formation of an alkyl radical (R), which then quickly reacts with ambient oxygen to form an organic peroxy radical (R15).
As mentioned previously, NO3 oxidation also plays an important role in atmospheric
chemistry (Jenkin and Clemitshaw, 2000). Since most initiation routes of OH are photolytic (R1-R5), NO3 becomes the most important alternative to OH oxidation at night, where it rapidly reacts
with VOCs to propagate to peroxy radicals (R16 and R15) (Geyer et al., 2001). It is interesting to note that the reaction of NO3 with HO2 provides a night-time source of OH radicals (R17).
R16 𝑁𝑂3+ 𝑅𝐻 → 𝐻𝑁𝑂3+ 𝑅
R17 𝑁𝑂3+ 𝐻𝑂2 → 𝑂𝐻 + 𝑁𝑂2+ 𝑂2
In the marine boundary layer, the chlorine (Cl) radical chemistry can also enhance the tropospheric hydrocarbon oxidation. The photolysis of chlorine (Cl2) R18 and nitryl chloride
(ClNO2) provides a daytime sources of Cl atoms (Hossaini et al., 2016). The chlorine radical
quickly abstracts hydrogen from hydrocarbons through reactions similar to that of OH radicals, producing alkyl (R19) and alkylperoxy (R15) radicals.
R18 𝐶𝑙2+ ℎ𝑣 → 𝐶𝑙 + 𝐶𝑙
31
1.1.3.2 Propagation from RO2 to HO2
Organic peroxy radicals can either (i) react with peroxy radicals from the same type or other types or (ii) with NOx species (NO and NO2). Reactions of peroxy radicals with closed-shell
molecules are sufficiently slow to be negligible at tropospheric temperatures. Under sufficiently high NO (NO > approx.. 100 ppt), reactions of peroxy radicals with NO will dominate leading to radical propagation (R20a) through the formation of an alkoxyl radical (RO). It is worth noting that this implies the oxidation of NO into NO2, which in turn can be photolyzed to form ozone.
R20a 𝑅𝑂2+ 𝑁𝑂 → 𝑅𝑂 + 𝑁𝑂2
For instance, the methyl peroxy radical (CH3O2), the most abundant RO2 in the atmosphere, reacts
with NO to form the methoxy radical (CH3O) (R21), which then reacts with oxygen to form HCHO
and to form HO2 (R22).
R21 𝐶𝐻3𝑂2 + 𝑁𝑂 → 𝐶𝐻3𝑂 + 𝑁𝑂2
R22 𝐶𝐻3𝑂 + 𝑂2 → 𝐻𝐶𝐻𝑂 + 𝐻𝑂2
Under low NO conditions (NO < approx. 100 ppt), self- and cross-reactions of peroxy radicals are significant and can also form alkoxy radicals (R23a):
R23a 𝑅𝑂2+ 𝑅𝑂2 → 2𝑅𝑂 + 𝑂2
RO radicals will either react with oxygen as shown above for CH3O above (R22), isomerize or
decompose (Orlando et al., 2003) to form the HO2.
Additional propagation pathways of large organic peroxy radicals have also been recently proposed in the literature. In isoprene-rich environments, HO2 (and OH) can be produced from the
isomerization and decomposition of isoprene-based peroxy radicals (Figure 1.6). For instance, the 1,6-H-shift isomerization of the Z-conformers of the δ-hydroxyperoxy radicals produced from OH
32
addition to the 1 and 4 carbons of isoprene can lead to the production of HO2 radicals and a
C5-hydroperoxy aldehyde (HPALD) (Peeters et al., 2009; Peeters and Müller, 2010).
Figure 1.6 Reaction mechanism of isoprene oxidation (Stavrakou et al., 2010)
In monoterpene-rich environments, the autoxidation of monoterpene-based peroxy radicals have been recently proposed to explain the formation of extremely low volatile organic compounds (ELVOC) (Ehn et al., 2014; Mentel et al., 2015; Zhang et al., 2017). This process is an intramolecular hydrogen shift producing a hydroperoxyalkyl radical represented as QOOH in figure 1.7 for the oxidation of n-hexane (Praske et al., 2018). As shown on this figure, the autoxidation process ultimately leads to the generation of low-volatility molecules and HO2.
33
Figure 1.7 Schematic mechanism of autoxidation (dashed blue box) of the 2,5 RO2 radical (orange box) issuing from OH + n-hexane (Praske et al., 2018).
1.1.3.3 Propagation from HO2 (and other peroxy radicals) to OH
Once HO2 is formed,reaction with NO will produce OH:
R24a 𝐻𝑂2+ 𝑁𝑂 → 𝑂𝐻 + 𝑁𝑂2
Additional pathways exist in the atmosphere to propagate other peroxy radicals to OH. The reaction of RO2 radicals with HO2 can lead to the formation of OH. For instance, the reaction of acetyl
peroxy (CH3C(O)O2) with HO2 (Hasson et al., 2004) shown inR26 has been shown to form OH
with a yield of (0.61 ± 0.09) (Groß et al., 2014).
R25 𝑅𝑂2+ 𝐻𝑂2 → 𝑅𝑂 + 𝑂𝐻 + 𝑂2
R26 𝐶𝐻3𝐶(𝑂)𝑂2+ 𝐻𝑂2 → 𝐶𝐻3𝐶(𝑂)𝑂 + 𝑂𝐻 + 𝑂2
1.1.3.4 Interconversion between OH and HO2
As shown above, the reaction of OH with CO (R11) will convert OH to HO2 and the reaction of
HO2 with NO (R24a) or NO2 will convert it back to OH. In the atmosphere there are other reactions
34
propagation reactions involve reactions of OH and HO2 with ozone (R27-R28). HO2 reacts with
ozone with a rate constant of 2.0×10⁻¹⁵ cm3 molecule−1 s−1 (Atkinson et al., 2004) to form OH:
R27 𝐻𝑂2+ 𝑂3 → 𝑂𝐻 + 2 𝑂2
OH also reacts with O3 with a rate constant of 7.30×10⁻¹⁴ cm3 molecule−1 s−1 (Atkinson et al., 2004)
to produce HO2:
R28 𝑂𝐻 + 𝑂3 → 𝐻𝑂2+ 𝑂2
The rate constant for OH + O3 is approximately 37 times larger than for HO2 + O3 which will favor
partitioning towards HO2.
1.1.3.5 Comparison of propagation rates between different types of environments
The radical propagation rates are mainly dependent on the environment as illustrated in Figure 1.8 for a forested area (green numbers) and an urban area (blue numbers). Under high NOx
concentrations typical of urban environments, organic peroxy radicals quickly react with NO to propagate to HO2 and then OH. The RO2-to-HO2, HO2-to-OH, and OH-to-RO2 propagation rates
are 10-45 times larger for the urban atmosphere of Mexico City compared to the atmosphere of a forested environment as shown in figure 1.8. The lower propagation rates observed in forested areas will lead to lower oxidation rates of VOCs. It is interesting that in the low NOx forested
environments, there is still significant cycling between radicals due to the presence of only 20-100 ppt of NO, whose rates are the same order of magnitude as that observed for HO2 + O3 (R27). The
35
Figure 1.8 Propagation rates of OH, HO2 and RO2 radicals in a forested (green) and urban (dark blue) environments. (Adapted from (Dusanter et al., 2009b; Griffith et al., 2013a))
1.1.4 Radical Termination
1.1.4.1 Termination pathways
The atmospheric cycling of ROx radicals shown in Fig. 1.8 can be terminated by
radical-NOx reactions, which are predominant in urbanized areas where large concentrations of NOx are
present, and by radical recombination reactions in low NOx areas such as remote forested
environments and the marine boundary layer.
In areas characterized by elevated NOx levels, OH reacts with NO2 and produces nitric acid
(HNO3), which will mainly be lost through wet deposition:
R29 𝑂𝐻 + 𝑁𝑂2+ 𝑀 → 𝐻𝑁𝑂3+ 𝑀
NO can also react with OH and HO2, leading to the formation of HONO (R30) and HNO3 (R24b).
However, HONO has a lifetime of less than 1 h during the day due to its efficient photolysis (R4) and should be seen as a temporary reservoir of radicals. R24b is a minor pathway of the HO2 + NO
reaction, with 0.5-4% of the reaction flux leading to the formation of HNO3 (Butkovskaya et al.,
36
R30 𝑂𝐻 + 𝑁𝑂 + 𝑀 → 𝐻𝑂𝑁𝑂 + 𝑀
R24b 𝐻𝑂2+ 𝑁𝑂 + 𝑀 → 𝐻𝑁𝑂3+ 𝑀
The reaction between alkyl peroxy radicals and NO can also act as a significant terminating channel through the formation of organic nitrates (RONO2) as shown in R20b. This reaction is
negligible for short chain organic radicals (C < 4), but becomes increasingly important for radicals with longer chains (Lightfoot et al., 1992). The branching ratio R20b/R20a is as large at 25% for C10 and larger alkyl peroxy radicals (Orlando and Tyndall, 2012).
R20a 𝑅𝑂2+ 𝑁𝑂 → 𝑅𝑂 + 𝑁𝑂2
R20b 𝑅𝑂2+ 𝑁𝑂 + 𝑀 → 𝑅𝑂𝑁𝑂2
Reaction R20b is of importance for ozone production since it does not lead to the conversion of NO into NO2 and by sequestering both RO2 and NO2, organic nitrate formation
reduces ozone production rates. The association reaction between alkoxy radicals and NO (R31) is not important in the atmosphere but can be important in laboratory experiments, especially where high NO concentrations are used to quantify peroxy radicals as described in chapter 2.
R31 𝑅𝑂 + 𝑁𝑂 → 𝑅𝑂𝑁𝑂
In areas characterized by low NOx concentrations, ROx radicals significantly react through cross-
and self-reactions to form peroxide species such as H2O2, ROOR and ROOH (R32, 23b & 33)
(Penkett et al., 1997).
R32 𝐻𝑂2+ 𝐻𝑂2 → 𝐻2𝑂2+ 𝑂2
R23b 𝑅𝑂2+ 𝑅𝑂2 → 𝑅𝑂𝑂𝑅 + 𝑂2
37
R34 𝑂𝐻 + 𝐻𝑂2 → 𝐻2𝑂 + 𝑂2
R35 𝑂𝐻 + 𝑅𝑂2→ 𝑝𝑟𝑜𝑑𝑢𝑐𝑡𝑠
Interestingly, R35 has been neglected until recently when the rate constants between OH and RO2
radicals have been measured experimentally (Assaf et al., 2017; Bossolasco et al., 2014; Faragó et al., 2015). It has been shown that this type of reactions is extremely fast and can be of importance at remote locations and for the marine boundary layer (Fittschen et al., 2014).
1.1.4.2 Comparison of termination rates between different types of environments
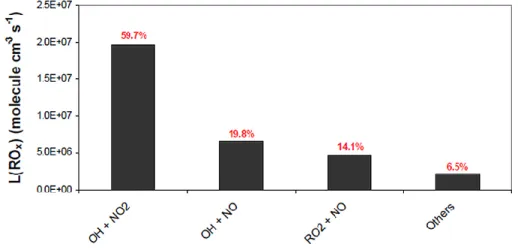
As shown in Figure 1.9 (Dusanter et al., 2009b), OH + NO2 (R29) is the dominant sink for ROx
radicals in urbanized areas such as Mexico City where NOx concentrations are elevated, with a
contribution of approximately 60% to the total loss rate. Other important pathways for radical termination are OH + NO (R30) and RO2 + NO (R20b) accounting for approximately 20 and 14%
of the total loss rate, respectively. However, as mentioned previously, HONO formation has to be seen as a temporary reservoir for OH since its photolysis will reform OH.
Figure 1.9 Contributions of termination reactions to the total termination rate of ROx radicals in the urban environment of Mexico City (Dusanter et al., 2009b).
38
In contrast, RO2 radical self- and cross-reactions are the dominant loss processes when NO is low
(< approx. 100 ppt) as shown in Figure 1.10 for a forested environment in Michigan (US). It can be seen that RO2 + HO2 termination reactions contribute up to 79% of the total loss of ROx radicals,
with an additional 10-15 % loss due to HO2 + HO2 (R32) (Griffith et al., 2013a). Under typical
ambient HO2 and RO2 concentrations observed in forested areas (< 80 pptv, HO2/RO2 close to
unity), the HO2 + HO2 reaction rate is slow compared to RO2 + HO2 (Boyd et al., 2003)
Figure 1.10 Contributions of termination reactions to the total loss rate of ROx radicals in a forested area (Griffith et al., 2013a). The negative sign indicates a loss.
The reaction between RO2 and OH can be significant under typical marine boundary layer
conditions (Fittschen et al., 2014). As mentioned above, the determination of rate constant for several organic peroxy radical with OH have been found to be fast and should be included in models describing the chemistry in low NOx environments (Fittschen et al., 2014). These authors showed
that the reaction of CH3O2 with OH represents approximately 25% of the CH3O2 loss rate using
data from a field campaign performed at Cape Verde.
1.1.5 Ozone production and destruction
Besides their role in the oxidation of ambient trace gases, peroxy radicals are involved in the production of ozone. Tropospheric ozone is mainly produced and destroyed by photochemistry involving both NO and NO2:
39
R36 𝑁𝑂 + 𝑂3 → NO2+ 𝑂2
R37 𝑁𝑂2+ ℎ𝑣 (λ < 420 nm) → NO + O(3P)
R38 𝑂 (3𝑃) + 𝑂2 → O3
The NO and NO2 concentrations are usually in a quasi-stationary equilibrium during daytime due
to the fast cycling occurring between the species. This group of reactions (R36-R38) is known as the O3-NOx photostationary state.
This cycle does not lead to net production of ozone since O3 is both produced and consumed. Since
NOx are mainly emitted in the form of NO through anthropogenic and natural emissions
(Finlayson-Pitts and Pitts Jr, 2000), net ozone production requires additional routes to convert NO into NO2. In polluted areas where NOx concentrations are relatively high, the propagation reactions
of peroxy radicals discussed above can promote the production of O3:
R20a 𝑅𝑂2+ 𝑁𝑂 → 𝑅𝑂 + 𝑁𝑂2
R24a 𝐻𝑂2+ 𝑁𝑂 → 𝑂𝐻 + 𝑁𝑂2
The conversion of NO into NO2 (R20a, R24a) due to the presence of peroxy radicals in the
atmosphere leads to the formation of NO2 without consumption of O3, which in turn leads to the
formation of additional molecules of O3 from NO2 photolysis.
In contrast,the reaction between HOx radicals and ozone can lead to the net destruction of O3 in
very low-NOx areas (R27& R28):
R27 𝐻𝑂2+ 𝑂3 → 𝑂𝐻 + 2 𝑂2
R28 𝑂𝐻 + 𝑂3 → 𝐻𝑂2+ 𝑂2
It is worthwhile to note that anthropogenic activities lead to concomitant emissions of NO, CO and VOCs, favoring ozone production. This is a self-energizing process since a higher ozone
40
concentration will lead to an increasing in OH concentration and therefore a faster oxidation rate of VOCs.
1.2 Measuring peroxy radicals in the atmosphere
Measurements of ambient radicals are extremely challenging since their concentrations are extremely low, less than 1 pptv for OH and ranging from the sub pptv to a few tens of pptv for peroxy radicals, due to their high reactivity and short lifetimes (less than a second for OH and up to tens of seconds for peroxy radicals). In addition, radicals can easily be lost on surfaces during sampling into instruments. Several techniques have been developed for measuring ROx radicals in
the atmosphere and below we focus on techniques used to measure peroxy radicals, including Matrix Isolation Electron Spin Resonance spectroscopy (MIESR) (Mihelcic et al., 2003, 1985) , Chemical Ionization Mass Spectrometry (CIMS) (Albrecht et al., 2019; Edwards et al., 2003; Hanke et al., 2002; Hornbrook et al., 2011; Kukui et al., 2008a), Chemical Amplification (CA, PERCA: PEroxy Radical Chemical Amplifier, ECHAMP: Ethane-Based Chemical Amplification) (Cantrell et al., 1984; Clemitshaw et al., 1997; Hernández et al., 2001; Kartal et al., 2010; Liu et al., 2009; Wood et al., 2017; Wood and Charest, 2014), and Laser-Induced Fluorescence (LIF) (Stevens et al., 1994a; Dusanter et al., 2009b; Faloona et al., 2004; Hard et al., 1984; Holland et al., 1995; Matsumi Yutaka et al., 2002; Heal et al., 1995; Amedro et al., 2012a; Whalley et al., 2018a; Chan et al., 1990; Martinez et al., 2010), including ROx-LIF(Hendrik Fuchs et al., 2008;
Whalley et al., 2018a). These techniques are briefly presented below for MIESR and CIMS, highlighting some of the known limitations, but are discussed in more details for PERCA and ROx
-LIF, which represent the core of this Ph.D work. Techniques used to calibrate these instruments are also discussed in this section.
1.2.1 Matrix Isolation and Electron Spin Resonance Spectroscopy (MIESR)
Measurements of atmospheric peroxy radicals using Matrix Isolation and Electron Spin Resonance Spectroscopy was reported by Mihelcic et al. (Mihelcic et al., 1985, 1990, 2003). So far, only one instrument of this kind exists in the world at the Forschungszentrum Jülich, Germany
41
(Fuchs et al., 2010). To the best of our knowledge, this instrument was lastly used in 2010 on the SAPHIR atmospheric chamber (Fuchs et al., 2010) and is no longer employed.
This is the only technique that allows measurements of speciated peroxy radicals in one sample: HO2, some RO2, CH3C(O)O2. MIESR is very selective, being only sensitive to radicals, and
exhibits a low detection limit of 2 pptv at a time resolution of 30 min (Mihelcic et al., 2003). This technique consists of trapping ambient air samples in a D2O matrix at 77 K for 30 min. The energy
difference between the two principal spin states of the unpaired electron in a radical species is then probed by Electron Spin Resonance (Fuchs et al., 2010). The radical concentrations are computed from the resulting microwave spectra by fitting reference spectra for the targeted radicals.
The main disadvantages of this method are (i) its cost, (ii) the necessity to trap an air sample before its analysis in the laboratory, (iii) the difficulty of maintaining the sample under vacuum at 77 K until it is analyzed (Mihelcic et al., 2003), (iv) long analysis time (8 hours per sample). However, this technique exhibits several advantages such as (i) its ability to distinguish between HO2 and organic peroxy radicals, (ii) the measurement of individual RO2 radicals.
1.2.2 Chemical Ionization Mass Spectrometry (CIMS)
The CIMS technique (Albrecht et al., 2019; Edwards et al., 2003; Hanke et al., 2002; Hornbrook et al., 2011; Kukui et al., 2008a) is based on the chemical conversion of ROx radicals
to sulphuric acid (H2SO4) and its subsequent detection by chemical ionization mass spectrometry,
which is an established method for indirect measurements of OH (Berresheim et al., 2000). As shown in Figure 1.11, ambient air is continuously sampled through an orifice into an inlet held at reduced pressure. Both SO2 and NO are added in the front injector to convert RO2 into HO2
(R20a) and HO2 (R24a) into OH. In the meantime, OH reacts with SO2, resulting in the formation
of sulfuric acid (H2SO4) and its propagation to HO2 (R39-R41).
R39 𝑂𝐻 + 𝑆𝑂2+ 𝑀 → HSO3+ 𝑀
42
R41 𝑆𝑂3+ 2𝐻2𝑂 → H2𝑆𝑂4+ 𝐻2𝑂
The reformation of HO2 leads to an amplification chemistry since several molecules of H2SO4 will
be produced for each sampled ROx radical (R24a, R39-R41). The chain length reported for this
type of instruments, i.e. the number of H2SO4 molecules produced per sampled ROx radical, is in
the range of 10-15 (Edwards et al., 2003; Hanke et al., 2002).
R24a 𝐻𝑂2+ 𝑁𝑂 → 𝑂𝐻 + 𝑁𝑂2
The amount of H2SO4 produced in the inlet is quantified by mass spectrometry using NO3- as
reagent ion. The concentration of ROx radicals is derived from the measured H2SO4 concentration,
taking into account the background H2SO4 concentration in the atmosphere, and the calibrated
chain length. Since atmospheric concentrations of OH (105-107 cm-3) and RO (<105 cm-3) are
negligible compared to concentrations of HO2 and RO2 (108-109 cm-3), the CIMS measurement is
considered as the sum of peroxy radicals (HO2+RO2).
43
This allows the selective observation of peroxy radicals at a time resolution of about 10 s and a detection limit lower than 3×106 cm-3 thanks to the low background level of sulphuric acid in
ambient air (Hofzumahaus and Heard, 2015). However, the RO2 + NO reaction leads to an
incomplete propagation of RO2 radicals to HO2 since organic nitrates (R20b) and nitrites (R31) are
also produced during the propagation steps. Thus, it necessarily involves an incomplete conversion of ROx radicals to sulphuric acid and the measurements will be a lower limit of ambient ROx.
Hornbrook et al. reported a method to speciate HO2 and the sum of RO2 radical on CIMS
instruments at a time resolution of 1 min (Hornbrook et al., 2011). This was achieved by varying both [NO] and [O2] simultaneously in the chemical conversion region of the inlet. The idea of this
method is based on a change of the conversion efficiency of RO2 into HO2 under different inlet
[NO]/[O2] ratios. This allows to selectively observe either HO2 or the sum of HO2 and RO2. To
measure HO2 + RO2, ambient air is diluted by half with O2, whereasfor HO2 measurements,
ambient air is diluted by half with N2. In both cases, the first step is to convert RO2 into RO in the
presence of NO while the difference is in the second step when O2 or N2 is added. In the case of an
addition of O2, most RO will convert into HO2 (R22) and HO2 + RO2 will be quantified. In case of
an addition of N2, less chemical conversions of RO into HO2 will occur. Thus, only HO2 will be
quantified.
1.2.3 Chemical Amplification (PERCA & ECHAMP)
The PERCA technique is an indirect measurement method pioneered by Cantrell and Stedman (Cantrell et al., 1984) to measure the sum of ROx radicals. In this technique, ROx radicals
are converted into NO2 via an amplification chemistry to produce several molecules of NO2 per
sampled ROx radical.
44
Figure 1.12 Schematic representation of the PEroxy Radical Chemical Amplification system The sampling inlet is usually made of Pyrex or PFA (PerFluoroAlkoxy) materials.
The amplification chemistry takes place close to the sampling point by adding two reagent gases (NO and CO). The number of NO2 molecules produced per sampled ROx radical can easily
be calibrated and is called the chain length (CL). The distance between the sampling point and the addition of the reagent gases is kept as short as possible to minimize potential wall-losses of the radical species (OH, HO2 and RO2). NO2 is then transported to a suitable detector based on luminol
chemiluminescence (Clemitshaw et al., 1997), LIF (Sadanaga et al., 2004), cavity ring-down spectroscopy (CRDS) (Liu et al., 2009) or cavity attenuated phase-shift spectroscopy (CAPS) (Wood and Charest, 2014). The principle of PERCA measurements is based on a chain reaction cycle involving both OH and HO2 by adding NO and CO to the sampled air (Figure 1.13).
45
Figure 1.13 Amplification chemistry of a PERCA system.
NO converts ambient RO2 radicals into HO2 (R20a and R22) and the resulting HO2,
together with the ambient HO2, are converted into OH (R24a). CO converts OH back to HO2 as
shown in R11 and R9, and as a consequence, the suite of reactions R11/R 9/R24a acts as an amplification system where several NO2 molecules are produced for each radical entering in the
cycle. The CL is a finite number because the reaction cycle ends due to termination reactions for both OH (R29, R30, R34 &R36) and HO2 (R24b, R44). Termination reactions due to cross- and
self-reactions of ROx radicals are not included since R35 and R36 together with wall losses of
radicals are the most important radical sinks under the high NO conditions in the inlet (Cantrell et al., 1984).
R20a 𝑅𝑂2+ 𝑁𝑂 → 𝑅𝑂 + 𝑁𝑂2
R20b 𝑅𝑂2+ 𝑁𝑂 → 𝑅𝑂𝑁𝑂2
R22 𝑅𝑂 + 𝑂2 → 𝑅−𝐻𝑂 + 𝐻𝑂2
46 R24a 𝐻𝑂2+ 𝑁𝑂 → 𝑂𝐻 + 𝑁𝑂2 R24b 𝐻𝑂2+ 𝑁𝑂 + 𝑀 → 𝐻𝑁𝑂3+ 𝑀 R11 𝑂𝐻 + 𝐶𝑂 → 𝐶𝑂2+ 𝐻 R9 𝐻 + 𝑂2+ 𝑀 → 𝐻𝑂2+ 𝑀 R32 𝐻𝑂2+ 𝐻𝑂2 → 𝐻2𝑂2+ 𝑂2 R33 𝐻𝑂2+ 𝑅𝑂2 → 𝑅𝑂𝑂𝐻 + 𝑂2 R29 𝑂𝐻 + 𝑁𝑂2+ 𝑀 → 𝐻𝑁𝑂3+ 𝑀 R30 𝑂𝐻 + 𝑁𝑂 + 𝑀 → 𝐻𝑂𝑁𝑂 + 𝑀 R34 𝑂𝐻 + 𝐻𝑂2 → 𝐻2𝑂 + 𝑂2 R35 𝑅𝑂2+ 𝑊𝑎𝑙𝑙 → 𝑛𝑜𝑛 − 𝑟𝑎𝑑𝑖𝑐𝑎𝑙 𝑝𝑟𝑜𝑑𝑢𝑐𝑡𝑠 R36 𝑂𝐻 + 𝑊𝑎𝑙𝑙 → 𝑛𝑜𝑛 − 𝑟𝑎𝑑𝑖𝑐𝑎𝑙 𝑝𝑟𝑜𝑑𝑢𝑐𝑡𝑠 R44 𝐻𝑂2 + 𝑁𝑂2 → 𝐻𝑂2𝑁𝑂2
A PERCA instrument therefore amplifies all the radicals that can cycle to HO2, such as OH, HO2,
RO and RO2, and measures the sum of ROx. However, as already mentioned above for the CIMS
apparatus, atmospheric concentrations of OH are negligible compared HO2 and RO2 and the
PERCA measurements can therefore be seen as the sum of HO2 and RO2.The following aspects,
which can influence the chain length (amplification factor) and the PERCA response are briefly discussed below: