HAL Id: hal-03130832
https://hal.archives-ouvertes.fr/hal-03130832
Submitted on 3 Feb 2021
HAL is a multi-disciplinary open access
archive for the deposit and dissemination of
sci-entific research documents, whether they are
pub-lished or not. The documents may come from
teaching and research institutions in France or
abroad, or from public or private research centers.
L’archive ouverte pluridisciplinaire HAL, est
destinée au dépôt et à la diffusion de documents
scientifiques de niveau recherche, publiés ou non,
émanant des établissements d’enseignement et de
recherche français ou étrangers, des laboratoires
publics ou privés.
spatial frequency encoding NMR spectroscopy: from
theory to practice
Bertrand Plainchont, Daisy Pitoux, Ghanem Hamdoun, Jean-Michel Ouvrard,
Denis Merlet, Jonathan Farjon, Nicolas Giraud
To cite this version:
Bertrand Plainchont, Daisy Pitoux, Ghanem Hamdoun, Jean-Michel Ouvrard, Denis Merlet, et al..
Achieving high resolution and optimizing sensitivity in spatial frequency encoding NMR spectroscopy:
from theory to practice. Physical Chemistry Chemical Physics, Royal Society of Chemistry, 2016, 18,
pp.22827 - 22839. �10.1039/c6cp01054g�. �hal-03130832�
Physical Chemistry Chemical Physics
c6cp01054g
Achievinghigh resolution and optimizing Q1 Q2 sensitivity in spatial frequency encoding NMR
spectroscopy: from theory to practice
Bertrand Plainchont, Daisy Pitoux, Ghanem Hamdoun, Jean-Michel Ouvrard, Denis Merlet, Jonathan Farjon and Nicolas Giraud*
A detailed analysis ofNMR spectra acquired based on Q3 spatial frequency encoding is presented.
Please check this proof carefully. Our staff will not read it in detail after you have returned it.
Translation errors between word-processor files and typesetting systems can occur so the whole proof needs to be read. Please pay particular attention to: tabulated material; equations; numerical data; figures and graphics; and references. If you have not already indicated the corresponding author(s) please mark their name(s) with an asterisk. Please e-mail a list of corrections or the PDF with electronic notes attached – do not change the text within the PDF file or send a revised manuscript. Corrections at this stage should be minor and not involve extensive changes. All corrections must be sent at the same time.
Please bear in mind that minor layout improvements, e.g. in line breaking, table widths and graphic placement, are routinely applied to the final version.
Please note that, in the typefaces we use, an italic vee looks like this: n, and a Greek nu looks like this: n.
We will publish articles on the web as soon as possible after receiving your corrections; no late corrections will be made. Please return your final corrections, where possible within 48 hours of receipt, by e-mail to: [email protected]
Journal: PCCP Paper: c6cp01054g
Title: Achieving high resolution and optimizing sensitivity in spatial frequency encoding NMR spectroscopy: from theory to practice
Editor’s queries are marked on your proof like thisQ1,Q2, etc. and for your convenience line numbers are indicated like this5,10,15, ...
Please ensure that all queries are answered when returning your proof corrections so that publication of your article is not delayed.
Query
reference Query Remarks
Q1 For your information: You can cite this article before you receive notification of the page numbers by using the following format: (authors), Phys. Chem. Chem. Phys., (year), DOI: 10.1039/c6cp01054g.
Q2 Please carefully check the spelling of all author names. This is important for the correct indexing and future citation of your article. No late corrections can be made. Q3 Please check that the inserted Graphical Abstract text is
suitable. Please ensure that the text fits between the two horizontal lines.
Q4 In the sentence beginning ‘‘We can now calculate the. . .’’ there is a citation to Fig. 4a, however Fig. 4 does not appear to contain a part (a). Please resupply the figure (preferably as a TIF file at 600 dots per inch) or amend the text accordingly.
Q5 Fig. 12 contains a part labelled (c), but this does not appear to be mentioned in the caption. Would you like to modify the caption or resupply the artwork (preferably as a TIF file at 600 dots per inch)?
Q6 Ref. 12: Can this reference be updated? Please supply details to allow readers to access the reference (for references where page numbers are not yet known, please supply the DOI).
Q7 Ref. 24 and 44: Please provide the page (or article) numbers.
Achieving
high resolution and optimizing
Q1 Q2sensitivity in spatial frequency encoding NMR
spectroscopy: from theory to practice†
Bertrand Plainchont, Daisy Pitoux, Ghanem Hamdoun,‡ Jean-Michel Ouvrard, Denis Merlet, Jonathan Farjon and Nicolas Giraud*
A detailed analysis of NMR spectra acquired based on spatial frequency encoding is presented. A theoretical model to simulate gradient encoded pulses is developed in order to describe the spatial properties of the NMR signals that are locally created throughout the sample. The key features that affect the efficiency of the slice selection process during excitation as well as refocusing pulses are investigated on a model ABX spin system, both theoretically and experimentally. It is shown that the sensitivity and resolution of the pure shift and J-edited experiments based on a spatial frequency encoding can be optimized to a point where high-resolution techniques based on a spatial frequency encoding approach show optimal performance compared to other methods.
Introduction
Considerable progress has been achieved over the last few years in mastering the key events and actors involved in chemical reactions. These advances were made possible – notably – by the major breakthroughs made in observing and describing them, leading to a deeper understanding of ever-more complex molecular structures, dynamics and reactivities. On this account, nuclear magnetic resonance (NMR) spectroscopy has been proved to be a tool of choice for probing molecular systems over very wide spatial and time ranges.1,2Of particular
importance is its suitability for providing computational chem-istry methods with several physical measurements of the sys-tem under study. These observables are used either as parameters of the computer simulation, or as structural/ dynamic constraints to select the most realistic computational results. In most of the cases outlined above, a key milestone to combine efficiently NMR with theoretical chemistry is of course the ability to record high-resolution NMR spectra for the analyzed sample. It has long been shown that proton nuclei can constitute informative, abundant and sensitive probes of
the local structure and dynamics in very diverse systems. Unfortunately, in several cases that are of prime interest nowa-days, the resolution of1H spectra is often dramatically limited
by the high number of homonuclear couplings, and the low chemical shift dispersion.
Several methods have been introduced in the last decade to overcome the resolution issues raised in1H NMR. Some of the
most outstanding achievements reported in this field are based on the concept of Spatial Frequency Encoding (SFE).3–5 The
idea is to perform at the same time a selective excitation, decoupling, or recoupling of different spin nuclei in different regions of the NMR sample. The last few years have witnessed a generation of original experiments that have paved the way to spectacular achievements. Among these, it was first shown that broadband homonuclear decoupling sequences based on spatial frequency encoding can be performed efficiently, even during a direct acquisition scheme, to produce d-resolved (also known as a pure shift) spectra in which each proton signal appears as a singlet.5–8 Considerable developments have also
been focused on the measurement of scalar or residual dipolar couplings, with the implementation of J-edited experiments whose unique analytical content is closely linked to the proper-ties of the spatial frequency encoding process.9–16
However, to date there has been no theoretical study that allows for describing the local spin dynamics occurring throughout the NMR sample during these pulse sequences, although the number of novel experiments implementing SFE techniques is continuously increasing. In this paper, we report the simulations of SFE experiments with two aims. On the one hand, simulations are the only way to describe the spatial
1 5 10 15 20 25 30 35 40 45 50 55 1 5 10 15 20 25 30 35 40 45 50 55
Cite this: DOI: 10.1039/c6cp01054g
Equipe de RMN en milieu oriente´, ICMMO, UMR 8182 (CNRS-UPS), Universite´ Paris-Sud, 91405 Orsay cedex, France. E-mail: [email protected]
† Electronic supplementary information (ESI) available: Experimental and com-putational methods, spatial distributions calculated for a series of gradient encoded pulses, experimental and simulated NMR data obtained for the model compound 1, and comments on the comparison between PSYCHEDELIC, G-SERF and push-G-SERF pulse sequences. See DOI: 10.1039/c6cp01054g
‡ Present address: E´quipe Analyse et Mode´lisation Mole´culaire, UMR CNRS 6014 ‘‘COBRA’’ Universite´ de Rouen, 76821 Mont St Aignan Cedex, France. Received 16th February 2016, Accepted 1st May 2016 DOI: 10.1039/c6cp01054g www.rsc.org/pccp
PCCP
PAPER
variations of the encoded NMR signal that contributes to the properties of the overall spectrum. We remind that these variations cannot be probed experimentally since the receiver coil detects the overall change in the magnetic flux created by the sample, which makes the development of such a theoretical tool a key step toward understanding and optimizing pulse sequences relying on a spatial frequency encoding. On the other hand, the ability to simulate NMR spectra is nowadays often required in modern chemistry to fit them with the considered theoretical model and extract accurately structural or dynamic insights of the studied molecule.
In this context, we present a theoretical formalism to describe the gradient encoded irradiation schemes used to generate a spatial frequency encoding. We address the complex relationship between the spatial and spectral resolution, and its influence on the properties of the slice selection process that is operated throughout the sample. Finally, the resulting simulation tool is exploited to describe the optimization of resolution and sensitivity in two popular correlation spectra implementing routine gradient encoded spin evolutions (pure shift and J-edited).
Theory
In this section, a formalism to predict the main features of the NMR spectrum resulting from a spatially encoded excitation is presented. We remind that the concept of spatial frequency encoding is based on the simultaneous use of a selective shaped pulse and a magnetic field gradient. To address this question, the signal arising from a single encoded pulse experi-ment applied to 3-hydroxy-4,4,4-trichlorobutyric b-lactone 1 has been simulated. Beyond its structural simplicity, this compound
constitutes a good model spin system because proton spins HA
and HBshow close chemical shifts and are thus strongly coupled
(DnAB/JAB B 4.4 at 14.1 T), which allows for addressing some
selectivity issues of spectroscopic methods based on a spatial frequency encoding (the single encoded pulse sequence and the structure of 1 are available in the ESI†). Attention must be paid to the definition of the spin Hamiltonian that governs the evolution of the spin system over different steps of this pulse sequence. First, the action of a pulsed field gradient is modeled by dividing the NMR sample into thin virtual slices (Fig. 1a) within which molecules undergo a position dependent – static – magnetic field B(z):
B(z) = B0+ Gz#z (1)
Gzis the strength of the pulsed field gradient taken here along
the z axis, and z is the molecular position in the sample along this axis. This approach has been shown to provide a conve-nient way of simulating the action of pulsed field gradients, for instance for coherence selection purposes.17Then, during a low
power rf field applied together with the pulsed magnetic field gradient, the evolution of the local density operator r(z,t) describing the state of the spin system is calculated by solving in each slice the corresponding Liouville–Von Neumann equa-tion:
d
dtrðz; tÞ ¼ "i½Hðz; tÞ; rðz; tÞ( (2) where H(z,t) is the time- and position-dependent Hamiltonian that accounts for all the spin interactions – mainly the chemical shift, the scalar couplings, and the interaction with the radio-frequency (rf) field – acting on r(z,t). Unless otherwise speci-fied, in the following we neglect relaxation effects.
1 5 10 15 20 25 30 35 40 45 50 55 1 5 10 15 20 25 30 35 40 45 50 55
Fig. 1 (a) Schematic representation of the spatial frequency encoding performed during the single gradient encoded shaped pulse experiment. The receiver coil is represented in orange in order to materialize the total height of the sample that is detected. The z gradient coils are pictured in red. Yellow arrows symbolize the magnetic field gradient. (b) Proton spins HA, HBand HXfrom the model compound 3-hydroxy-4,4,4-trichlorobutyric b-lactone 1 have different resonance frequencies and are thus excited in different cross-sections due to the spatial frequency encoding, giving rise to localized spin evolutions. In (c) the overall free induction decay detected by the receiver coil is the sum of these local NMR signals.
In the case of an amplitude modulated pulse, the corres-ponding Hamiltonian Hrf(z,t), expressed in the reference frame
rotating at the transmitter frequency reads:
Hrf(z,t) = Do(z)Iz+ oI(t){Ixcos f + Iysin f} (3)
where o1(t) = "gI#Brf1(t) and f are the angular nutation
fre-quency and the phase of the resonant component of the oscillating field Brf
1(t), respectively. gIis the gyromagnetic ratio
of the considered nuclear spin. The offset Do(z) is calculated between the Larmor frequency o0(z) of the spin I in the
considered slice, and the transmitter frequency orf:
Do(z) = o0(z) " orf= gI#{B0+ Gz#z}{1 " sI} " orf (4)
where sI is the chemical shielding of the spin I. After the
gradient encoded excitation pulse (i.e. during acquisition), the main magnetic field (B0) is again considered to be
homo-geneous, and the spin Hamiltonian incorporates only the1H
chemical shift and scalar coupling interactions (Fig. 1b). The overall signal that is detected by the receiver coil is then the sum of the free induction decays originating from each virtual slice throughout the sample (Fig. 1c). In the following, all simulations and experiments were performed at 14.1 T (nH= 600.13 MHz)
Simulation of spatial frequency
encoded pulses
Excitation step
The action of a gradient encoded E-Burp2 pulse of duration 60 ms on the model system 1 has been simulated for each position z in the virtual sample. The E-Burp2 shape has been shown to provide experimental encoded spectra of good quality on a wide range of samples.9,10,13,18,19 The magnetization
corresponding to a single coherence term from each proton has been evaluated in each virtual slice at the end of this excitation step. Fig. 2 shows the spatial distribution of these magnetizations for HX and HA. For HX, a region is easily
distinguishable, along which the transverse magnetization is spin-locked by the rf field (Fig. 2a). We note that this region is encoded around the position zXthat satisfies the relationship:
nX
¼g2pH# Bf 0þ Gz# zXg 1 " sf Xg (5)
wherenX is the Larmor frequency of HX in the absence of a
pulsed field gradient. Outside of this region, the amplitude of the magnetization is significantly weaker, and no phase coherence is remaining. Similarly, HA magnetization is encoded in a
restricted region around nA, but a distortion of the phase
distribution is observed (Fig. 2b). This can be explained by the fact that in the region encoded between nA and nB, the
selective pulse of bandwidth B82 Hz20 irradiates
simulta-neously HA and HB whose chemical shift difference is only
B75 Hz, which suggests that a coherence transfer is performed between these coupled spin nuclei. We note that this spatial selection issue is absent for HXwhose chemical shift difference
with HAand HBis higher than 765 Hz.
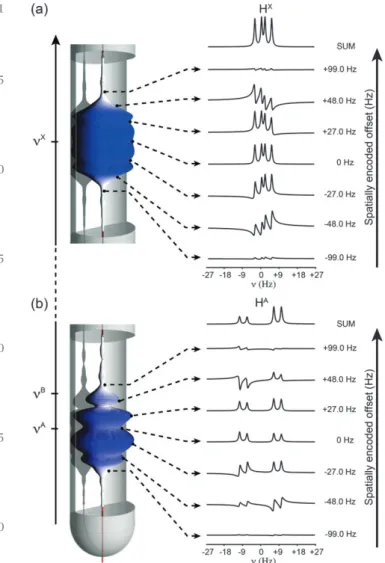
We have further calculated, for each virtual slice building up the simulated sample, the free induction decay originating from the excitation of all the single quantum coherences that make up the spin-state of HXon the one hand, and HAon the
other hand. The sub-spectra calculated at different positions along the encoding gradient axis are shown together with their amplitude profile in Fig. 3. Similar to what could be observed for a single coherence, the simulation highlights a restricted ensemble of virtual slices within which pure absorption spectra can be obtained. Again, outside this region, strong distortions affect the phase of the resulting spectra whose amplitude decreases rapidly, as it is underlined by the evolution of the amplitude profiles. This allows for addressing accurately one fundamental issue in gradient frequency encoding techniques, about defining the slice selection that is operated by the gradient and the selective pulse. This concept materializes here into the shape of the amplitude profiles, which demarcate the restricted volumes contributing quantitatively to the overall signal.
The sum of the sub-spectra generated in each virtual slice, and notably those within this quantitative volume, yields the signal that is detected for HX, in agreement with what has
1 5 10 15 20 25 30 35 40 45 50 55 1 5 10 15 20 25 30 35 40 45 50 55
Fig. 2 The spatial variation of the magnetization calculated at the end of a gradient encoded excitation pulse is represented with 2 viewing angles inside the NMR tube, for AaBaX+(a) and A+BaXa(b) coherences. An E-Burp2 pulse of duration 60 ms was used for the selective irradiation. The virtual sample was divided into 401 slices of equal height around each region of interest, to which a position dependent magnetic field value was assigned.
already been described experimentally (Fig. 3a).6,9It should be
noted that the spatial distribution of the phase of the sub-spectra aroundnX is antisymmetric, whereas for HA an
asym-metry is observed, as it is illustrated for instance for sub-spectra calculated for opposite offsets of +48 Hz and "48 Hz with respect tonXandnArespectively (Fig. 3a and b). The amplitude
profile aroundnAalso reflects this asymmetry that is due to the
spatial selection issue described above. We observe that the sum of the sub-spectra encoded in this cross-section where a spatial resolution issue is raised leads to a signal with a distorted lineshape for HA. Furthermore, the spatial
distribu-tion of sub-spectra is displayed as a pseudo-2D map in Fig. 4. The standard1H spectrum is displayed along the NMR tube
to illustrate the spatial frequency encoding. It is apparent that each signal from HA, HB, or HX is selectively encoded in a
restricted cross-section of the sample, which is the cornerstone
of spatial frequency encoding. We remark however that for the E-Burp2 pulse of 60 ms implemented here, a spatial resolution issue is observed. Indeed, the two cross-sections within which HAand HB are encoded overlap with each other as it can be
monitored on the amplitude profile depicted within the NMR tube. This result illustrates the difficulty to trigger selective evolutions involving protons with close resonance frequencies such as HAand HB.
We can now calculate the NMR spectrum that is yielded by the whole NMR sample. It is the sum of the local spectra calculated over all the virtual slices constituting the sample (Fig. 5a – this spectrum is also shown above the pseudo-2D map
inFig. 4a). Q4
The general lineshape of this encoded1H spectrum reflects
the effect of the overlap of the encoded cross-sections. In
1 5 10 15 20 25 30 35 40 45 50 55 1 5 10 15 20 25 30 35 40 45 50 55
Fig. 3 The amplitude profile evaluated on the first point of the local NMR signal calculated for HX(a) and HA(b) is displayed in cylindrical coordinates within the NMR tube (left). The1H spectra simulated for HXand HAin a selection of virtual slices distributed along the z axis (right). For each sub-spectrum, the difference between the offset of the local rf field and the resonance frequency of HX(respectively HA) is indicated. The SFE gradient was modeled by dividing each region of interest into 401 virtual slices.
Fig. 4 The amplitude profile of the NMR signal represented in cylindrical coordinates (left). The spatial distribution of virtual proton spectra is reported in a pseudo-2D plot where the vertical axis refers to the position z in the NMR sample (right). Blue and red contours are positive and negative, respectively. The SFE gradient was modeled by dividing the sample into 1201 virtual slices.
Fig. 5 The simulated (a and b) and experimental (c and d) spatial fre-quency encoded and standard (broadband)1H spectra of 1. An E-Burp2 pulse of duration 60 ms was used for the gradient-encoded excitation step. For 1, scalar couplings are JA–B
= "17.06 Hz, JA–X= 3.72 Hz, and JB–X = 5.75 Hz. The SFE gradient was modeled by dividing the sample into 201 virtual slices.
particular, for HAand HBthe intensities of the transitions in
their respective multiplet do not follow the expected ‘‘roof’’ effect that is classically observed for ABX spin systems (Fig. 5b), since the opposite effect is observed. This simulation is coher-ent with its experimcoher-ental counterpart recorded on 1. The unusual lineshape that is observed for the experimental encoded spectrum is also clearly reproduced by the simulation (Fig. 5c), while the standard simulated 1H spectrum mimics
faithfully the second order effect observed experimentally between HAand HB(Fig. 5d). We note that the analysis of the
symmetry of the amplitude profiles such as those presented in Fig. 3 and 4 constitutes a useful tool for predicting potential distortions of the overall NMR spectrum, although the knowl-edge of the phase distribution would of course also be required to analyse lineshapes in detail. In the following, the above-presented theoretical tools will be used to describe the evolu-tion of resoluevolu-tion and sensitivity in the general frame of a gradient encoded pulse sequence, and discuss strategies that can be implemented to optimize them.
Optimizing spatial resolution and sensitivity
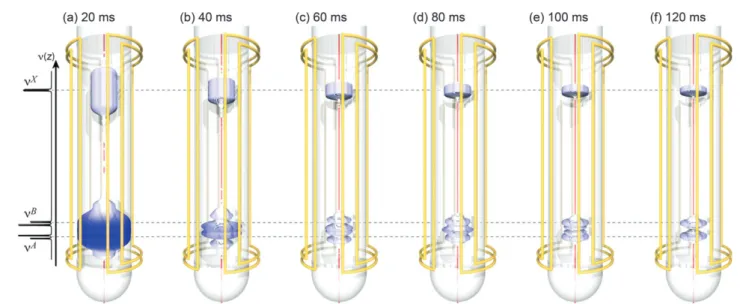
The spatial resolution issue raised above can be solved in different ways. A first approach is to increase the duration of the shaped pulse to act locally on spin coherences with better selectivity. We have studied the influence of the spectral selectivity of the excitation pulse on the slice selection process by simulating a series of gradient encoded E-Burp2 pulses whose duration varied between 20 ms and 120 ms. The spectral width that is encoded by the magnetic field gradient along the sample corresponds in general to the spectrum of the analyzed compound. It has rather been set here to 3772.6 Hz, which is equivalent to 6.3 ppm at 14.1 T, in order to provide a more realistic estimation of typical levels of sensitivity that can be reached using SFE techniques. The resulting amplitude profiles are shown in Fig. 6. As expected, we observe that the longer the
duration, the lower the height of the cross-sections within which each proton spin is encoded, as it can be monitored easily for HX. For 20 ms, the pulse is not selective enough, and
is thus exciting both HA and HB in the same region, which
produces a signal with abnormally higher amplitude (Fig. 6a). Conversely, the quality of the slice selection process is higher at 120 ms, and spatially resolved cross-sections are obtained for each proton spin (Fig. 6f).
Attention must be paid to the fact that the improvement of the spatial resolution is accompanied by a loss of sensitivity, as suggested by the evolution of the height and the radius of the amplitude profiles. To quantify this loss, we have calculated for HX the ratio between the integration of the signal resulting from an excitation with (IX
encoded) and without encoding (IXref).
This sensitivity ratio ranges from 6.7 to 0.7% for pulse dura-tions varying from 20 to 120 ms (Fig. 7 – corresponding
1 5 10 15 20 25 30 35 40 45 50 55 1 5 10 15 20 25 30 35 40 45 50 55
Fig. 6 The amplitude profiles calculated at the end of a gradient encoded excitation step on the model spin system 1, for an E-Burp2 pulse of duration (a) 20 ms, (b) 40 ms, (c) 60 ms, (d) 80 ms, (e) 100 ms and (f) 120 ms. The SFE gradient was modeled by dividing the sample into 1201 virtual slices.
Fig. 7 The simulated (blue circles) and experimental (red circles) sensi-tivity ratios determined on HXfor a gradient encoded E-Burp2 pulse are plotted as functions of the pulse duration. The model curve corresponding to the ideal behaviour proposed by Pell and Keeler is plotted as a blue dashed line. The adapted model curve incorporating transverse relaxation is plotted as a red dashed line.
simulated spectra are shown in the ESI†). These values are coherent with the evolution of the sensitivity that is predicted by Pell and Keeler for a gradient encoding process.21Sensitivity
ratios were also measured experimentally on 1, using an identical shaped pulse and an encoded spectral width. As expected, the experimental sensitivity curve slightly differs from simulation, due to the relaxation process occurring during the encoded pulse.22,23The loss of sensitivity induced by relaxation
for HX is only 13% at 60 ms although HX has a rather short
T2(430 ms), which is known to be an unfavourable case (details
about the modelling of the sensitivity curves are available in the ESI†).
We note that this ideal behaviour described by Pell and Keeler is not valid for HAand HBbecause the spatial selectivity
issue described above induces slight deviations. We remark that the price to pay to achieve a spatially resolved slice selection in a sample containing coupled spins with close chemical shifts is a loss in sensitivity that can be significant, as it has already been observed experimentally. Another interesting feature that can be evaluated is the ‘‘height’’ of the slices that are selected in the NMR sample. For a routine detected sample height of 1.65 cm, with an encoded spectrum of width 3773 Hz (B6.3 ppm at 14.1 T) and a selective E-Burp2 pulse of duration 60 ms (OB B 87 Hz), this
corresponds to physically encoded cross-sections of about 381 mm. Different strategies have been described in the literature to overcome the sensitivity penalty imposed by the spatial fre-quency encoding. Among these, Zangger et al. have shown that fast-pulsing techniques can be implemented to increase the signal-to-noise ratio per unit time, by changing after each scan the offset of the encoded pulse in order to encode a different spatial region where magnetization is at thermal equilibrium.7
Another approach has also been introduced by Lokesh et al., which is based on a polarization sharing technique to transfer each encoded slice polarization from protons that were not affected by the local selective pulse to selectively excited pro-tons, leading to a faster data acquisition without long inter-scan delay.24 Another solution consists in encoding the same
proton site simultaneously in several slices located at different positions along the sample. In this spirit, Jeannerat and Cotte have recently introduced a non-equidistantly modulated Zangger–Sterk element that allows for selecting non-equidistant irradiation sites for the same proton, hence enhancing sensitivity by an order of magnitude without generating too many artifacts.25
The latter concept has also been implemented successfully for performing 13C broadband homonuclear decoupling in
hetero-nuclear13C–1H correlation spectra.26,27
Here we focus on the optimization of the selectivity of the encoded selective pulse itself, whose implementation in the frame of strategies presented above will need to be studied in further depth. From our results, it appears that a key step toward optimizing experiments based on a spatial frequency encoding is to find a compromise between the spatial resolu-tion of the slice selecresolu-tion process, and the loss in sensitivity that is inherent to it. In the following, we study how this can be achieved by optimizing the properties of the refocusing pulses implemented in standard gradient encoded 2D experiments.
From excitation to refocusing pulse
In this section, the choice of the shaped pulse used to perform a gradient encoded irradiation is discussed. A wide variety of band-selective pulses is now available on modern spectro-meters, whose amplitude and phase modulations have been optimized for specifics purposes.28–32 In the field of SFE
techniques, Burp (Band-selective Uniform-Response Pure-phase),33Gaussian and Snob (Selective excitatioN fOr
Biochem-ical applications)34pulses have been frequently chosen for an
implementation with a pulsed magnetic field gradient in order to yield gradient encoded excitation or refocusing of spin coherences. No comparison of their performances has been reported however to date. The spatial properties of Burp, Gaussian and Snob pulses have been studied for gradient encoded excitation and refocusing purposes. An excitation step was first simulated, starting from nuclear magnetization at equilibrium, with an E-Burp2 pulse of duration 60 ms on the one hand, and an E-Snob 2701 pulse of 20 ms on the other hand. The duration of the E-Snob pulse was set so that both pulses have the same spectral bandwidth. Fig. 8a and b show the magnetization of the AaBaX+coherence of HXat the end of
the encoded excitation step, for E-Burp2 and E-Snob shapes, respectively (the complete simulation results including the Gaussian shape are available in the ESI†). Similar to the
1 5 10 15 20 25 30 35 40 45 50 55 1 5 10 15 20 25 30 35 40 45 50 55
Fig. 8 The spatial variation of the magnetization calculated at the end of gradient encoded (a) E-Burp2 901 and (b) E-Snob 2701 for the AaBaX+ coherence of HX. The resulting calculated (c and d) and experimental (e and f) gradient encoded1H spectra of the model spin system 1. The SFE gradient was modeled by dividing the sample into 401 virtual slices.
E-Burp2 pulse, the gradient encoded E-Snob pulse leads to the selective excitation of HXin a cross-section located aroundnX.
For the latter shape however, the phase of the magnetization is strongly modulated. Such a modulation is expected to lead to a partial cancellation of the overall signal. As a consequence of this phase modulation issue, the intensity of the simulated spectrum is significantly weaker for the E-Snob pulse than for E-Burp2 (Fig. 8c and d). This difference in sensitivity is also observed experimentally (Fig. 8e and f). The intensity of the experimental spectrum acquired with the E-Snob pulse is even weaker than expected in the simulation, which suggests that the rf field inhomogeneity has a more detrimental effect on this latter shape.
Such simulation-based study of the spatial properties of gradient encoded irradiations can be generalized to the opti-mization of all the parameters involved in the implementation of any encoded pulse.
In this spirit, the action of a gradient encoded refocusing step was simulated using Re-Burp and R-snob pulses (Fig. 9). The initial state of the spin system was defined as a transverse magnetization on HX taken along the y axis. During these
simulations, this magnetization is expected to undergo a p rotation around the x axis in the cross-section where HX is
encoded. The spatial properties of the gradient encoded refo-cusing pulses were found to be different from those of the excitation pulses based on the same family of amplitude and phase modulations. Indeed, a region where the resulting refo-cused magnetization is clearly spin-locked is observed for both shapes (Fig. 9a and b). Notably, the phase is kept constant in this restricted region for the R-snob encoded pulse. It is interesting to note that as expected from the spectral bandwidth of each refocusing pulse, the height of the encoded region where the phase coherence is achieved is approximately the same height for Re-Burp and R-snob shapes. We also note that the phase coherence within the encoded cross-section is better for the refocusing step than for the excitation step. This explains that gradient encoded refocusing pulses are sometimes implemented
after a hard p/2 pulse to perform an effective slice selective excitation. In this latter case however, further coherence selec-tion may be required to remove unwanted signals created by the hard pulse.
This study of the spatial properties of selective pulses upon spatial frequency encoding was carried out on other popular selective pulses, and notably those implementing a Gaussian shape (the resulting phase distributions and amplitude profiles are shown in the ESI†). In particular, E-Snob pulses are found to be less suitable for performing a spatial frequency encoded excitation with satisfying phase coherence. By contrast, the Gaussian shape is rather robust regarding its implementation in a gradient encoded irradiation scheme, both for excitation (for a 2701 angle) and refocusing purposes. For this latter shape however, it is known that artifacts may appear due to the profile edges of its spectral bandwidth when a high selectivity is required, as illustrated in the ESI† for protons HA and HB.
These results are coherent with the experimental settings that are reported in the literature about the choice of the shapes implemented for gradient encoded irradiations. In the follow-ing, good spatial properties of refocusing pulses will be exploited to improve the quality of the spatial frequency encod-ing in 2D pulse sequences, and notably to optimize their resolution without sacrificing too much of sensitivity.
Slice selection processes in 2D
experiments
The theoretical formalism presented above opens the way to a more general study of the different pulse sequences that are routinely implemented in the field of gradient encoded NMR to trigger selective spin echoes that are the core of the targeted resolution enhancements. This section is dedicated to the analysis of the evolution of the slice selection process over d-resolved and J-edited experiments, which are built on the two most popular refocusing blocks.
d-Resolved refocusing blocks
The basic d-resolved (or pure shift) block is made of a gradient encoded soft p pulse followed by a hard p pulse in the middle of an evolution delay t1. These pulses allow for refocusing every
homonuclear scalar or residual dipolar coupling involving each encoded proton, hence giving rise to a pure evolution of their chemical shifts during t1. This refocusing block that is also
known as the Zangger–Sterk element has been implemented successfully in several correlation experiments, and notably in a direct acquisition scheme, to generate a pure shift1H spectrum
along the spectral dimension of interest.35As a case study, the
spatial resolution of the d-resolved refocusing block has been addressed in the frame of a broadband o1-decoupled
experi-ment (Fig. 10a).6In this sequence, a z gradient filter is used to
obtain pure absorption spectra.18 The effect of this latter
gradient has been simulated in the same manner as for the encoding gradient, by evaluating its contribution to the result-ing position-dependent magnetic field in each virtual slice. The
1 5 10 15 20 25 30 35 40 45 50 55 1 5 10 15 20 25 30 35 40 45 50 55
Fig. 9 The spatial variation of the magnetization calculated at the end of gradient encoded (a) Re-Burp 1801 and (b) R-snob 1801 pulses, for the AaBaX+coherence of HX. Pulse durations of 60 and 20 ms were used for Burp and Snob pulses respectively. The SFE gradient was modeled by dividing the sample into 401 virtual slices.
evolution of the magnetization throughout the sample has first been evaluated at key moments in the pulse sequence. Fig. 10b– e show the evolution of the slice selection process during the d-resolved pulse sequence (the spatial distribution of the magne-tization corresponding to one single coherence from HA is
provided in the ESI†). It appears that each encoded pulse has an effect on the height of the slices selected throughout the pulse sequence. Notably, the refocusing block contributes to select narrower slices within the regions initially encoded by the excitation step (Fig. 10b and c). As a result, two distinct cross-sections can be observed atnAandnB, respectively, which
suggests that the spatial resolution issue between HAand HB
has been partially solved.
This enhanced spatial resolution suggests that it is possible to refine the slice selection process initially induced by the excitation step to achieve a more efficient homonuclear decou-pling. This property is due to the better phase coherence achieved by the encoded refocusing pulses within each selected slice, as suggested in Fig. 9. We note that the z-filter also contributes to make these encoded cross-sections narrower (Fig. 10d). It should be highlighted that the overall shape of the encoded cross-sections during this pulse sequence is not cylindrical, and reflects the complexity of the action of the chosen shaped pulse on the phase and the amplitude of the localized NMR signal.
Moreover, the analysis of the slice selection process induced at the end of the d-resolved block by using an encoded refocusing pulse of 120 ms shows that narrower slices are encoded due to the higher selectivity of this pulse (Fig. 10e). We observe however that the spatial resolution issue in the region aroundnAandnBis surprisingly still present, and that
the amplitude in these cross-sections is weaker. This suggests that the duration, and thus the selectivity of the encoded pulses need to be adequately chosen in order to optimize both the spatial resolution and the sensitivity of the pulse sequence, especially in the challenging case of the homonuclear decou-pling of strongly coupled proton spins, which can be easily monitored using this kind of simulation.
In light of these observations, a 2D o1-homodecoupled
spectrum was simulated on 1, and its experimental counterpart was recorded with the same experimental settings. We remind that most of the pure shift methods that have been developed to date have shown difficulties in decoupling HA and HB
because they are strongly coupled. Burp pulses of duration 60 ms were implemented in order to optimize both the resolution and the sensitivity of the encoded refocusing block. The num-ber of points in each time domain was set so as to allow for a reasonable calculation time on a single computer, and also for corresponding to the typical resolution that is routinely achieved in a 1H–1H 2D correlation experiment, where the
digital resolution in the indirect domain is in principle lower. As expected, the resulting spectra show only diagonal signals, with a multiplet structure in the direct domain, and a singlet structure in the – pure shift – indirect domain (Fig. 11). Overall, we observe that the simulated spectrum reproduces faithfully the experimental spectrum. In particular, it can be seen from the projections of these spectra that the proton sites HAand HB
were properly decoupled, and that the only artifacts that are detectable result from classical truncation effects along the indirect domain.
In conclusion for this section, it is possible to monitor the evolution of the slice selection process that is performed throughout gradient encoded d-resolved spin evolutions by using the theoretical formalism introduced in this paper, and to predict the quality of the resulting 2D spectrum so as to optimize key features of the sequence such as the selectivity of the encoded excitation and refocusing pulses.
From broadband homonuclear decoupling to 1D pure shift NMR spectra
The use of spatial frequency encoding techniques to perform broadband homonuclear decoupling on protons has first been considered as a promising way of rapidly and easily character-izing a sample from a 1D spectrum offering high resolution and, where possible, high sensitivity. Several methods have thus been developed in the past to record 1D pure shift 1H
spectra.36One of the first approaches to obtain such data, and
actually one of the most robust and general, consists in performing the projection of the rows of a J-resolved spectrum that has previously been adequately tilted.37 Similarly, it is
straightforward to generate a pure shift spectrum by calculating
1 5 10 15 20 25 30 35 40 45 50 55 1 5 10 15 20 25 30 35 40 45 50 55
Fig. 10 (a) The broadband o1-decoupled pulse sequence. On the proton channel, black and white ellipsoidal shapes correspond to p/2 and p shaped pulses respectively. On the pulsed field gradient channel, white rectangular bars refer to rectangular-shaped z field gradients, and open ellipsoidal shapes to sine-shaped z field gradients. The amplitude profiles calculated (b) after an E-Burp2 pulse of 60 ms (step 1), (c) after a d-resolved block implemented with a Re-Burp pulse of 60 ms (for t1= 0 s – step 2), and (d) after a z-filter, using an E-Burp2 pulse of duration 60 ms (step 3). In (e), the same profile as in (c) calculated for a d-resolved block implement-ing a Re-Burp pulse of duration 120 ms. The SFE gradient was modeled by dividing the sample into 1201 virtual slices.
the projection of the columns of a 2D broadband o1-decoupled
spectrum (Fig. 12). Ideally, the observed linewidth of the resulting spectra is only limited in the latter case by the number of points acquired in the indirect domain, and the line broad-ening arising from the projection step. Unfortunately, such approaches are time consuming because a multi-dimensional dataset needs to be recorded to reconstruct the desired 1D spectrum. The Zangger–Sterk element whose implementation
is discussed above is therefore at the root of a series of developments aimed at providing chemists with 1D pure shift NMR spectra of their sample within a reasonable experimental time. Among these, pseudo-2D experiments have first been introduced to shorten the acquisition time by recording data chunks whose duration is short enough to neglect the evolution of scalar couplings. The overall free induction decay is then reconstructed by combining the chunks acquired for successive values of the indirect evolution delay incorporated in the Zangger–Sterk element.6 In this method that has also been
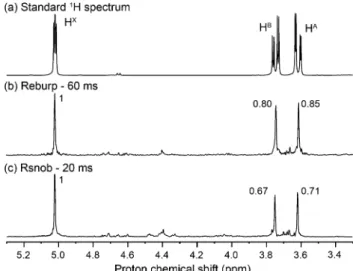
extended to the implementation of pseudo-3D experiments to generate a pure shift spectrum in the ‘‘direct’’ domain of a 2D map, the Zangger–Sterk element can be optimized according to the key features highlighted in the previous section. In parti-cular, it is apparent from the pure shift spectra shown below that R-snob pulses show slightly less good performance than Re-Burp pulses, both in terms of decoupling efficiency for HA
and HBand of artifacts (Fig. 12b and c).
More recently, Zangger et al. introduced a method for acquiring real time pure shift 1H spectra.3 In this approach,
the Zangger–Sterk element is implemented in a windowed acquisition scheme to perform instant homonuclear decou-pling between the successive data chunks acquired in real time. The insertion of selective pulses within the acquisition scheme has been shown to induce relaxation between successive chunks, which contributes to broaden the lines of the resulting spectrum. In this particular case, it was demonstrated that Burp pulses are less suitable for performing instant homo-nuclear decoupling because they require longer irradiation delays to obtain the same spectral selectivity, and thus induce excessive relaxation that contributes (i) to a loss in sensitivity of the resulting windowed acquisition scheme and (ii) to create
1 5 10 15 20 25 30 35 40 45 50 55 1 5 10 15 20 25 30 35 40 45 50 55
Fig. 11 Experimental (a) and calculated (b) 2D o1-homodecoupled spec-tra of 1 obtained with Burp pulses of 60 ms, with 512 points in the indirect domain. The spectral width encoded by the encoding pulsed field gradient was 3773 Hz (6.29 ppm). For the simulated spectrum, only the virtual slices around positions encoded atnA,nBandnXwere computed. It was checked that the resulting spectrum is similar to the one obtained by computing the whole virtual sample when a reduced swept width of 450 Hz (resp. 330 Hz) is considered aroundnAandnB(resp.nX). The resulting simulated spectrum was calculated in B7 days.
Fig. 12 (a) The standard1H spectrum recorded on 1, and the pure shift spectra obtained from the projections of the columns of 2D homonuclear o1-decoupled spectra recorded with (a) a Re-Burp pulse of 60 ms and (b) a R-snob pulse of 20 ms in the gradient encoded refocusing block, respec-tively. The projections were calculated from 2D maps recorded with 1024 points and zero filling up to 2048 points in the indirect domain. The relative intensities are indicated for each pure shift spectrum. Q5
discontinuities in the reconstructed NMR signal. In this con-text, Snob pulses have been preferred for real time homo-nuclear decoupling purposes. Furthermore, it was shown that the discontinuities of the resulting NMR signal arising from its reconstruction from the successive data chunks yields artifacts on the resulting spectrum. Specific developments have thus been implemented in order to minimize line broadening as well as spectral artifact issues on real time pure shift spectra, which are out of the scope of the optimizations of spatial frequency encoding techniques discussed in this work.38
Nota-bly, it was shown that the performance of the Zangger–Sterk element incorporating a R-snob pulse can be greatly improved by using strong pulsed field gradients of equal strength.
To summarize, the theoretical formalism presented here allows for describing and optimizing the main features of the acquisition of 1D pure shift spectra based on the implementa-tion of the Zangger–Sterk element in a pseudo-2D acquisiimplementa-tion scheme. This applies more generally to any gradient encoded pulse sequence where pure shift spin evolutions are triggered during an indirect evolution delay, either to perform spectral
aliasing by reducing the spectral window,25or to combine them
with other selected interactions to generate fully tailored corre-lation spectra.10However, the same conclusion cannot be made
in the frame of real time pure shift NMR, where Burp pulses have been shown to induce sensitivity losses as well as a significant line broadening due to the relaxation occurring during their application. Nevertheless, we note that the choice to implement shaped pulses with comparable spectral selectiv-ity has already been proposed by Helge Meyer and Zangger as a way of acquiring data of optimized quality in the field of real time broadband homonuclear decoupling. Indeed, they pro-pose to use a combination of an E-Burp2 pulse of 60 ms for excitation, with a Gaussian pulse of 20 ms for decoupling as a routine experimental setting for recording real time pure shift 1D spectra, which corresponds to the conditions discussed here in terms of spectral selectivity.39 Other experimental settings
have also been reported in the literature, in which a gradient encoded excitation pulse that is more selective than the encoded refocusing pulse is implemented. In this latter case, the selective excitation pulse is used to avoid artifacts appear-ing in the regions of the sample where the application of the shaped 1801 pulse produces flip angles other than 1801, which is a problem for instance when Gaussian pulses are used for refocusing purposes.40
J-edited refocusing blocks
Another significant achievement introduced in recent years in the field of high-resolution NMR is the acquisition of J-edited spectra. It consists in combining the kind of resolution enhancement made available by SERF experiments in the field of J-resolved spectroscopy, with the spectral edition generated by a spatial frequency encoding process. The resulting encoded
1 5 10 15 20 25 30 35 40 45 50 55 1 5 10 15 20 25 30 35 40 45 50 55
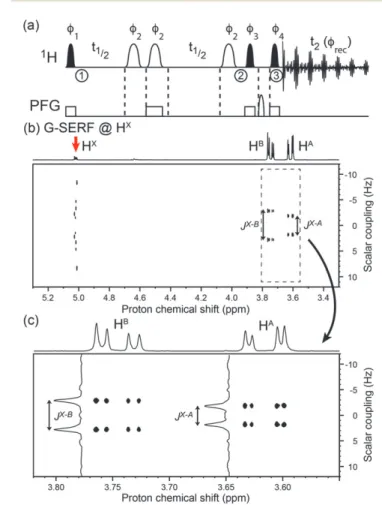
Fig. 13 (a) The G-SERF pulse sequence. (b) The experimental 2D G-SERF spectrum recorded on the model ABX spin system 1, with 128 increments in t1. The offset of the non-encoded refocusing pulses was set so as to edit the coupling network involving HX. The projection above the direct dimension of each 2D map is the sum of the rows. The spectral width encoded by the encoding pulsed field gradient was 3773 Hz (6.29 ppm). (c) An expansion of the region where the couplings involving HXare edited.
Fig. 14 The amplitude profiles calculated for a G-SERF experiment set to edit the coupling network involving HA(a) after a gradient encoded E-Burp2 pulse of 60 ms (step 1 in Fig. 13a), (b) after the J-edited block implementing a Re-Burp pulse of 60 ms (for t1= 0 s – step 2), and (c) after the z-filter composed of a time reversal E-Burp2 pulse and an E-Burp2 pulse of 60 ms (step 3). In (d) the same distribution as in (b) has been calculated for a J-edited block implementing Re-Burp pulses of duration 120 ms. The SFE gradient was modeled by dividing the sample into 1201 virtual slices.
refocusing block allows for triggering local selective spin echoes in the course of which only the coupling between a selected proton and one of its coupling partners can evolve. In the resulting spectrum, a fully resolved edition of the coupling network around this selected proton spin is thus made available. In addition, each coupling can be straightforwardly assigned to the right coupling partner.9The spatial properties of this
gra-dient encoded selective refocusing block have been evaluated in the framework of a G-SERF pulse sequence (Fig. 13a).
The experimental G-SERF spectrum shown in Fig. 13 was recorded so as to edit the coupling network involving HXin 1,
using Burp pulses of 60 ms for both the excitation and refocus-ing steps, as discussed above. As expected two multiplets are observed at the chemical shifts of the coupling partners HAand
HBwhose splitting in the J-resolved dimension allows for accu-rately measuring the strength of their scalar coupling with HX
(Fig. 13b). The resolution achieved in the indirect domain allows for verifying that these multiplets show almost no artifact, which highlights the quality of the spatial frequency encoding process (Fig. 13c).
A specific advantage of the G-SERF experiment is the simplicity of its implementation, since one only has to change the offset of the non-encoded refocusing pulses to edit the coupling network of another proton nucleus. In this spirit, this offset has been switched tonAto probe the coupling network of HA.
The evolution of the slice selection process has been computed after each step of this G-SERF experiment prior to studying the resulting spectrum (Fig. 14). As for the d-resolved block, we observe that the action of both the selective refocusing block and the z-filter leads to successive thinning of the cross-sections that are encoded for each proton site (Fig. 14a–c). The impact of the selectivity of the encoded refocusing pulse on the quality of the slice selection process has also been studied for this refocusing
1 5 10 15 20 25 30 35 40 45 50 55 1 5 10 15 20 25 30 35 40 45 50 55
Fig. 15 The experimental (a) and calculated (b) 2D G-SERF spectra of the model ABX spin system set to edit the coupling network involving HA. The projection above the direct dimension of each 2D map is the sum of the rows. Both data were obtained with 64 increments in t1. The spectral width encoded by the encoding pulsed field gradient was 3773 Hz (6.29 ppm). For the simulated spectrum, the whole virtual sample was computed. The resulting simulated spectrum was calculated in B5 days.
Fig. 16 The expansions of the experimental (exp. – a–d) and simulated (sim. – e–h) 2D G-SERF spectra of 1 implemented with Re-Burp and R-snob refocusing pulses, taken aroundnX(a, b, e and f) andnB(c, d, g and h). The sum of the columns is displayed along the indirect dimension for each expanded area.
block (Fig. 14d). We observe that implementing a Re-Burp pulse of 120 ms results in an asymmetric amplitude profile for the cross-section encoded atnB. This allows for predicting that using a too
selective encoded pulse would yield a signal atnBthat is not only
distorted, but also weaker.
A G-SERF experiment was thus implemented using selective Burp pulses of duration 60 ms, and its experimental counter-part was recorded using identical settings. Fig. 15 shows the experimental and simulated J-edited spectra that were gener-ated to edit the coupling network of HA.
Only 64 increments were acquired in t1, due to the length of
the corresponding computational time needed to simulate this 2D experiment. In both spectra doublets with splittings JA–Xand
JA–Bappear atnXandnBrespectively. The cross-section encoded
at nA does not yield any informative multiplet but only a
dephased signal arising from the spatial resolution issue, as it was described elsewhere.11 Zero-frequency artifacts were
observed for HX on both experimental and simulated spectra
(Fig. 16a, b, e and f), which were identified as mainly arising from a truncation effect in the indirect time domain. Overall, similar lineshapes are found in the simulation and in the experiment, for each correlation (Fig. 16a, c, e and g). The slight differences that are visible between experimental and calculated lineshapes are mainly due to residual shim imperfections in the experiment on the one hand, and the difficulty to adjust the apodization parameters in the simulation on the other hand. The same study was carried on with R-snob refocusing pulses in order to evaluate the ability of this shape to undergo a spatial frequency encoding in the frame of J-edited spectroscopy. An E-Burp2 pulse was preferred to the E-snob shape for the excitation step as bad performance was observed with the latter.
The resulting correlations are strongly degraded compared to the Re-Burp shape (Fig. 16b, d, f and h). Notably, the linewidths are found to be broader, which arise from a less efficient control of the phase by Snob pulses throughout the encoded sample. In particular, for the signal encoded at nB
both the experimental and simulated data confirm that the R-snob shape does not allow for generating a correlation of sufficient quality.
To conclude this part, the gradient encoded selective refo-cusing block that is typically implemented in J-edited techni-ques has the same property as the pure shift block of refining the slice selection process initially created during the prepara-tion step. This allows for implementing shorter selective pulses, as it was demonstrated here with Burp pulses of 60 ms, and thus to optimize the sensitivity of the resulting experiment.
Conclusions
In this paper, we have presented the first theoretical and experimental analysis of the key features that drive resolution and sensitivity in high-resolution NMR methods based on the concept of spatial frequency encoding. A theoretical formalism, based on the modeling of selective pulses encoded by a magnetic field gradient, was introduced to study the slice
selection process underlying the acquisition of pure shift and J-edited NMR spectra, which are some of the most significant methodological developments introduced in the field of high-resolution NMR over the last few decades. The visualization of encoded signals throughout the NMR sample has shown to be a useful tool for deciphering the influence of experimental para-meters such as the shape and the selectivity of the encoded irradiation scheme, and more generally for addressing spatial resolution issues raised by the implementation of gradient encoded refocusing blocks. Firstly, we have shown that Burp shapes are more suitable for spatial frequency encoding than Snob or to a lesser degree Gaussian shapes, because of a better coherence of the phase distribution achieved throughout each encoded cross-section. We note that the Gaussian shape shows however rather good performance, both for excitation and refocusing purposes, when it is implemented in a gradient encoded pulse sequence, and that Snob pulses have been shown elsewhere to give better performance in the framework of real time 1D pure shift NMR spectroscopy to date.
Secondly, we have found that pure shift and J-edited refo-cusing blocks allow for refining the slice selection process during the pulse sequence in which they are implemented, due to a better spatial resolution along with a better phase coherence of gradient encoded refocusing pulses. These key features were exploited to obtain 2D pure shift and J-edited spectra of good quality with shorter Burp pulses, which allowed for optimizing their sensitivity by limiting losses due to relaxation during refocusing of blocks on the one hand, and increasing the height of the encoded slices for each signal on the other hand. These results were obtained on a model spin system involving strongly coupled protons with close chemical shifts, which corre-sponds to the most challenging case for methods based on SFE.
These results shed new light on the recent achievements that have been reported in the field of high-resolution NMR.41
Two approaches have been claimed to provide a general method for extracting individual chemical shifts and/or scalar or dipolar couplings from crowded 1H spectra. On the one
hand, several pulse sequences based on the SFE technique explored in the present work have been developed for such purposes, with a particular emphasis on improving their sensi-tivity and the quality of the resulting spectra.7,8,14,25,35,36,38,42,43
As an illustration, the push-G-SERF experiment13that allows for probing the coupling network involving a selected proton site is composed of the J-edited and pure shift blocks. The optimiza-tions highlighted in this paper can thus be exploited straight-forwardly to improve its resolution and sensitivity. On the other hand, the PSYCHE method takes advantage of a refocusing block implementing Chirp pulses with a low flip angle to act selectively on the fraction of the proton sites that are selected by this gradient encoded frequency-swept pulse, and trigger a pure shift or J-resolved spin evolutions.4,5,44–47For instance, a
PSYCHEDELIC experiment48 has been recently introduced,
which allows in principle for recording the same correlation spectra as G-SERF or push-GSERF experiments. This experi-ment shows however a rather low sensitivity (typically B2% of a standard1H spectrum) as well as it produces several artifacts as
1 5 10 15 20 25 30 35 40 45 50 55 1 5 10 15 20 25 30 35 40 45 50 55
soon as coupled protons with close chemical shifts are probed. The present work paves the way for the rational optimization of the SFE method to a point where the observed performance is at least equivalent to that of the PSYCHE method. In particular, the deeper understanding of the local spin dynamics that takes place during the slice selection process allowed for obtaining high-resolution data for a second order spin system, without sacrificing too much sensitivity.
To conclude, high resolution NMR methods based on a spatial frequency encoding offer a collection of robust and easy-to-implement experiments that have first provided a unique access to the chemical shifts and homonuclear couplings in molecules showing very crowded1H spectra. The simulation presented in this
paper will constitute an interesting basis for designing useful tools for chemists and spectroscopists implementing these methods, both for optimizing the conditions of their analysis, and for extracting a rich analytical content, even in difficult cases where strongly coupled systems yield unconventional lineshapes.
Acknowledgements
This work was supported by the French Research Agency (ANR-2011-JS08-009-01).
Notes and references
1 A. Abragam, The Principles of Nuclear Magnetism, Clarendon Press, Oxford, 1961.
2 C. P. Slichter, Principles of Magnetic Resonance, Berlin, 1990. 3 N. H. Meyer and K. Zangger, Angew. Chem., Int. Ed., 2013, 52,
7143–7146.
4 G. Morris, J. Aguilar, R. Evans, S. Haiber and M. Nilsson, J. Am. Chem. Soc., 2010, 132, 12770–12772.
5 M. Foroozandeh, R. W. Adams, N. J. Meharry, D. Jeannerat, M. Nilsson and G. A. Morris, Angew. Chem., Int. Ed., 2014, 53, 6990–6992.
6 K. Zangger and H. Sterk, J. Magn. Reson., 1997, 124, 486–489. 7 P. Sakhaii, B. Haase, W. Bermel, R. Kerssebaum, G. E. Wagner and K. Zangger, J. Magn. Reson., 2013, 233, 92–95. 8 N. Helge Meyer and K. Zangger, Chem. Commun., 2014, 50,
1488–1490.
9 N. Giraud, L. Beguin, J. Courtieu and D. Merlet, Angew. Chem., Int. Ed., 2010, 49, 3481–3484.
10 N. Giraud, D. Pitoux, J. M. Ouvrard and D. Merlet, Chem. – Eur. J., 2013, 19, 12221–12224.
11 D. Merlet, L. Beguin, J. Courtieu and N. Giraud, J. Magn. Reson., 2011, 209, 315–322.
12 D. Pitoux, Z. Hu, B. Plainchont, D. Merlet, J. Farjon, D. Bonnaffe and N. Giraud, 2015, submitted
Q6 .
13 D. Pitoux, B. Plainchont, D. Merlet, Z. Hu, D. Bonnaffe´, J. Farjon and N. Giraud, Chem. – Eur. J., 2015, 21, 9044–9047. 14 N. Gubensak, W. M. F. Fabian and K. Zangger, Chem.
Commun., 2014, 50, 12254–12257.
15 S. R. Chaudhari and N. Suryaprakash, ChemPhysChem, 2015, 16, 1079–1082.
16 N. Lokesh, S. R. Chaudhari and N. Suryaprakash, Chem. Commun., 2014, 50, 15597–15600.
17 P. Nicholas, D. Fushman, V. Ruchinsky and D. Cowburn, J. Magn. Reson., 2000, 145, 262–275.
18 N. Giraud, M. Joos, J. Courtieu and D. Merlet, Magn. Reson. Chem., 2009, 47, 300–306.
19 D. Pitoux, Z. Hu, B. Plainchont, D. Merlet, J. Farjon, D. Bonnaffe´ and N. Giraud, Magn. Reson. Chem., 2015, 53, 836–844. 20 T. D. W. Claridge, in Tetrahedron Organic Chemistry Series,
ed. D. W. C. Timothy, Elsevier, 2009, vol. 27, pp. 335–373. 21 A. J. Pell and J. Keeler, J. Magn. Reson., 2007, 189, 293–299. 22 P. J. Hajduk, D. A. Horita and L. E. Lerner, J. Magn. Reson.,
Ser. A, 1993, 103, 40–52.
23 K. Zangger, M. Oberer and H. Sterk, J. Magn. Reson., 2001, 152, 48–56.
24 L. Lokesh and N. Suryaprakash, Chem. Commun., 2014. Q7 25 A. Cotte and D. Jeannerat, Angew. Chem., Int. Ed., 2015, 54,
6016–6018.
26 M. Foroozandeh, P. Giraudeau and D. Jeannerat, Chem-PhysChem, 2011, 12, 2408–2410.
27 M. Foroozandeh, P. Giraudeau and D. Jeannerat, Magn. Reson. Chem., 2013, 51, 808–814.
28 R. Freeman, Chem. Rev., 1991, 91, 1397–1412.
29 H. Geen and R. Freeman, J. Magn. Reson., 1991, 93, 93–141. 30 R. Freeman, J. Mol. Struct., 1992, 266, 39–51.
31 L. Emsley, Methods Enzymol., 1994, 239, 207–246.
32 S. Berger, Prog. Nucl. Magn. Reson. Spectrosc., 1997, 30, 137–156. 33 H. Geen and R. Freeman, J. Magn. Reson., 1991, 93, 93–141. 34 E. Kupce, J. Boyd and I. D. Campbell, J. Magn. Reson., Ser. B,
1995, 106, 300–303.
35 K. Zangger, Prog. Nucl. Magn. Reson. Spectrosc., 2015, 86–87, 1–20. 36 N. H. Meyer and K. Zangger, ChemPhysChem, 2014, 15, 49–55. 37 A. J. Pell, R. A. E. Edden and J. Keeler, Magn. Reson. Chem.,
2007, 45, 296–316.
38 J. Mauhart, S. Glanzer, P. Sakhaii, W. Bermel and K. Zangger, J. Magn. Reson., 2015, 259, 207–215.
39 N. H. Meyer and K. Zangger, Synlett, 2014, 920–927. 40 R. W. Adams, L. Byrne, P. Kiraly, M. Foroozandeh, L. Paudel,
M. Nilsson, J. Clayden and G. A. Morris, Chem. Commun., 2014, 50, 2512–2514.
41 L. Castan˜ar and T. Parella, Magn. Reson. Chem., 2015, 53, 399–426. 42 S. Glanzer, E. Schrank and K. Zangger, J. Magn. Reson., 2013,
232, 1–6.
43 S. R. Chaudhari and N. Suryaprakash, RSC Adv., 2014, 4, 15018–15021.
44 M. Foroozandeh, R. W. Adams, M. Nilsson and G. A. Morris, J. Am. Chem. Soc., 2014.
45 I. Tima´ri, L. Szila´gyi and K. E. Ko¨ve´r, Chem. – Eur. J., 2015, 21, 13939–13942.
46 J. A. Aguilar, J. Cassani, M. Delbianco, R. W. Adams, M. Nilsson and G. A. Morris, Chem. – Eur. J., 2015, 21, 6623–6630. 47 B. A. F. Le Bailly, L. Byrne, V. Diemer, M. Foroozandeh,
G. A. Morris and J. Clayden, Chem. Sci., 2015, 6, 2313–2322. 48 D. Sinnaeve, M. Foroozandeh, M. Nilsson and G. A. Morris,
Angew. Chem., Int. Ed., 2016, 55, 1090–1093.
1 5 10 15 20 25 30 35 40 45 50 55 1 5 10 15 20 25 30 35 40 45 50 55 PCCP Paper