HAL Id: hal-00742225
https://hal.univ-brest.fr/hal-00742225
Submitted on 16 Oct 2012
HAL is a multi-disciplinary open access
archive for the deposit and dissemination of
sci-entific research documents, whether they are
pub-lished or not. The documents may come from
teaching and research institutions in France or
abroad, or from public or private research centers.
L’archive ouverte pluridisciplinaire HAL, est
destinée au dépôt et à la diffusion de documents
scientifiques de niveau recherche, publiés ou non,
émanant des établissements d’enseignement et de
recherche français ou étrangers, des laboratoires
publics ou privés.
Influence of headphone position in pure-tone audiometry
Mathieu Paquier, Vincent Koehl, Brice Jantzem
To cite this version:
Mathieu Paquier, Vincent Koehl, Brice Jantzem. Influence of headphone position in pure-tone
au-diometry. Acoustics 2012 joint congress (11ème Congrès Français d’Acoustique - 2012 Annual IOA
Meeting), Apr 2012, Nantes, France. pp.3925-3930. �hal-00742225�
Influence of headphone position in pure-tone audiometry
M. Paquier
a, V. Koehl
aand B. Jantzem
ba
Universit´e de Bretagne Occidentale, 6, avenue Victor Le Gorgeu, CS 93837, 29238 Brest
Cedex 3, France
b
Centre Auditif Entendre, 4, square Commandant L’Herminier, 29200 Brest, France
[email protected]
Pure-tone audiometry (measurement of absolute thresholds using pure tones) is the main test for the diagnosis of hearing loss. It can be achieved by using either air conduction (with headphones or loudspeakers) or bone conduction (by placing a vibrator on the mastoid bone behind the ear). The HeadPhone Transfer Function (HPTF) describes both the headphone response and the coupling to a listener’s ear. Recent papers indicated that modifications of headphone position can lead to changes in HPTF, and that these spectral modifications can be audible. The aim of the present study is to determine whether the headphone placement over a listener’s ears has an influence on pure-tone audiometric tests. Audiograms were performed several times on normal-hearing subjects, for different headphone positions (obtained by placing/removing the headphone over the listener’s ears), the absolute thresholds measurements being repeated for each headphone position. The dispersions of absolute thresholds with and without modification of the headphone position were compared in order to determine whether the headphone positioning is an issue for audiometric tests.
1
Introduction
1.1 Head related transfer function
The HeadPhone Transfer Function (HPTF) describes both the headphone response and the coupling to a listener’s ear. The HPTFs can be measured, averaged (for repeated measurements) and inverted to compensate for the headphone influence and recreate the exact signals at the listener’s ears. According to Pralong and Carlile [1], a listener-specific equalization is mandatory: HPTFs measurements were performed on 10 subjects equipped with the same headphone by using an in-ear recording system and significant inter-individual differences were reported for frequencies ranging from 4 to 10 kHz. These differences may result in errors in localization tasks because of non-individualized equalization.
1.2 HPTF and headphone position
Nevertheless, the signals being equalized or not - as it is the case for stereo recordings listened to over headphones and even for binaural restitution in numerous cases - the scattering caused by differences in the headphone position over listeners’ ears is not taken into account. However, it has been shown that slight modifications in the headphone placement can result in large spectral differences. Toole [2] reported that these differences are less than 5 dB below 2 kHz, but ranged from 8 to 15 dB above 4-5 kHz. These differences were observed for 3 successive replacements on 3 human and on 3 dummy heads with 4 different types of headphones. Wightman and Kistler [3] and Pralong and Carlile [1] measured respectively the HPTFs on 10 humans for 10 headphone placements and on 10 humans and 1 manikin for 6 headphone placements. They reported that standard deviations of the response magnitudes could reach up to 5 dB from 200 Hz to 14 kHz. McAnally and Martin [4] measured HPTFs for 20 headphone placements on 6 human heads. Standard deviations were generally smaller than 2.5 dB for frequencies up to 10 kHz, and be as high as 9 dB above 10 kHz. Kulkarni and Colburn [5] also observed a standard deviation of 9 dB on HPTFs measured for 20 headphone placements on an acoustic manikin for frequencies ranging from 9 to 14 kHz.
1.3 Localisation and headphone position
Martin et al. [6] showed that the headphone placement seemed to have a minor influence on a source localization task: the variability observed in HPTF magnitudes
variability observed in filtered HRTFs magnitudes is generally considerably higher than that of filtered HPTFs. This suggests that the spectral information used by listeners to localize sound is unlikely to be masked by the variability in HPTF magnitude.
1.4 Audible influence of headphone
position
In a previous study, Paquier et al. [7] showed that spectral modifications introduced by slight but realistic changes in the headphone position over a listener’s ears could be audible: recordings were performed on a dummy head on which 2 different headphone models were placed 8 times each. Music excerpts and pink noise were played over the headphones and recorded with microphones located at the entrance of the blocked ear canal. These recordings were then presented to expert and naïve listeners over a single test headphone. The subjects had to assess the recordings in a 3I3AFC task to discriminate between the different headphone positions. With the exception of one music excerpt for naïve listeners only, subjects were able to discriminate between the headphone positions.
1.5 Variability of hearing thresholds
For most audiological applications, hearing thresholds are obtained with 5-dB resolution in the 125 Hz to 8 kHz range. Many studies have shown good reliability of repeated threshold measurements in this conventional range [8,9]. The use of 5-dB step sizes was adopted for the majority of these reliability studies, and the variability of hearing thresholds is therefore considered to be approximately 5 dB [10].
However, studies showed that self-recording audiometry (using 1-dB step sizes) resulted in slightly more sensitive thresholds than manual audiometry (sensitivity improved of 1–2 dB) [11].
Finally, investigators have compared threshold reliability between conventional- and high-frequency ranges (above 8 kHz) and have reported that reliability is equally good in both ranges [12].
1.6 Influence of headphone position on
hearing thresholds
The headphone position appears as a crucial issue in the audiometer calibration process (using either artificial or dummy heads) and is well described by standards and recommendations [13,14]. Nevertheless, the effect of the headphone position on the patient’s head is rarely taken into
Above 8000 Hz, where the quarter wavelength of sound is less than the length of the ear canal, standing wave patterns create large variations in sound pressure at different points within the canal [12]. In addition, because of the angle between the tympanic membrane and the ear canal, the distribution of sound pressure across its surface is not uniform. According to Stinson et al. [23], these factors result in pressure variations at the tympanic membrane as large as 15 to 20 dB for different listeners given the same earphone output. Thus, changes in the position of a transducer would be expected to have great effects on high frequency tones in the ear canal.
Steinberg and Munson [15] observed variability related to the fit of earphone, with standard deviations of 5 to 7 dB, when measuring hearing thresholds.
Hickling [16] showed that the removal and replacement of TDH-39 supra-aural headphone significantly decreased the reliability of 6 and 8 kHz thresholds in comparison to repeated threshold measurements for the same headphone position (but no effect at 1 and 2 kHz).
Erlandsson et al. [17] found a higher variability of repeated auditory thresholds when a circum-aural headphone was repeatedly replaced versus when thresholds were retested with the headphone fixed in position for each repetition. The authors suggested that a circum-aural headphone deforms the pinna, which can affect the transmission of sound pressure to the ear canal. On the contrary, Gauz et al. [18] did not note any significant effect of circum-aural headphone replacement on threshold measurements.
Larson et al. [19] and Henry et al. [20] conducted test-retest measurements using insert earphones, with a test-retest with the earphones left in place and another one after removal and replacement of earphone. They reported no significant effect on test reliability when insert earphones were replaced.
Atherley et al. [21] compared test-retest variances at 1,3,6, and 8 kHz for circum-aural and supra-aural assemblies. Threshold measurements were performed on the subject's left ear, then the headset, either circum-aural or supra-aural, was removed for a few seconds and replaced by the subject himself. Following this, the threshold testing procedure was repeated again on the left ear. At 6 and 8 kHz, the "within-ear" variances for the circum-aural assembly were 4.8 and 8.8 dB respectively, and were significantly smaller than the corresponding values for the supra-aural device. At 1 and 3 kHz, the reliability was substantially unchanged. It would seem, therefore, that the use of the circum-aural headphone will increase the accuracy of auditory threshold determinations at high frequencies [22].
1.7 Present study
Auditory thresholds of ten subjects equipped with the Sennheiser HD 600 circum-aural headphone (often used in psychoacoustics experiments) were measured 3 times. The headphone position was modified after the first or the second measurement at random. Threshold variability was then investigated by comparing the audiograms obtained on both identical and different headphone positions.
2
Material and methods
2.1 Audiometry procedure
A modified ANSI procedure [22] was used. The audiometry included measurements at octave intervals from 250 Hz through 8 kHz, and additional thresholds were tested at 125 Hz, 6 kHz, 11 kHz, and 14 kHz. Threshold exploration was carried out by presenting pulsed tones lasting 2.5 s. The level of successive presentation was determined by the preceding response: in the original ANSI recommendation [22], each failure to respond to a signal leads to successive increases of 5 dB steps until the first response occurs. The intensity is then decreased by 10 dB and another ascending series is begun. In this study, a higher precision was seeked. The algorithm consisted then of a series of three bracketing procedures, each providing progressively smaller step sizes to finally result in threshold responses with 1-dB resolution. The initial bracketing series (Series 1) used step increments of up 5 dB, down 10 dB to quickly bracket the threshold level to within 10dB. Subsequent bracketing series used algorithms of up 2 dB, down 5 dB (Series 2) and up 1 dB, and down 2 dB (Series 3). Final threshold was defined in Series 3, as the lowest hearing level at which responses occur in at least one-half of a series of ascending trials, with a minimum of two responses out of three required at a single level.
2.2 Auditory Listening test
Fourteen normal-hearing subjects, who were all unpracticed in hearing experiments and aged between 20 and 50 years, participated in the study. Listeners were required to have hearing thresholds ≤ 25 dBHL in the 125 Hz to 8 kHz frequency range. Threshold measurements were made only on the subject’s left ear. The headphone was centered over the ears and its position was adjusted by the subject himself for most comfortable listening. The space under the headphone was clear of long hair, glasses, and other obstacles.
Subject sat in front of a computer screen in an audiometric booth. The automatic procedure was run using a MATLAB graphical user interface controlled by a PC located out of the booth.
Stimuli were played back over the test headphone (Sennheiser HD600) by using a RME Fireface 800 soundcard. This circum-aural headphone is often used in psychoacoustics experiments and a recent study [24] has shown that modifications of the position of this headphone on a dummy led to audible changes.
During the playback, the instruction “Listen” was displayed on the screen. Afterward, this message was replaced by the question “Did you hear?” and the subject had to click either the “Yes” or “No” buttons using a mouse.
After a test (measurement of thresholds for each of the ten frequencies), two retests were conducted. Between the first and the second test or between the second and the third test (randomized), listener received the instruction (by displaying a message on the screen) to remove and replace the headphone on his head. No pause was allowed. The whole test lasted between 45 and 60 minutes.
3
Results
3.1 Calculation of threshold differences
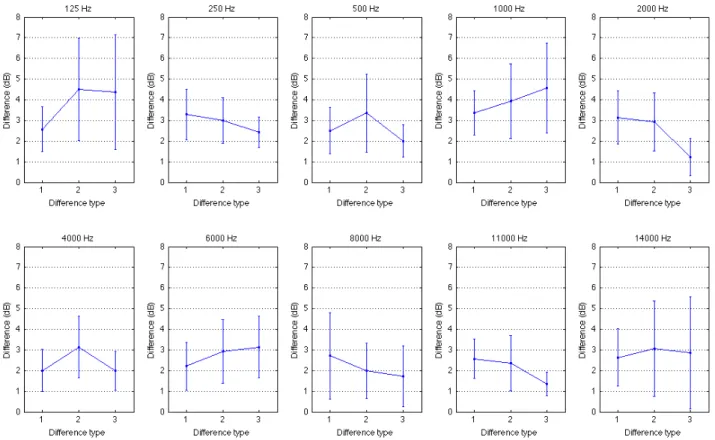
Let’s denote the three consecutives audiograms A, B, and C. Three differences were calculated: B-A, C-B, C-A. Figure 1 shows the absolute value of these differences for each frequency and for all subjects. If the headphone was repositioned between the first (A) and the second audiogram (B), the two differences |B-A| and |C-A| were obtained from different headphone positions; |C-A| is then denoted “different positions, non-consecutive measurements”, and |B-A| “different positions, consecutive measurements”. The difference |C-B| was obtained from the same headphone position, and is denoted “same position”. If the headphone was repositioned between the second (B) and the third audiogram (C), “same position” applies to |B-A|, “different positions, consecutive measurements” to |C-B| and “different positions, non-consecutive measurements” still applies to |C-A|.
3.2 Effect of headphone position
The ANOVA showed no significant effect of the difference type: F(2,396)=1.98; p=0.14. This means that for all subjects and for all frequencies, the measurement variability is not modified when repositioning the headphone.
3.3 Order effects
During the test, practice could progressively decrease the thresholds of subjects [25], or conversely tiredness could progressively increase the thresholds. As a result, this potential order effect could hide an effect of the headphone removing.
An ANOVA carried out on the thresholds (not the differences) indicated no significant effect of the measurement order (F(2,396)=0.81; p=0.45): no effect of practice or tiredness was observed.
3.4 Effect of headphone position for each
frequency
For two frequencies, the ANOVA indicated a significant effect of the difference type: at 2 kHz and at 11 kHz (figure 1), the difference between thresholds issued from the same position is significantly smaller than the two differences between two different positions (respectively F(2,27)=4.45; p=0.02 and F(2,27)=3.74 ; p=0.04). This finding is quite surprising: at 2 kHz, an effect of the headphone position was hardly expectable because of the large wavelength compared to the dimensions of the headphone and ear canal. A theoretical explanation of this effect can be easily proposed for 11 kHz, but if the headphone position has an effect at 11 kHz, why not at 14 kHz where it is far from being significant (F(2,27)=0.08, p=0.92)? In addition, except 2 kHz and 11 kHz, this effect did not prove to be significant at any frequency and not trend could be revealed.
Difference type “1” : different positions, consecutive measurements Difference type “2” : different positions, consecutive measurements Difference type “3” : same position
3.5 Effect of headphone position for each
subject
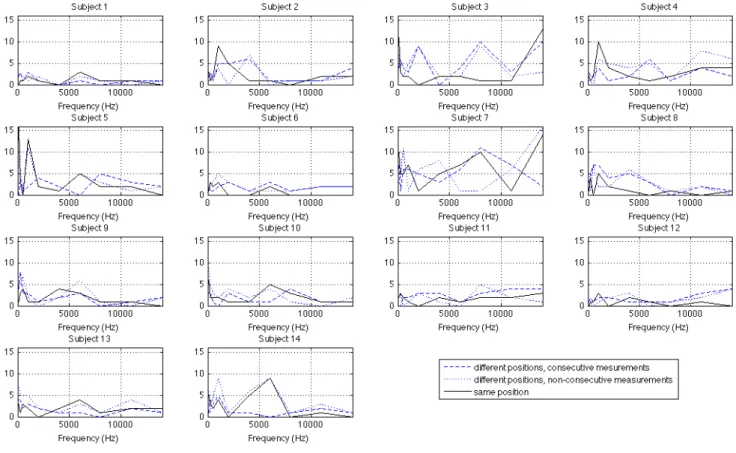
The subject effect on the difference between threshold measurements was highly significant (F(13,396=7.94, p<0.0001): this means that the headphone position was important for several subjects, whereas it had a negligible effect for other ones. This subject effect could hide a potential smaller effect of the type of difference. Figure 2 shows the absolute value of the three difference types for each subject and for each frequency. No statistical analysis could be carried out because of the unique measurement for a given subject, a given frequency, and a given type of difference. However, several observations can be made: Firstly, for several subjects (3, 7, 14), the variability between threshold measurements was large, whatever the difference type (when the headphone was removed or not). On the contrary, several other subjects always showed very low variability (whatever the difference type).
Secondly, several subjects (6, 8, 14) seemed to be particularly sensible to the headphone position (the difference “same position” is lower than the differences “different positions”), but for others subjects the three difference types were equivalent and the “natural” variability of threshold measurements seemed to be as large as the variability caused by the headphone repositioning. Some more subjects are required to confirm or not the existence of a listener group that would be more sensitive to headphone positioning, but such a group could be explained by the anatomy of the ear canal [12,16,17].
5
Conclusion
In all (for all subjects and for all frequencies), the measurement variability was not modified when repositioning the Sennheiser HD600 circum-aural headphone. However, at 2 and 11 kHz, the reliability of the threshold measurements was significantly weaker when the headphone was replaced. Finally, large differences are observable between subjects (differences about thresholds, but also differences about reliability between measurements). As a result, headphone position could be a crucial issue when measuring hearing thresholds for several subject, but not for all.
Figure 2: Absolute values of differences (in dB) between threshold measurements as a function of frequency, for each of the 11 subjects. Dotted and dashed lines represent the difference between measurements issued from two different positions.
Solid lines represent differences between measurements with the same headphone position.
References
[1] D. Pralong and S. Carlile, “The role of individualized head-phone calibration for the generation of high fidelity virtual auditory space”, Journal of the
Acoustical Society of America 100(6), 3785-3793
(1996)
[2] F.E. Toole, “The acoustics and psychoacoustics of headphones,” AES 2nd International Conference, Anaheim, CA, USA, May 11–14 (1984)
[3] F. L. Wightman and D.J. Kistler, “Headphone simulation of free-field listening. I: stimulus synthesis”, Journal of the Acoustical Society of
America 85(2), 858-867 (1989)
[4] K.I. McAnally and R.L. Martin, “Variability in the head-phone-to-ear-canal transfer function”, Journal of
the Audio Engineering Society 50(4), 262-266 (2002)
[5] A. Kulkarni and H.S. Colburn, “Variability in the characteri-zation of the headphone transfer function”,
Journal of the Acoustical Society of America 107(2),
1071-1074 (2000)
[6] R. L. Martin, K. I. McAnally and M. A. Senova, “Free-field equivalent localization of virtual audio”, Journal
of the Audio Engineering Society 49, 14-22 (2001)
[7] M. Paquier, V. Koehl, and B. Jantzem, “Effect of headphone transfert function scattering over sound perception”, IEEE Workshop on Applications of Signal
Processing to Audio and Acoustics, October 16-19,
New Paltz, NY, 181-184 (2011)
[8] S. Hickling, “The validity and reliability of pure tone clinical audiometry”, The New Zealand Medical
Journal 63, 379–82 (1964).
[9] R.S. Tyler, E.J. Wood, “A comparison of manual methods for measuring hearing levels”, Audiology 19, 316–29 (1980)
[10] H.A. Newby, “Audiology”, New York: Appleton-Century-Crofts (1972)
[11] M.E. Lutman, M.A. Cane and P.A. Smith, “Comparison of manual and computer-controlled self-recorded audiometric methods for serial monitoring of hearing”, British Journal of Audiology 23, 305–15 (1989)
[12] B. Zhou, Green DM. Reliability of pure-tone thresholds at high frequencies, Journal of the
Acoustical Society of America 98, 828–36 (1995).
[13] ANSI S3.6-2004, “Specification for audiometers” (2004)
[14] ISO 389-1 Acoustics “Reference zero for the calibration of audiometric equipment. Part 1 - Reference equivalent threshold sound pressure levels for pure tones and supra-aural earphones” (1998) [15] J.C. Steinberg and W.A. Munson, Deviations in the
loudness Judgments of 100 people”, Journal of the
Acoustical Society of America 8, 71-80 (1936)
[16] S. Hickling, “Studies on the reliability of auditory
[17] B. Erlandsson, H. Hakanson, A. Ivarsson and P. Nilsson, “The reliability of Bekesy sweep audiometry recording and effects of the earphone position”, Acta
Oto-Laryngologica 366, 99–112 (1980)
[18] M.T. Gauz, D.O. Robinson and G.M. Peters, “High-frequency Békésy audiometry: III. Reliability and validity revisited”, Journal of Auditory Research 2, 167–80 (1981)
[19] V.D. Larson, W.A. Cooper, R.E. Talbott, D.M. Schwartz, C. Ahlstrom and A.R. DeChicchis, “Reference threshold sound-pressure levels for the TDH-50 and ER-3A earphones”, Journal of the
Acoustical Society of America 84, 46–51 (1988)
[20] J.A. Henry, C.L. Flick, A. Gilbert, R.M. Ellingson and S.A. Fausti, “Reliability of hearing thresholds: computer-automated testing with ER-4B Canal PhoneTM earphones”, Journal of Rehabilitation
Research and Development 38(5), 567-581 (2001)
[21] G. R. C. Atherley, T. I. Hempstock, P. Lord, and J. G. Walker, “Reliability of Auditory Threshold Determinations Using a Circumaural‐Earphone Assembly”, Journal of the Acoustical Society of
America 42(1), 199-203 (1967)
[22] ANSI S3.21-2004, Methods for Manual Pure-Tone Threshold Audiometry (2004)
[23] M.R. Stinson and E.A.G. Shaw, “Wave effects and pressure distribution in the ear canal near the tympanic membrane”, Journal of the Acoustical Society of
America 71, S88. (1982)
[24] M. Paquier M and V. Koehl, Audibility of headphone positioning variability, 128th Audio Engineering
Society Convention, paper 8147, Londres, (2010)
[25] J. Zwislocki, F. Maire, A.S. Feldman and H. Rubin, “On the effect of practice and motivation on the threshold of audibility”, Journal of the Acoustical