HAL Id: hal-00874773
https://hal.archives-ouvertes.fr/hal-00874773
Submitted on 18 Oct 2013
HAL is a multi-disciplinary open access
archive for the deposit and dissemination of
sci-entific research documents, whether they are
pub-lished or not. The documents may come from
teaching and research institutions in France or
abroad, or from public or private research centers.
L’archive ouverte pluridisciplinaire HAL, est
destinée au dépôt et à la diffusion de documents
scientifiques de niveau recherche, publiés ou non,
émanant des établissements d’enseignement et de
recherche français ou étrangers, des laboratoires
publics ou privés.
Linning Peng, Sylvain Haese, Maryline Hélard
To cite this version:
Linning Peng, Sylvain Haese, Maryline Hélard. Frequency Domain LED Compensation for
Nonlin-earity Mitigation in DMT Systems. IEEE Photonics Technology Letters, Institute of Electrical and
Electronics Engineers, 2013, 25 (20), pp.2022-2025. �hal-00874773�
Abstract—In this letter, a novel linear frequency-domain
compensation (FDC) of the resonant cavity light emitting diode (RC-LED) for discrete multi-tone (DMT) modulation has been used for the first time in the nonlinearity mitigation of step-index polymer optical fiber (SI-POF) communication systems. The proposed FDC method can be easily implemented in any multi-carrier communication system. Compared to the classical DMT scheme, FDC DMT benefits from higher power efficiency in terms of clipping for peak-to-average power ratio (PAPR) reduction. Two SI-POF experimental setups with different 3 dB POF bandwidths are built with the same RC-LED. Under the same experimental conditions, a higher transmission rate has been achieved with the proposed FDC DMT method compared with classical DMT at the same bit error rate (BER) level.
Index Terms— Linear Frequency Domain Compensation,
DMT, OFDM, POF, LED, RC-LED, Nonlinearity, PAPR, clipping
I. INTRODUCTION
HE demands of cost-efficient and high-speed optical communications for short range applications have recently increased. The polymer optical fiber (POF) is considered as a low-cost solution for Gigabit connections [1]. Large core diameter POFs (Ø 1mm) own the advantages of easy connection and bend insensitivity, which are extremely suitable for optical home networking [2].
The low-cost resonant cavity light emitting diodes (RC-LED) have been largely adopted in POF communications with on-off-keying modulation. Recently, there is an increasing interest in utilizing multi-carrier modulation techniques for optical communications [1][3]. Discrete multi-tone (DMT) modulation, similar to well-known orthogonal frequency division multiplexing (OFDM) modulation, can approach the channel capacity in POF transmission employing bit-loading techniques [3-5].
However, it has been shown that the nonlinearity of LED significantly degrades the overall performance of the DMT systems [6]. Several LED nonlinearity mitigation techniques have been proposed for optical systems, including time domain pre-distortion [7] and some sophisticated peak-to-average power ratio (PAPR) reduction techniques such as the one presented in [8]. The LED static transfertion can be numerically
Manuscript received 12 July 2013, revised 13 August 2013
The authors are with Institute of IETR (Electronic and Telecommunications in Rennes), INSA (National Institute of Applied Sciences) of Rennes, Rennes 35700, France. (E-mails: {linning.peng, sylvain.haese, maryline.helard} @insa-rennes.fr).
modeled by Taylor expansion polynomials [9]. However, this LED nonlinearity model is based on a static transfer function and is no longer valid when RC-LED works at a large bandwidth [6]. Therefore, it is hard to implement a practical time domain pre-distortion for a Gigabit DMT system with a used bandwidth around hundreds of MHz. Hence, the PAPR reduction techniques such as clipping were commonly used to increase the power efficiency in DMT [4][10]. However, due to the nonlinearity, the optimum clipping value was about 10 dB [6], which cannot maximize the power efficiency of the DMT transmission with the LED modulation.
In this letter, we propose and experimentally demonstrate a RC-LED nonlinearity mitigation method for DMT system based on RC-LED linear frequency-domain compensation (FDC). A RC-LED model including its frequency response and nonlinearity function is firstly presented. Owning to the knowledge of measured RC-LED transfer function, FDC can be easily performed before the DMT modulation. With the help of the FDC, DMT system power efficiency can be improved by a straightforward clipping technique. Finally, we extend the experimental investigation of the successful utilization of FDC DMT over 50 m SI-POF links with different transmission
bandwidths using conventional low-cost components.
Moreover, we compare with classical DMT systems in order to highlight the efficiency of our technique.
II. FREQUENCY DOMAIN LEDCOMPENSATION FOR
NONLINEARITY MITIGATION
A. LED Nonlinearity Phenomenon
In this work, a commercially available RC-LED (FC300R-120TM) is considered for a Gigabit POF transmission system. As the output of the DMT system is a bipolar signal with both positive and negative values, a biasing current is
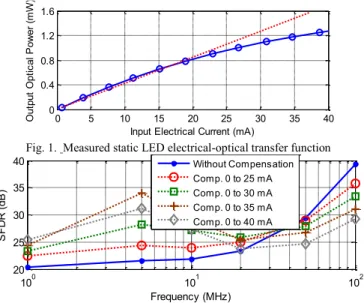
added before the RC-LED. The RC-LED static
electrical-optical transfer function can be measured with different values of biasing current and is shown in Fig. 1. As illustrated in the figure, RC-LED suffers from strong nonlinearity when working current is higher than 20 mA. In addition, a dynamic performance of the LED nonlinearity can be measured by the spurious free dynamic range (SFDR) including the harmonics. In our system, the studied RC-LED provides a 3 dB bandwidth of around 100 MHz. Therefore we generate Sine waveforms at the frequencies of 1 MHz, 5 MHz, 10 MHz, 20 MHz, 50 MHz, and 100 MHz. The Sine waveforms were transmitted by the RC-LED with a peak-to-peak current range of 0 to 40 mA. After passing an
Frequency Domain LED Compensation for
Nonlinearity Mitigation in DMT Systems
Linning Peng, Sylvain Haese, and Maryline Hélard
attenuator, the optical signals were directly received by a PIN diode with a 3 dB bandwidth of 625 MHz (FC1000D-120TM). The measured SFDR performance without any compensation is shown in Fig. 2, which is the drawn with a line and marked by points. As shown in the figure, due to the RC-LED nonlinearities, the measured LED SFDR in the frequency region from 1 to 20 MHz is degraded. Meanwhile, the frequency region from 20 to 100 MHz has a better linearity property and an improved SFDR.
Although the time-domain digital pre-distortion can be introduced to compensate the LED nonlinearity [11], the computational complexity dramatically increases when the nonlinearity function with high order polynomials is adopted. Furthermore, we find that the performance improvement is minor in case of trying to compensate RC-LED with the low-complexity look-up table techniques. The performance of the time-domain compensation is shown in Fig. 2 with dotted line. The SFDR in the frequency region from 1 to 20 MHz can be improved by time-domain compensations. However, the SFDR in the frequency region from 20 to 100 MHz degrades when time-domain compensations are employed.
B. LED Linear Frequency-Domain Pre-Compensation
In a RC-LED transmission system, it is worth noting that the high frequency part of transmitted signal is more attenuated and therefore suffers less from the nonlinearity. In contrast, signals at low frequencies suffer more significantly from the nonlinearity. Therefore, we propose to introduce the low-pass characteristic of RC-LED into the RC-LED model. Thus a RC-LED model including RC-LED response and nonlinear polynomials is expressed as follows:
where is the output optical power, is the input signal current, is the impulse response of the RC-LED, is the biasing current, is the coefficient of the order in LED nonlinearity transfer function, and is the time.
It is not straightforward to derive a mathematical
optimization based on the proposed model. Therefore, we propose to perform a pre-compensation in the source signal. The pre-compensated LED model is given as:
where is the pre-compensation function. Then we define is the Fourier transfer of the . In case of the is known in the transmitter, we can set the
pre-compensation function as an inverse function of ,
which can be presented in the frequency domain as:
where is the frequency domain function of ,
is the inverse function of . Then,
The derived equation only contains the LED nonlinearity polynomials, which has been simplified to the classical model in [6]. Being different from the time-domain digital pre-distortions, we propose a straightforward digital clipping approach after the FDC DMT modulation in order to improve the power efficiency. The proposed joint clipping and FDC optimization can easily mitigate RC-LED nonlinear distortions in the optical DMT system with very simple approach.
C. Frequency-Domain Implementation in DMT Systems
The DMT modulation can be performed by an inverse fast Fourier transform (IFFT). We subsequently introduce to the DMT modulation. The pre-compensated DMT signal is represented as:
where is the signal at subcarrier, is the subcarrier number. In most of DMT systems, is mapped with different quadrature amplitude modulation (QAM) orders and powers according to the channel conditions, which could adaptively maximize the transmission rate.
A block diagram of the frequency-domain LED compensation in DMT systems is described in Fig. 3. The frequency domain process of FDC can be easily performed just before the IFFT. Furthermore, the bit-loading technique can co-exist with the FDC DMT system. The bit-loading is merely performed after the FDC according to the channel conditions. Fig. 1. Measured static LED electrical-optical transfer function
0 5 10 15 20 25 30 35 40 0
0.4 0.8 1.2
Input Electrical Current (mA)
O u tp u t O p ti c a l P o w e r Bit source (bit-loading) M-QAM Mapping (bit-loading) X X DMT Modulator (2N-points IFFT) Power Allocation factor Power Allocation factor FDC factor FDC factor Sucarrier Xn Frequency Domain Compensation Bit-loading & Power Allocation DMT Modulation Adding Cyclic Prefix
Fig. 3. Frequency-domain LED pre-compensation in the DMT systems
Fig. 2. Measured dynamic SFDR performance of the LED with and without time-domain compensation 100 101 102 20 25 30 35 40 Frequency (MHz) S F D R ( d B ) Without Compensation Comp. 0 to 25 mA Comp. 0 to 30 mA Comp. 0 to 35 mA Comp. 0 to 40 mA
III. EXPERIMENTAL SETUP
We built a real POF transmission system to verify the proposed method. The experimental setup is depicted in Fig. 4. The RC-LED worked with a 20 mA biasing current. Therefore we can use the RC-LED with a full range output optical power.
Two 50 m PMMA Ø 1mm SI-POFs (Eska™ MEGA and
Eska™ Premier) were used. The 3 dB bandwidth of
Eska™ MEGA fiber is , which is wider than
RC-LED. The 3 dB bandwidth of Eska™ Premier fiber is equal
to , which is less than RC-LED. The coupled
power into the POFs was -0.2 dBm. The received optical power was measured at -9.4 dBm after a 50 m transmission over Eska™ MEGA and -9.9 dBm in the Eska™ Premier system.
In the proposed algorithms, the LED transfer function should be known as a priori information. We measured the RC-LED transfer function from the autocorrelation function of the frequency response in a back-to-back transmission [12]. Then the frequency-domain compensation coefficients
can be obtained and shown in Fig. 5(a).
The classical DMT and proposed FDC DMT transmission symbols were generated with MatlabTM. The IFFT size is 2048. A 32 samples cyclic prefix was added. The digital-to-analog convertor (DAC) worked at a sampling rate of 1 GSamples/s. DMT symbols with 512 probing subcarriers from 1 to 512 were initially transmitted to get the subcarrier SNR. Thus the used bandwidth of the transmitted DMT symbols was 250 MHz. The signal spectrums at the output of the LED are shown in Fig. 5(b). As shown in the figure, the signal spectrum of FDC DMT signal is relatively flat, compared to the conventional DMT signal. The probing DMT symbols were digitally clipped before DAC. In order to reach a tradeoff between system power efficiency and nonlinearity mitigation, different clipping ratios
were experimentally investigated. The clipping ratio is defined as:
where is the clipping threshold.
At the receiver, the received DMT signal is off-line processed. According to the measured subcarrier SNR, bit-loading was adopted to fulfill the measured channel capacities. The objective BER was set as . Finally, DMT symbols with the optimized transmission bit rate were transmitted over the two POFs. Performance of the DMT transmission with and without FDC was investigated.
IV. MEASUREMENT RESULTS
The SNR at each subcarrier can be measured according to the received probing DMT symbols. As the measured results shown in Fig. 6, DMT symbols with the FDC gained an improved SNR at the subcarriers in high frequency range. Especially in the ESKATM Mega system (LED’s bandwidth is less than the fiber’s bandwidth), the SNR improvement was significant for 11 dB, 9 dB and 7 dB clipping ratios.
Furthermore, in the ESKATM Premier system (LED’s
bandwidth is higher than the fiber’s bandwidth), the FDC DMT can obtain an evident SNR improvement when system was clipped at 7 and 9 dB.
The obtained transmission rates with a BER restriction below were described in Fig. 7. Based on the water filling theorem, it is proved that the subcarrier with higher SNR should be allocated with more power [5]. Therefore in case of the linear scenario, the FDC process leads to the power over-weighted at the frequencies with lower SNR and causes
Fig. 7. Available transmission rate of the SI-POFs (BER at )
6 7 8 9 10 11 12 13 14 0.7 0.8 0.9 1 1.1 1.2 1.3 1.4 1.5 Clipping Ratio (dB) T ra n s m is s io n D a ta R a te ( G b p s )
FDC SI-POF (ESKA Mega) SI-POF (ESKA Mega) FDC SI-POF (ESKA Prem.) SI-POF (ESKA Prem.)
(a) (b)
Fig. 6. Measured subcarrier SNR with different clipping ratio: (a) SI-POF ESKATM Mega, (b) SI-POF ESKATM Premier
0 128 256 384 512 10 15 20 25 Subcarrier Number S u b ca rr ie r S N R ( d B ) FDC, Clip 11dB FDC, Clip 9dB FDC, Clip 7dB Clip 11dB Clip 9dB Clip 7dB 0 128 256 384 512 5 10 15 20 25 Subcarrier Number S u b ca rr ie r S N R ( d B ) FDC, Clip 11dB FDC, Clip 9dB FDC, Clip 7dB Clip 11dB Clip 9dB Clip 7dB Off-line Processing Arbitrary Waveform Generator (AWG 7052, Tektronix) 10 bits resolution Compensated DMT signal (Tx) Bias Digital Oscilloscope (TDS 6124C, Tektronix) 8 bits resolution Received DMT signal (Rx) 650 nm RC-LED
SI-PD with TIA
50
m SI
-PO
F
s
Fig. 4. Experimental setups
(a) (b)
Fig. 5. Normalized FDC coefficients (Fig. 5a) and signal spectrums at the output of the LED with/without FDC (Fig. 5b)
0 62.5 125 187.5 250 0 0.5 1 1.5 2 2.5 Frequency (MHz) N o rm a liz e d C o m p e n s a ti o n C o e ff ic e n t 0 62.5 125 187.5 250 -35 -30 -25 -20 -15 -10 -5 Frequency (MHz) E le c tr ic a l R e s p o n s e ( d B )
LED Response with FDC LED Response without FDC
Without FDC
power penalties. For example when 14 dB clipping ratio is employed, most of the DMT signals works in a relatively linear region due to the high PAPR. In this case, the FDC DMT systems reach lower transmission rate than DMT systems. However, the FDC DMT systems can achieve significant improvement when systems are clipped at 9 dB, which is 2-3 dB lower than the optimal clipping ratio in classical DMT system. With lower clipping ratio, even though the clipping and non-linearity distortion are introduced, the received signal SNR can also be inherently improved. Therefore the maximal transmission rate for the FDC DMT system can be reached around 1.5 Gbps (ESKATM Mega) and 1.2 Gbps (ESKATM Premier), compared to the bit rates around 1.3 Gbps (ESKATM Mega) and 1.1 Gbps (ESKATM Premier) reached with the classical DMT systems.
A detailed comparison when both systems worked at the optimal clipping value was investigated. For the FDC DMT systems, 9 dB clipping ratio was selected. For the classical DMT systems, 12 and 11 dB clipping ratios were selected. The allocated bits and powers for each subcarrier are shown in Fig. 8. As the signal spectrum at the output of the LED with FDC is flat in Fig. 5(b), almost all subcarriers are modulated with QAM-64 in ESKATM Mega system, which is shown in Fig. 8(a). In addition, as shown in the figures, the highest modulation orders are also reduced in both FDC DMT systems, which can increase the system robustness to distortions.
efficiencies and obtained bit error rates in different systems and POFs is given in Table I. As shown in the table, FDC DMT systems can achieve 9 % and 7 % bit rate improvement for similar bit error rate. The modulation efficiencies in FDC DMT systems are respectively improved by 0.5 bits/s/Hz and 0.3 bits/s/Hz compared to classical DMT systems.
V. CONCLUSION
In this letter, a linear frequency-domain LED compensation technique for nonlinearity mitigation is proposed for optical fiber systems with DMT modulation. The LED compensation factors can be measured from the frequency response of the back-to-back connection. The FDC can be digitally performed before the IFFT in DMT modulations. With the help of FDC, DMT systems can mitigate the LED nonlinearity with lower clipping ratio. Compared to the classical DMT systems in a 50 m SI-POF link with RC-LED, the FDC DMT scheme benefits 2-3 dB optimal clipping ratio and obtain 7-9 % higher transmission bit rate for the same BER level. Experimental results show that the proposed FDC DMT systems perform well in two types of SI-POFs with different frequency responses. It is worth noting that the proposed FDC DMT scheme can also be used for other optical OFDM systems in order to achieve higher modulation efficiencies with the same experimental components and setups.
REFERENCES
[1] C.M. Okonkwo, E. Tangdiongga, H. Yang, D. Visani, S. Loquai, R. Kruglov, B. Charbonnier, M. Ouzzif, I. Greiss, O. Ziemann, R. Gaudino, and A.M.J Koonen, “Recent Results from the EU POF-PLUS Project: Multi-Gigabit Transmission over 1 mm Core Diameter Plastic Optical Fibers”, IEEE J. Lightw. Technol., vol. 29, no. 2, pp. 186–193, 2011. [2] O. Ziemann, J. Krauser, P.E. Zamzow, and W. Daum, “POF Handbook:
Optical Short Range Transmission Systems”, 2nd Edition, Springer, 2008 [3] C.J. Lee, F. Breyer, S. Randel, R. Gaudino, G. Bosco, A. Bluschke, M. Matthews, P. Rietzsch, R. Steglich, H.P.A. van den Boom, and A.M.J. Koonen, “Discrete Multitone Modulation for Maximizing Transmission Rate in Step-Index Plastic Optical Fibers”, IEEE J. Lightw. Technol., vol. 27, no. 11, pp. 1503-1513, Jun. 1, 2009.
[4] S.C.J. Lee, F. Breyer, S. Randel, O. Ziemann, H.P.A. van den Boom, and A.M.J. Koonen, “Low-Cost and Robust 1-Gbit/s Plastic Optical Fiber Link Based on Light-Emitting Diode Technology”, OFC/NFOEC, 2008. [5] B. Cardiff, M.F. Flanagan, F. Smyth, L.P. Barry and A.D. Fagan, “On Bit and Power Loading for OFDM Over SI-POF”, IEEE J. Lightw. Technol., vol. 29, no. 10, pp. 1547-1554, May 15 2011.
[6] I. Neokosmidis, T. Kamalakis, J.W. Walewski, B. Inan, and T. Sphicopoulos, “Impact of Nonlinear LED Transfer Function on Discrete Multitone Modulation: Analytical Approach”, IEEE J. Lightw. Technol., vol. 27, no. 22, pp. 4970-4978, Nov. 15, 2009
[7] H. Elgala and R. Mesleh, “Non-linearity effects and predistortion in optical OFDM wireless transmission using LEDs”, Int. J. Ultra Wideband Communications and Systems, vol. 1, vo. 2, pp. 143-150, 2009. [8] R. Mesleh, H. Elgala, and H. Haas, “LED Nonlinearity Mitigation
Techniques in Optical Wireless OFDM Communication Systems”, J. Opt. Commun. Netw., vol. 4, no. 11, pp. 865-875, Nov. 2012.
[9] T. P. Lee, “The nonlinearity of double-heterostructure LED’s for optical communications,” Proc. IEEE, vol. 65, no. 9, pp. 1408–1410, 1977. [10] L. Peng, S. Haese, M. Hélard, “Optimum Configuration for Discrete
Multi-tone Transmission over Polymer Optical Fiber”, ICT 2012. [11] K.J. Muhonen, M. Kavehrad, and R. Krishnamoorthy, “Look-Up Table
Techniques for Adaptive Digital Predistortion: A Development and Comparison”, IEEE T. on Vehicular Technol., vol. 49, no.5, pp.1995-2002, Sep. 2000.
[12] J. Proakis and M. Salehi, “Digital Communications”, 5th Edition,
McGraw-Hill Science/Engineering/Math, 2007. (a) (b)
(c) (d)
Fig. 8. Allocated bits and power: SI-POF ESKATM Mega with (a) without (b)
FDC, SI-POF ESKATM Premier with (c) without (d) FDC
128 256 384 512 0 2 4 6 8 A llo c a te d B it ( B it s ) Subcarrier Number 128 256 384 512-1 0 A llo c a te d P o w e r (d B ) Allocated Power 128 256 384 512 0 2 4 6 8 A llo c a te d B it ( B it s ) Subcarrier Number 128 256 384 512-2 -1 0 1 A llo c a te d P o w e r (d B ) Allocated Power 128 256 384 512 0 2 4 6 8 10 A llo c a te d B it ( B it s ) Subcarrier Number 128 256 384 512-1 0 1 A llo c a te d P o w e r (d B ) Allocated Bit Allocated Power 128 256 384 512 0 2 4 6 8 10 A llo c a te d B it ( B it s ) Subcarrier Number 128 256 384 512-2 -1 0 1 2 A llo c a te d P o w e r (d B ) Allocated Bit Allocated Power TABLEI
COMPARISON OF FDCDMT AND ORIGINAL DMT SI-POF Eska™ MEGA
Maximal Bit Rate Modulation Efficiency Bit Error Rate Clipping Ratio FDC DMT 1.449 Gbps 5.8 bits/s/Hz 9 dB DMT 1.320 Gbps 5.3 bits/s/Hz 12 dB
SI-POF Eska™ Premier Maximal Bit Rate Modulation Efficiency Bit Error Rate Clipping Ratio FDC DMT 1.173 Gbps 4.7 bits/s/Hz 9 dB DMT 1.096 Gbps 4.4 bits/s/Hz 11 dB