HAL Id: hal-03195706
https://hal.archives-ouvertes.fr/hal-03195706
Submitted on 12 Apr 2021
HAL is a multi-disciplinary open access
archive for the deposit and dissemination of sci-entific research documents, whether they are pub-lished or not. The documents may come from teaching and research institutions in France or abroad, or from public or private research centers.
L’archive ouverte pluridisciplinaire HAL, est destinée au dépôt et à la diffusion de documents scientifiques de niveau recherche, publiés ou non, émanant des établissements d’enseignement et de recherche français ou étrangers, des laboratoires publics ou privés.
Electrochemical Detection of Single Phospholipid Vesicle
Collisions at a Pt Ultramicroelectrode
Estelle Lebègue, Cari Anderson, Jeffrey Dick, Lauren Webb, Allen Bard
To cite this version:
Estelle Lebègue, Cari Anderson, Jeffrey Dick, Lauren Webb, Allen Bard. Electrochemical Detection of Single Phospholipid Vesicle Collisions at a Pt Ultramicroelectrode. Langmuir, American Chemical Society, 2015, 31 (42), pp.11734-11739. �10.1021/acs.langmuir.5b03123�. �hal-03195706�
1
Electrochemical Detection of Single Phospholipid Vesicle Collisions at a Pt
Ultramicroelectrode
Estelle Lebègue,a Cari M. Anderson,b Jeffrey E. Dick,a Lauren J. Webb,b and Allen J. Bard*,a
a Center for Electrochemistry, Department of Chemistry, The University of Texas at Austin,
Austin, Texas, 78712
b Department of Chemistry, The University of Texas at Austin, Austin, Texas, 78712
Abstract
We report the collision behavior of single unilamellar vesicles, composed of a bilayer lipid membrane (BLM), on a platinum (Pt) ultramicroelectrode (UME) by two electrochemical detection methods. In the first method, the blocking of a solution redox reaction, induced by the single vesicle adsorption on the Pt UME, can be observed in the amperometric i-t response as current steps during the electrochemical oxidation of ferrocyanide. In the second technique, the ferrocyanide redox probe is directly encapsulated inside vesicles and can be oxidized during the vesicle collision on the UME if the potential is poised positive enough for ferrocyanide oxidation to occur. In the amperometric i-t response for the latter experiment, a current spike is observed. Here, we report the vesicle blocking (VB) method as a relevant technique for determining the vesicle solution concentration from the collisional frequency and also for observing the vesicle adhesion on the Pt surface. In addition, vesicle reactor (VR) experiments show clear evidence that the lipid bilayer membrane does not collapse or break open at the Pt UME during the vesicle collision. Because the bilayer is too thick for electron tunneling to occur readily, an appropriate concentration of a surfactant, such as Triton X-100 (TX100), was added in the VR solution to induce loosening of the bilayer (transfection conditions), allowing the electrode to oxidize the contents of the vesicle. With this technique, the TX100 effect on
2
the vesicle lipid bilayer permeability can be evaluated through the current spike charge and frequency corresponding to redox vesicle collisions.
3 Introduction
Electrochemical detection of discrete soft nanoparticle collisions on ultramicroelectrodes (UMEs) has been recently reported as a method to determine the size distribution and the concentration of emulsion droplets,1-5 vesicles,6,7 viruses,8 micelles9 and biological macromolecules.10 The observation of these stochastic events can potentially provide
information on various single nanoparticles contrary to ensemble measurements.11 Especially, electrochemical detection by collisions has been extended to studying vesicles by oxidizing the contents released upon collision at a carbon UME.6,7 There is, however, lack of agreement about the membrane opening mechanism followed by the content electrolysis on the carbon UME. Compton and co-workers proposed a “full collapse fusion” mechanism of the liposome membrane during the collision, based on the complete release and oxidation of ascorbic acid in a commercial vitamin C preparation, on a carbon UME.6 In contrast, Ewing and co-workers proposed a mechanism where the vesicle first adsorbs to the electrode surface, spreads out over the electrode, and finally the oxidation of the catecholamine content occurs.7 Moreover, this process is supported by previous investigations from Kasemo and co-workers about vesicles adsorption on various substrates (silicon dioxide, thiolated gold, oxidized gold) where the authors reported a rupture of vesicles adsorbed on hydrophobic surfaces (thiolated gold) and by opposition, an adsorption of intact vesicles on more hydrophilic surface (oxidized gold).12,13 In the same trend, Scholz and co-workers studied the behavior of different liposomes on the electrode surface (mainly a mercury electrode) and showed that chronoamperometric measurements are an interesting tool to probe the membrane stability and to understand the effect of its properties on vesicle fusion.14-17 Especially, the authors were the first to study the
adhesion and bursting processes of 450 nm diameter liposomes, and the spreading of the lecithin on the mercury surface (0.48 mm2) by using chroamperometric measurements for determining the frequency of spikes and the charge densities of formed monolayers.14-16
4
To improve our understanding of vesicle interactions with an electrode surface, we herein present different vesicle behavior on a Pt UME, which serves as a hydrophilic surface for vesicle collisions. By analogy with emulsion results,1-4 we report two techniques of vesicle detection: (1) vesicle blocking (VB), which consists of observing a blocking of solution redox species due to the single vesicle adsorption on the UME, and (2) vesicle reactor (VR), where the redox probe is encapsulated inside the vesicle and can be electrolyzed at the UME after its collision (Figure 1). In both cases, the redox probe chosen was potassium ferrocyanide [K4Fe(CN)6]18 because of its high solubility in water (0.5 M). Moreover, 0.5 M K4Fe(CN)6 can
be easily encapsulated inside vesicles as a hydrophilic content and removed from the solution outside vesicles. Also, it is a relevant redox species for the continuous phase largely used for detection of various soft nanoparticle collisions by the blocking method.1,8,10
Here we demonstrate that the BLM does not break and release the contents during vesicle collision at the Pt UME hydrophilic surface. As shown in previous studies of BLMs,19,20 they do not allow effective electron tunneling or ion transport to cause redox reactions across them without the presence of a strong surfactant. However cell transfection experiments show that the presence of a surfactant, e.g., Triton X-100 (TX100), can promote transfer across the membrane.18,21 Moreover, we clearly show that vesicles are adsorbed on the Pt surface (VB) after their collision, but the electron transfer cannot happen through the bilayer for electrolyzing the Fe(CN)64- content (VR). Hence, we discuss here the TX100 concentration effect in solution
and also the corresponding kinetic study on the vesicle membrane permeability by detection of electrochemical collision events. Our results were in good agreement with several studies reporting the role of TX100 surfactant on the cell membrane, which could yield fundamental insight into the transfection process.21-25 To the best of our knowledge, this is the first work dealing with the vesicle collision behavior onto a hydrophilic surface.
5
Figure 1. Schematic representation of the two reported vesicle collision techniques at a Pt UME
where the potential applied is at +0.6 V vs. Ag/AgCl, and the oxidation currents are plotted in the negative direction (a) Electrochemical oxidation of Fe(CN)64- in aqueous solution (negative
current) is partially blocked by single vesicle blocking (VB) which produces an anodic current step . (b) Electrochemical oxidation of Fe(CN)64- encapsulated inside the vesicle reactor (VR)
gives an anodic current spike.
(a) (b) K4Fe(CN)6 Pt UME Current / A Time / s Pt UME K4Fe(CN)6 Current / A Time / s VB VR
6 Experimental Section
Reagents. All chemicals were reagent grade and used as purchased without further
purification. Water used in each experiment was Milli-Q water. Chloroform (≥99.8%), sulfuric acid (97%) and hydrogen peroxide (30%) were obtained from Fisher Scientific. Ferrocenemethanol (97%), potassium ferrocyanide, potassium phosphate monobasic (≥99.0%), potassium phosphate dibasic (≥98%) and Triton X-100 were purchased from Sigma Aldrich. Pt
(99.9%) wire was obtained from Goodfellow (Devon, PA). 1,2-dimyristoyl-sn-glycero-3-phosphocholine (DMPC) lipids were purchased in powder from Avanti Polar Lipids and stored in a freezer.
Vesicle preparation. Unilamellar vesicles solutions were prepared by dissolution of 10
mM DMPC lipid (powder) in chloroform (1 mL), then vortexed for 5 minutes and placed into a warm water bath (40 °C) for at least 10 minutes until the complete dissolution of lipids. The homogeneous mixture was placed under ambient atmosphere overnight and then, under vacuum for 1 hour for the complete evaporation of chloroform. The dry lipid film was hydrated by addition of aqueous solution (2 mL of pure water or 2 mL of 0.5 M K4Fe(CN)6 aqueous
solution) and then, the solution was mixed for 5 minutes and heated on a hot plate at 40 °C for 30 minutes. The DMPC vesicles solutions were extruded using 400 nm, 200 nm and finally 100 nm diameter polycarbonate membranes. The vesicles solution was passed through the extruder, which was kept warm at 40 °C, and then were passed through the extruder 10 times (for each polycarbonate membrane size) to obtain monodisperse nanometer-sized DMPC unilamellar vesicles solutions. The final step was to pass DMPC vesicles solution through a column (PD-10 Desalting Columns, GE Healthcare) by using pure water for removing K4Fe(CN)6 outside
7
Materials and Instrumentation. The vesicles extrusion phase was carried out with the
extruder set from Avanti Polar Lipids including a mini-extruder, 2 syringes of 1 mL, polycarbonates membranes of 0.4 μm, 0.2 μm and 0.1 μm, and filter supports. The
electrochemical experiments were performed using a CHI model 920C and CHI630 potentiostat (CH Instruments, Austin, TX) with a three-electrode cell placed in a faraday cage. Platinum wire was used as a counter electrode and the reference electrode was Ag/AgCl. For all chronamperometric i-t curves recorded, the sample interval (in sampling time) was 50 ms. Dynamic light scattering (DLS) data was obtained by Zetasizer Nano ZS (Malvern, Westborough, MA) and nanoparticle tracking analysis (NTA) data was achieved by Nanosight. However this last one (NTA) was discontinued when we found fouling of the cell window. The size distribution of vesicles was analyzed by DLS in Figure S1 and NTA in Figure S2, both in agreement with 120 ± 30 nm diameter DMPC vesicles aqueous solutions.
Platinum ultramicroelectrodes were prepared by laser pulling (Sutter Instruments) according to the general procedure performed in our lab,26,27 followed by mechanical polishing
with Bevellers for a diameter between 1 and 2 μm. Before each experiment, the Pt UMEs were washed by dipping in piranha solution (mixture composed to 3:1 concentrated sulfuric acid to 30% hydrogen peroxide solution) for ten seconds, and then dipping in water, and finally dipping successively in acetone, ethanol and several times in water. The radius of the Pt UME was obtained using the steady-state current in cyclic voltammetry recorded in 1 mM ferrocenemethanol aqueous solution.
8 Results and Discussion
Figure 2. (A) The i-t curve for collision experiments by vesicles blocking method recorded at
+0.6 V vs. Ag/AgCl on 1.7 µm Pt UME in 2 mL of 0.2 M K4Fe(CN)6 aqueous solution in the
absence (blank) and in the presence (vesicles) of 5 µL DMPC vesicles aqueous solution. (B) and (C) are enlarged portions of the initial figure (A).
VB method. The electrochemical detection of collisions by the VB method is presented
in Figure 2. The potential applied at 0.6 V corresponding to the steady-state current of the Fe(CN)64- oxidation into Fe(CN)63- at a 1.7 µm Pt UME was previously determined by cyclic
165 170 175 180 185 -9.30 -9.25 -9.20 -9.15 Current / nA Time / s vesicles 50 60 70 80 90 100 110 120 -9.6 -9.5 -9.4 -9.3 -9.2 -9.1 -9.0 -8.9 blank Current / nA Time / s vesicles 0 50 100 150 200 250 300 -10.5 -10.0 -9.5 -9.0 -8.5
Current
/ nA
Time / s
blank vesiclesB
C
A
9
voltammetry (Figure S3). During the chronoamperometry measurement at 0.6 V in 0.2 M K4Fe(CN)6 in the absence of DMPC vesicles, a steady-state current was reached at the Pt UME
and no current step was observed over 300 seconds. In contrast, after addition of DMPC vesicles encapsulating only pure water (no electroactive species), several current steps were observed due to single vesicle collisions onto the Pt UME surface, which locally block the flux of Fe(CN)64- to the electrode surface.
The experimentally observed frequency of current steps at the Pt UME with the VB method was 0.12 Hz. The vesicles concentration (Cves) can be calculated from this collision
frequency of vesicles onto the UME surface by eq 1, based on a diffusion-limited flux of nanoparticles to the electrode surface.28 The concentration of the pure DMPC vesicles aqueous solution before dilution is evaluated as 5.5 ± 0.2 nM, a value in good agreement with the concentration determined by NTA (Figure S2) at 3.1 ± 0.2 nM, suggesting that diffusion is the dominant process compared with migration effects.29 A small contribution of mass transfer of the vesicles to the electrode surface by electrophoretic migration cannot be ruled out; however, because the concentration of potassium ferrocyanide is 0.2 M, it likely carries most of the current, making diffusion the predominate form of mass transfer.8
Cves =
𝑓ves
4𝐷ves𝑟e𝑁A (1)
where fves is the collision frequency by diffusion of the vesicles to the UME, Dves is the
diffusion coefficient of a spherical vesicle, re is the radius of the working electrode, and NA is
Avogadro’s number. The diffusion coefficient (Dves) can be estimated by the Stokes-Einstein
relation (eq 2)30
Dves =
𝑘B𝑇
10
where kB is Boltzmann’s constant, T is temperature, η is the viscosity of the continuous
phase at 25 °C, and rves is the hydrodynamic radius of a vesicle. From this equation, the diffusion
coefficient of a 113 nm diameter vesicle (determined by DLS measurement in Figure S1) is 4.3 × 10⁻⁸ cm2 s-1, matching well with the value estimated from NTA data (Figure S2) at 4.1 × 10⁻⁸
cm2 s-1.
The current steps shown in Figure 2 are related to the single vesicle collisions at the Pt UME surface. In most cases, we observed a current decrease in the shape of a stair step, indicating that most of the vesicles stick on the Pt surface after collision and only in rare cases, they quickly leave the UME after collision, showing a current increase in the shape of a stair step. Because of these observations, we assume that the probability of the adsorbate sticking to the electrode is nearly 1. Therefore, the VB electrochemical method is a relevant technique to detect nanometer-sized vesicles at a Pt UME and can give some interesting information such as the vesicles solution concentration and also information on the vesicle’s adhesion on the Pt surface. The sharpness of the steps (rise time 0.25 s) suggests that any vesicle distortion or spreading either occurs very quickly, or more likely, that the vesicle maintains its essentially spherical shape.
11
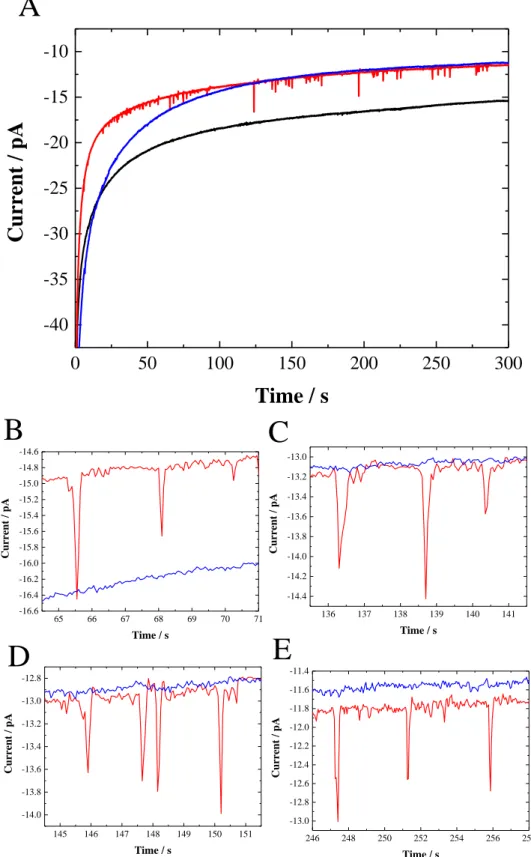
Figure 3. The i-t curve for collision experiments by vesicles reactor method recorded at +0.6
V vs. Ag/AgCl on 1.7 µm Pt UME in 2 mL of 0.1 M KPB aqueous solution at pH 7 in the absence (black) and in the presence of 20 µL redox DMPC vesicles aqueous solution with (red)
246 248 250 252 254 256 258 -13.0 -12.8 -12.6 -12.4 -12.2 -12.0 -11.8 -11.6 -11.4 Current / pA Time / s 145 146 147 148 149 150 151 -14.0 -13.8 -13.6 -13.4 -13.2 -13.0 -12.8 Current / pA Time / s 0 50 100 150 200 250 300 -40 -35 -30 -25 -20 -15 -10
Current
/ pA
Time / s
65 66 67 68 69 70 71 -16.6 -16.4 -16.2 -16.0 -15.8 -15.6 -15.4 -15.2 -15.0 -14.8 -14.6 Current / pA Time / s 136 137 138 139 140 141 -14.4 -14.2 -14.0 -13.8 -13.6 -13.4 -13.2 -13.0 Current / pA Time / sA
B
C
D
E
12
and without (blue) addition of 0.2 mM Triton X-100 surfactant. (B-E) are enlarged portions of the initial figure (A).
VR method. The electrochemical detection of collisions by vesicles reactor method is
presented in Figure 3. The main observation in Figure 3 was the absence of current spikes in the chronoamperometric i-t curve recorded in the presence of DMPC vesicles without surfactant. Indeed, this curve showed a similar shape to the one recorded in aqueous phosphate buffer solution (in the absence of vesicles solution) with the same trend to reach the steady-state current. This result shows no oxidation of the vesicles content occurred during each collision, suggesting no lipid bilayer collapse against the Pt UME. According to the VB method applied to redox DMPC vesicles (Figure S4), we can affirm that vesicles irreversibly adsorb onto the Pt UME, but the VR technique presented in Figure 3 clearly demonstrated that electron transfer does not occur through the BLM because electron tunneling and ion transfer is not facile through such a thick barrier.19,20,31 Thus, in agreement with previous studies about the vesicle adsorption on various substrates,12,13 DMPC vesicles seem to remain intact during their collision on the Pt UME hydrophilic surface.
In this case, to increase the membrane permeability, the use of a surfactant was required. The i-t curve recorded immediately after addition of an appropriate concentration of TX100 (vide infra, Figure 4) showed several current spikes over 300 seconds (Figure 3) with a frequency estimated at 0.28 Hz. Note the narrow shape of these current spikes detected at Pt UME, that are clearly different to those observed in previous studies.6,7 Indeed, contrary to the expected “blip” shape (Figure 1), here the current spikes present a symmetrical and sharp shape
for a time ranging between 0.2 to 0.5 seconds. This result indicates that mechanism occurring during single vesicle collisions at Pt UME in the presence of an appropriate concentration of TX100 is probably different to those reported by Compton and Ewing at a carbon UME.6,7
13
against the Pt UME, in a rapid electrolysis process. Thus, the electrolysis mechanism of the DMPC vesicles content during the collision at the Pt ultramicroelectrode surface in the presence of surfactant seems more complicated than a simple releasing process and probably requires additional studies to improve the understanding.
As previously shown in the VB technique, the vesicles concentration (Clip) can be
calculated by using eq 1 and eq 2 based on 120 nm diameter vesicles (determined by DLS measurement in Figure S1 and NTA data in Figure S2). Hence, the concentration of the pure redox DMPC vesicles aqueous solution before dilution is evaluated at 4.4 ± 0.1 nM, a value close to that determined by NTA (Figure S2) at 3.3 ± 0.2 nM and also in good agreement with the vesicles concentration determined by the VB method (Figure 2). This result indicates again that migration effects are less significant than diffusion, which is expected because very little faradaic current is flowing during VR experiments.29
Moreover, to confirm that current spikes are due to oxidation of Fe(CN)64- contained
inside the vesicle during its collision, we can estimate the diameter of each vesicle from the charge obtained by calculating the charge passed during the collision, which corresponds to the amount of ferrocyanide oxidized and using Faraday’s Law. Here, we assume that the initial
concentration of ferrocyanide introduced into the vesicle solutions before extrusion is the same in each vesicle (i.e., an attoliter aliquot of the original solution), and we also assume that the electrode consumes all of the contents of the vesicle. In addition, we considered the cutoff for a “signal” (current spike) when the spike was at least three times the background noise in
current. A background experiment without redox species inside DMPC vesicles (Figure S5) showed no current spike.
Thus, the vesicle diameter (dves) can be calculated by eq 3:
dves = 2
√
3𝑄
4𝜋𝑛e𝐹𝐶redox
3
14
where Q is the measured charge, ne is the number of electrons transferred during the
electrolysis, ne = 1, F is Faraday’s constant, and Credox is the concentration of redox species
encapsulated in vesicle, Credox = 0.5 M.
The overlay presented in Figure 4a showed that the size distributions from DLS data and calculated data were quite similar. Indeed, the DLS data indicated that the peak diameter is 120 ± 30 nm (Figure S1) while the calculated data gave 116 ± 63 nm as mean diameter from the corresponding average charge estimated at 0.079 pC. According to this result, the previous assumptions about the complete electrolysis and the expected concentration of ferrocyanide encapsulated inside vesicles (0.5 M) can be validated and in addition, that showed the TX100 surfactant does not act on the size distribution of vesicles (nor on the consumed charge) during their collision.
As expected, the VR technique confirmed its efficiency to determine the size distribution of nanometer-sized vesicles and was also relevant to approximate the vesicles concentration in solution. Nevertheless, this last technique provided clear evidence observation of current spikes form these vesicles on a Pt UME necessitated a surfactant, such as TX100, in a controlled concentration. Indeed, TX100 is one of the most widely used nonionic surfactants to permeate the living cell membrane for transfection.21,24 In fact, the transfection process consists to the opening of pores or holes in the BLM to allow the hydrophilic species adsorption/desorption of the vesicle content without damaging the membrane.24 The study of TX100 surfactant concentration effect on the redox DMPC vesicle collisions frequency by detection of corresponding current spikes on Pt UME is presented in Figure 4b, to determine the appropriate TX100 concentration to use.
Figure 4b shows the evolution of the collisions frequency versus the TX100 concentration added every 5 minutes in the redox DMPC vesicles aqueous solution by recording
15
a chronoamperometric i-t curve (VR method) after each new addition. Especially, a chronoamperometric i-t curve like the one presented in Figure 3 is recorded on 300 seconds every 5 minutes (after each new addition of TX-100) on a fresh and clean Pt UME and the collisions frequency (number of collisions during 300 seconds) is reported in Figure 4b for each TX-100 concentration added. The collisions frequency began at 0 Hz for TX100 concentrations below 0.14 mM and increased until the appropriate TX100 concentration at 0.18 mM provided a maximum frequency value of 0.065 Hz. These concentrations values are in good agreement with the previous work of Koley and Bard reporting the TX100 concentration effects on membrane permeability of a single HeLa cell, where the TX100 critical micelle concentration (CMC) was evaluated at 0.17 mM.21 According to their study, if the TX100 concentration is above this CMC (>0.18 mM) the cell membrane is irreversibly damaged. Indeed, above 0.18 mM in Figure 4b, the collisions frequency quickly decreased and after 0.25 mM TX100 almost no current spike was detected, suggesting the fatal breaking of the vesicles lipid bilayer. Unfortunately, the concentration of ferrocyanide released in solution following the prospective collapsing of all vesicles is too low (~ 7 μM) for inducing a significant difference on the background steady state current in 0.1 M KPB aqueous solution. Several experiments have been performed concerning the TX100 concentration effect on single vesicle collisions and in all cases the collisions frequency curves versus the TX100 concentration (Figure S6) have presented the same trend observed in Figure 4b with a rapid increase at the appropriate TX100 concentration value around 0.20 ± 0.03 mM. Moreover, all chronoamperometric i-t curves recorded in these conditions showed the same shape and size of current spikes confirming that surfactant does not disturb the electrolyzed content (integrated charge). Here, the TX100 effect on the vesicles BLM permeability could be explained by a process that involves the more facile release of the ferrocyanide content only during vesicle collision.
16
Finally, our study showed for the first time that a concentration around 0.20 ± 0.03 mM of TX100 surfactant (dependent to the reaction time) in solution is essential and efficient to detect DMPC vesicles reactor collision events at the Pt UME hydrophilic surface.
40 60 80 100 120 140 160 180 200 220 240 0 2 4 6 8 10 12 14 16 18 20
Vesicles Diameter / nm
Collision Counts
0 2 4 6 8 10 12 14 16 18 20 22Relative
Intensity
/ Perc
ent
0.10 0.12 0.14 0.16 0.18 0.20 0.22 0.24 0.26 0.28 0.00 0.01 0.02 0.03 0.04 0.05 0.06 0.07Collisions frequency
/ Hz
TX100 concentration / mM
(a)
(b)
17
Figure 4. (a) Size distributions from DLS data (black line) and from charge data by integrating
current spikes of i-t curve recorded at +0.6 V vs. Ag/AgCl on 1.7 µm Pt UME in 2 mL of 0.1 M KPB aqueous solution at pH 7 in the presence of 20 µL DMPC vesicles aqueous solution and 0.2 mM TX100 surfactant (red bar). (b) The collisions frequency determined from i-t curves of collision experiments by vesicles reactor method recorded at +0.6 V vs. Ag/AgCl on 1.0 µm Pt UME in 2 mL of 0.1 M KPB aqueous solution at pH 7 in the presence of 10 µL redox DMPC vesicles aqueous solution after addition of small TX100 concentrations every 5 minutes. The unusual single unique maximum point was seen in 3 trials (Figure S6) where it varied over a range of 0.05 mM.
Conclusion
In summary, we have investigated vesicle behavior composed of a phospholipid bilayer membrane on a Pt ultramicroelectrode surface by two electrochemical detection methods involving discrete collision events. For the first time, we have shown that the vesicles blocking method is a useful technique for observing the vesicle adhesion on the Pt UME surface and also to evaluate the vesicle concentration in solution. Furthermore, our results have confirmed that the vesicle reactor method can be used to determine the vesicle size distribution, but the addition of a surfactant like Triton X-100 is necessary to oxidize the DMPC vesicle content. Indeed, in the absence of surfactant, the BLM does not allow passage of the contents to the UME for electrolysis during the vesicle collision on the Pt UME and is also too thick for allowing electron transfer across the BLM. Therefore, we have shown that the required Triton X-100 concentration is about 0.20 ± 0.03 mM depending on the DMPC vesicle concentration in solution and under these conditions the BLM is permeable to hydrophilic species such as potassium ferrocyanide. Finally, we have suggested a transfection mechanism from the surfactant to explain the current spikes occurring during vesicles reactor collisions at Pt
18
ultramicroelectrode but this assumption should be checked by extending this study to other surfactants commonly used for cell transfection and probably also to other encapsulated hydrophilic electroactive species.
Supporting Information
Additional figures are available in the supplementary information.
Corresponding Author
ajbard@cm.utexas.edu
Competing Financial Interest
The authors declare no competing financial interest.
Acknowledgments
EL acknowledges the Defense Threat Reduction Agency (Grant No. HDTRA1-11-1-0005) and also, Christophe Renault and Jiyeon Kim for helpful advices. JD acknowledges the National Science Foundation Graduate Research Fellowship (Grant No. DGE-1110007). AB acknowledges the National Science Foundation (Grant No. CHE-1405248) and the Welch Foundation (Grant No. F-0021). LW acknowledges the Welch Foundation (Grant No. F-1722).
References
(1) Kim, B.-K.; Boika, A.; Kim, J.; Dick, J. E.; Bard, A. J. Journal of the American Chemical Society 2014, 136, 4849. (2) Dick, J. E.; Renault, C.; Kim, B.-K.; Bard, A. J. Journal of the American Chemical Society 2014, 136, 13546. (3) Dick, J. E.; Renault, C.; Kim, B.-K.; Bard, A. J. Angewandte Chemie International Edition 2014, 53, 11859. (4) Kim, B.-K.; Kim, J.; Bard, A. J. Journal of the American Chemical Society 2015, 137, 2343.
(5) Cheng, W.; Compton, R. G. Angewandte Chemie International Edition 2015, 54, 7082. (6) Cheng, W.; Compton, R. G. Angewandte Chemie International Edition 2014, 53, 13928.
(7) Dunevall, J.; Fathali, H.; Najafinobar, N.; Lovric, J.; Wigström, J.; Cans, A.-S.; Ewing, A. G. Journal of the
American Chemical Society 2015, 137, 4344.
(8) Dick, J. E.; Hilterbrand, A. T.; Boika, A.; Upton, J. W.; Bard, A. J. Proceedings of the National Academy of
Sciences 2015, 112, 5303.
19
(10) Dick, J. E.; Renault, C.; Bard, A. J. Journal of the American Chemical Society 2015, 137, 8376.
(11) Allen, J. B.; Aliaksei, B.; SeongJung, K.; JunHui, P.; Scott, N. T. In Nanoelectrochemistry; CRC Press: 2015, p 241.
(12) Keller, C. A.; Kasemo, B. Biophysical Journal 1998, 75, 1397. (13) Dimitrievski, K.; Kasemo, B. Langmuir 2008, 24, 4077.
(14) Hellberg, D.; Scholz, F.; Schauer, F.; Weitschies, W. Electrochemistry Communications 2002, 4, 305.
(15) Hellberg, D.; Scholz, F.; Schubert, F.; Lovrić, M.; Omanović, D.; Hernández, V. A.; Thede, R. The Journal of
Physical Chemistry B 2005, 109, 14715.
(16) Agmo Hernández, V.; Scholz, F. Langmuir 2006, 22, 10723.
(17) Agmo Hernández, V.; Niessen, J.; Harnisch, F.; Block, S.; Greinacher, A.; Kroemer, H. K.; Helm, C. A.; Scholz, F. Bioelectrochemistry 2008, 74, 210.
(18) Kannuck, R. M.; Bellama, J. M.; Durst, R. A. Analytical Chemistry 1988, 60, 142. (19) Young, R. C.; Feldberg, S. W. Biophysical Journal 1979, 27, 237.
(20) Feldberg, S. W.; Armen, G. H.; Bell, J. A.; Chang, C. K.; Wang, C. B. Biophysical Journal 1981, 34, 149. (21) Koley, D.; Bard, A. J. Proceedings of the National Academy of Sciences 2010, 107, 16783.
(22) Fontaine, P.; Fauré, M. C.; Muller, F.; Poujade, M.; Micha, J.-S.; Rieutord, F.; Goldmann, M. Langmuir 2007,
23, 12959.
(23) le Maire, M.; Champeil, P.; Moller, J. V. Biochimica et biophysica acta 2000, 1508, 86.
(24) Gennuso, F.; Fernetti, C.; Tirolo, C.; Testa, N.; L'Episcopo, F.; Caniglia, S.; Morale, M. C.; Ostrow, J. D.; Pascolo, L.; Tiribelli, C.; Marchetti, B. Proceedings of the National Academy of Sciences of the United States of America
2004, 101, 2470.
(25) Lanyi, J. K. Biochemistry 1973, 12, 1433.
(26) Kim, J.; Izadyar, A.; Nioradze, N.; Amemiya, S. Journal of the American Chemical Society 2013, 135, 2321. (27) Kim, J.; Kim, B.-K.; Cho, S. K.; Bard, A. J. Journal of the American Chemical Society 2014, 136, 8173.
(28) Kwon, S. J.; Zhou, H.; Fan, F.-R. F.; Vorobyev, V.; Zhang, B.; Bard, A. J. Physical Chemistry Chemical Physics
2011, 13, 5394.
(29) Boika, A.; Thorgaard, S. N.; Bard, A. J. The Journal of Physical Chemistry B 2013, 117, 4371. (30) Einstein, A. Annalen der Physik 1905, 322, 549.
20 TOC: K4Fe(CN)6 Pt Ultramicr oelectr od e Current / A Time / s Pt Ultramicr oelectr od e K4Fe(CN)6 Current / A Time / s