IBD is composed of chronic, relapsing intestinal inflammatory dis-eases affecting more than 2.5 million people in Europe, with increasing prevalence in Asia and developing countries1,2. IBD is thought to arise from inappropriate activation of the intestinal mucosal immune system in response to commensal bacteria in a genetically susceptible host.
Thus far, 163 genetic loci have been associated with IBD via large-scale genome-wide association studies (GWAS) in cohorts of European descent. Smaller GWAS performed in populations from Japan, India and Korea have reported six new genome-wide significant associations
outside of the human leukocyte antigen (HLA) region. Three of these loci (13q12, FCGR2A and SLC26A3) subsequently achieved genome-wide significant evidence of association in European cohorts. The remaining three loci demonstrated a consistent direction of effect and nominally significant evidence of association (P < 1 × 10⁻⁴) in previous European GWAS analyses3–6. A number of loci initially asso-ciated with IBD in European cohorts have now also been shown to underlie risk in non-Europeans, including JAK2, IL23R and NKX2-3. The evidence of shared IBD risk loci across diverse populations
Association analyses identify 38 susceptibility loci for
inflammatory bowel disease and highlight shared genetic
risk across populations
Jimmy Z Liu
1,25, Suzanne van Sommeren
2,3,25, Hailiang Huang
4, Siew C Ng
5, Rudi Alberts
2, Atsushi Takahashi
6,
Stephan Ripke
4, James C Lee
7, Luke Jostins
8, Tejas Shah
1, Shifteh Abedian
9, Jae Hee Cheon
10, Judy Cho
11,
Naser E Daryani
12, Lude Franke
3, Yuta Fuyuno
13, Ailsa Hart
14, Ramesh C Juyal
15, Garima Juyal
16, Won Ho Kim
10,
Andrew P Morris
17, Hossein Poustchi
9, William G Newman
18, Vandana Midha
19, Timothy R Orchard
20,
Homayon Vahedi
9, Ajit Sood
19, Joseph J Y Sung
5, Reza Malekzadeh
9, Harm-Jan Westra
3, Keiko Yamazaki
13,
Suk-Kyun Yang
21, International Multiple Sclerosis Genetics Consortium
22, International IBD Genetics Consortium
22,
Jeffrey C Barrett
1, Andre Franke
23, Behrooz Z Alizadeh
24, Miles Parkes
7, Thelma B K
16, Mark J Daly
4,
Michiaki Kubo
13,26, Carl A Anderson
1,26& Rinse K Weersma
2,26Ulcerative colitis and Crohn’s disease are the two main forms of inflammatory bowel disease (IBD). Here we report the first trans-ancestry association study of IBD, with genome-wide or Immunochip genotype data from an extended cohort of 86,640 European individuals and Immunochip data from 9,846 individuals of East Asian, Indian or Iranian descent. We implicate 38 loci in IBD risk for the first time. For the majority of the IBD risk loci, the direction and magnitude of effect are consistent in European and non-European cohorts. Nevertheless, we observe genetic heterogeneity between divergent populations at several established risk loci driven by differences in allele frequency (NOD2) or effect size (TNFSF15 and ATG16L1) or a combination of these factors (IL23R and IRGM). Our results provide biological insights into the pathogenesis of IBD and demonstrate the usefulness of trans-ancestry association studies for mapping loci associated with complex diseases and understanding genetic architecture across diverse populations.
1Wellcome Trust Sanger Institute, Hinxton, UK. 2Department of Gastroenterology and Hepatology, University of Groningen, University Medical Center Groningen, Groningen, the Netherlands. 3Department of Genetics, University of Groningen, University Medical Center Groningen, Groningen, the Netherlands. 4Analytic and Translational Genetics Unit, Massachusetts General Hospital, Harvard Medical School, Boston, Massachusetts, USA. 5Department of Medicine and Therapeutics, Institute of Digestive Disease, LKS Institute of Health Science, State Key Laboratory of Digestive Disease, Chinese University of Hong Kong, Hong Kong. 6Laboratory for Statistical Analysis, Center for Integrative Medical Sciences, RIKEN, Yokohama, Japan. 7Inflammatory Bowel Disease Research Group, Addenbrooke’s Hospital, Cambridge, UK. 8Wellcome Trust Centre for Human Genetics, University of Oxford, Headington, UK. 9Digestive Disease Research Institute, Shariati Hospital, Tehran, Iran. 10Department of Gastroenterology and Hepatology, Yonsei University College of Medicine, Seoul, Korea. 11Icahn School of Medicine, Mount Sinai Hospital, New York, New York, USA. 12Department of Gastroenterology, Emam Hospital, Tehran, Iran. 13Laboratory for Genotyping Development, Center for Integrative Medical Sciences, RIKEN, Yokohama, Japan. 14Inflammatory Bowel Disease Unit, St Mark’s Hospital, Harrow, UK. 15National Institute of Immunology, New Delhi, India. 16Department of Genetics, University of Delhi South Campus, New Delhi, India. 17Department of Biostatistics, University of Liverpool, Liverpool. 18Manchester Centre for Genomic Medicine, University of Manchester and Central Manchester University Hospitals National Health Service (NHS) Foundation Trust, Manchester, UK. 19Department of Medicine, Dayanand Medical College and Hospital, Ludhiana, India. 20Department of Gastroenterology and Hepatology, St. Mary’s Hospital, London, UK. 21Department of Gastroenterology and Hepatology, Asan Medical Center, University of Ulsan College of Medicine, Seoul, Korea. 22A full list of members and affiliations appears in the Supplementary Note. 23Institute of Clinical Molecular Biology, Christian-Albrechts-University of Kiel, Kiel, Germany. 24Department of Epidemiology, University of Groningen, University Medical Center Groningen, Groningen, the Netherlands. 25These authors contributed equally to this work. 26These authors jointly supervised this work. Correspondence should be addressed to R.K.W. ([email protected]) or C.A.A. ([email protected]). Received 30 October 2014; accepted 24 June 2015; published online 20 July 2015; doi:10.1038/ng.3359
npg
© 201
5 Nature
America, Inc.
suggests that combining genotype data from cohorts of different ancestry will enable the detection of additional IBD-associated loci. Such trans-ancestry association studies have successfully identi-fied susceptibility loci for other complex diseases, including type 2 diabetes and rheumatoid arthritis7,8.
In this study, we aggregate genome-wide or Immunochip genotype data from 96,486 individuals. In comparison to our previously published GWAS meta-analysis, this study includes an additional 11,535 individuals of European ancestry and 9,846 individuals of non-European ancestry. Using these data, we aim to identify new IBD risk loci and compare the genetic architecture of IBD susceptibility across ancestrally divergent populations.
RESULTS Study design
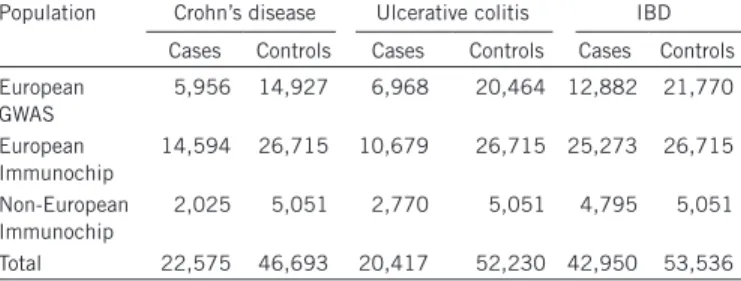
After quality control and 1000 Genomes Project imputation (Phase I– August 2012), we used 5,956 Crohn’s disease cases, 6,968 ulcerative colitis cases and 21,770 population controls of European descent to perform GWAS of Crohn’s disease, ulcerative colitis and IBD (Crohn’s disease and ulcerative colitis together) (Online Methods). Replication was undertaken using an additional 16,619 Crohn’s disease cases, 13,449 ulcerative colitis cases and 31,766 population controls genotyped on the Immunochip. The replication cohort included 2,025 Crohn’s disease cases, 2,770 ulcerative colitis cases and 5,051 population controls of non-European ancestry (Table 1 and Supplementary Figs. 1 and 2), so principal-component analysis was used to assign individuals to 1 of 4 ancestral groups (European, Iranian, Indian or East Asian) (Supplementary Fig. 3). Case-control association tests were performed within each ancestry group using a linear mixed model (MMM)9 (Online Methods). A fixed-effects meta-analysis was undertaken to combine the summary statistics from our European-only GWAS meta-analysis with those from the European replication cohort. We next performed a Bayesian trans-ancestry meta-analysis, as implemented in MANTRA, to enable heterogeneity in effect sizes to be correlated with the genetic distance between populations, as estimated by the mean fixation index (FST) across all SNPs10 (Online Methods). For the trans-ancestry meta-analysis, the 6,392 cases and 7,262 population controls of European ancestry that were present in both the GWAS and replication cohorts were excluded from the Immunochip replication study (Supplementary Fig. 2). To maximize power for our solely Immunochip-based comparisons across ances-tral groups, the mixed-model association analysis was repeated after reinstating these individuals in the Immunochip cohort.
Trans-ancestry meta-analysis identifies 38 new IBD loci In total, 38 new disease-associated loci were identified at genome-wide significance in either the association analysis of individual ancestry groups (P < 5 × 10⁻⁸) or the trans-ancestry meta-analysis that included all ancestries (log10(Bayes factor) > 6) for ulcerative colitis,
Crohn’s disease or IBD (Table 2, Supplementary Figs. 4–7 and Supplementary Tables 1 and 2). To reduce false positive associations, we required all loci only implicated in disease risk via the trans-ancestry meta-analysis (with log10(Bayes factor) > 6 but P > 5 × 10⁻⁸ in each individual ancestry cohort) to show no significant evi-dence of heterogeneity across all four ancestry groups (I2 > 85.7%) (Online Methods and Supplementary Table 3).
Twenty-five of the 38 newly associated loci overlapped with loci previously reported for other traits, including immune-mediated diseases, whereas 13 had not previously been associated with any disease or trait (Online Methods and Supplementary Table 4). A likelihood-modeling approach showed that 27 of the 38 newly identified loci were associated with both Crohn’s disease and ulcera-tive colitis (designated here as IBD-associated loci), with 7 of these loci demonstrating evidence of heterogeneity of effect between the 2 diseases. Of the remaining 11 loci, 7 were classified as specific to Crohn’s disease and 4 were classified as specific to ulcerative colitis (Table 2 and Supplementary Table 1).
As a result of our updated sample quality control procedure, 17 of the 194 independent SNPs reported at genome-wide significance in our previous European-only GWAS meta-analysis6 failed to reach this significance threshold in the present study. Sixteen of these loci still demonstrated strong suggestive evidence of association in the current European cohort (5 × 10⁻⁸ < P < 8.7 × 10⁻⁶, representing a false discov-ery rate (FDR) of ~0.001) (Supplementary Table 1). SNP rs2226628 on chromosome 11 failed to achieve even suggestive evidence of associa-tion in our current European associaassocia-tion analysis (P = 0.0024). Our pre-vious European-only meta-analysis incorporated a number of principal components as covariates in a logistic regression test of association, and, interestingly, if we adopted the approach taken by Jostins et al.6, we observed a more significant P value of 7.38 × 10⁻⁶ for this SNP. This observation, together with the divergent allele frequencies at this SNP across European populations (1000 Genomes Project release 14: GBR (British in England and Scotland), 0.20; CEU (Utah residents of Western European ancestry), 0.28; IBS (Spanish Iberian), 0.39; FIN (Finnish), 0.47) suggests that the previously reported signal of associa-tion might have been driven, at least in part, by populaassocia-tion stratificaassocia-tion (which is now better accounted for in the linear mixed-model analy-sis)6. In summary, we now consider 231 independent SNPs within 200 loci to be associated with IBD risk (Supplementary Table 2).
Forty-one of the 163 IBD-associated SNPs originally identified in our previous European-only GWAS meta-analysis replicated in at least one non-European cohort if we considered a one-tailed Bonferroni-corrected significance threshold of P < 6.1 × 10⁻⁴ (0.05/163) (Supplementary Table 1). Nine of the 14 non-HLA loci (10 for Crohn’s disease and 4 for ulcerative colitis) that had been identified at genome-wide levels of significance in previous non-European GWAS cohorts from Japan, India and Korea3,4,11–13 were associated with either Crohn’s disease or ulcerative colitis in the East Asian, Indian and/or Iranian cohorts with P < 1.0 × 10⁻⁵ (Supplementary Table 5). Four of the five remaining SNPs (or reliable proxy SNPs) were not present on the Immunochip. The previously reported association at rs2108225 (SLC26A3) on chromosome 7 showed an association sig-nal at P = 2.64 × 10⁻³ in the current East Asian cohort but was strongly associated with IBD in the European cohort (P = 1.04 × 10⁻¹⁸).
We next performed a series of analyses to prioritize genes within the newly associated loci for causality. Cis-eQTL (expression quantita-tive trait locus) analysis from two data sets of peripheral blood sam-ples from a total of 1,240 individuals showed that 12 of the 38 newly associated SNPs had cis-eQTL effects (FDR < 0.05) (Online Methods and Supplementary Table 6). Two SNPs showed trans-eQTL effects. table 1 cohort sample sizes for GWAS and immunochip
trans-ancestry meta-analysis
Population Crohn’s disease Ulcerative colitis IBD
Cases Controls Cases Controls Cases Controls European GWAS 5,956 14,927 6,968 20,464 12,882 21,770 European Immunochip 14,594 26,715 10,679 26,715 25,273 26,715 Non-European Immunochip 2,025 5,051 2,770 5,051 4,795 5,051 Total 22,575 46,693 20,417 52,230 42,950 53,536
npg
© 201 5 Nature America, Inc.SNP rs653178 in a locus harboring SH2B3 and ATXN2 is associated with multiple other immune-mediated diseases, including celiac dis-ease and rheumatoid arthritis. It had trans-eQTL effects on 14 genes, including genes within IBD-associated loci (TAGAP and STAT1). rs616597 had a cis-eQTL effect on NFKBIZ and had trans-eQTL effects on FLXB13 (Supplementary Table 6) (ref. 14). Both SNPs reside in known DNase I hypersensitivity and histone modification sites in multiple cell lines (Supplementary Table 7). In contrast to the high number of SNPs tagging eQTLs, only 3 of the 38 SNPs were in high linkage disequilibrium (LD; r2 > 0.8) with known missense coding variants (Supplementary Table 8).
To enable a meaningful comparison with our previously published results, we recreated the GRAIL connectivity network using all loci that now achieved genome-wide significant evidence of association (Supplementary Fig. 8). Twelve genes in the previous GRAIL network were removed in this new network. We found that these genes had significantly larger GRAIL P values (Wilcoxon P value = 6 × 10⁻⁴) and fewer interaction partners (11.2 versus 16.0) than genes remaining in the network. Sixty-two genes were connected into the GRAIL network for the first time, only 36 of which were located within the newly associated loci (including NFKBIZ, CD28 and OSMR). Thus, 26 genes from previously established IBD loci are brought into the network table 2 Newly associated iBD risk loci
Chr. SNP Position (bp)
Reference
allelea phenotypeBest b phenotypeLR c logfactor)10 (Bayes d Het. (I2)e European OR European P Candidate gene(s)
1 rs1748195 63,049,593 G CD CD 6.08 0 1.07 (1.04–1.10) 7.13 × 10⁻⁸ USP1
1 rs34856868 92,554,283 A IBD IBD_U 6.16 0 0.82 (0.77–0.88) 9.80 × 10⁻⁹ BTBD8
1 rs11583043 101,466,054 A UC IBD_U 8.34 66.5 1.08 (1.05–1.11) 6.05 × 10⁻⁸ SLC30A, EDG1
1 rs6025 169,519,049 A IBD IBD_U 6.43 0 0.84 (0.79–0.89) 2.51 × 10⁻⁸ SELP, SELE, SELL
1 rs10798069 186,875,459 A CD IBD_S 7.24 0 0.93 (0.91–0.95) 4.25 × 10⁻⁹ PTGS2, PLA2G4A
1 rs7555082 198,598,663 A CD IBD_U 7.97 0 1.13 (1.09–1.17) 1.47 × 10⁻¹⁰ PTPRC
2 rs11681525 145,492,382 C CD CD 8.8 59.3 0.86 (0.82–0.90) 4.08 × 10⁻¹¹ –
2 rs4664304 160,794,008 A IBD IBD_U 6.34 0 1.06 (1.04–1.08) 2.61 × 10⁻⁸ MARCH7, LY75, PLA2R1
2 rs3116494 204,592,021 G UC IBD_S 7.03 0 1.08 (1.05–1.11) 1.30 × 10⁻⁷ ICOS, CD28, CTLA4
2 rs111781203 228,660,112 G IBD IBD_U 10.04 0 0.94 (0.92–0.96) 2.16 × 10⁻¹⁰ CCL20 2 rs35320439 242,737,341 G CD IBD_S 7.71 0 1.09 (1.06–1.12) 9.89 × 10⁻¹⁰ PDCD1, ATG4B 3 rs113010081 46,457,412 G UC IBD_U 7.45 0 1.14 (1.09–1.19) 9.02 × 10⁻¹⁰ FLJ78302, LTF, CCR1, CCR2, CCR3, CCR5 3 rs616597 101,569,726 A UC UC 6.68 54.7 0.93 (0.90–0.96) 9.34 × 10⁻⁶ NFKBIZ 3 rs724016 141,105,570 G CD CD 7.41 70.9 1.06 (1.04–1.09) 3.36 × 10⁻⁶ –
4 rs2073505 3,444,503 A IBD IBD_U 6.87 0 1.10 (1.06–1.14) 1.46 × 10⁻⁷ HGFAC
4 rs4692386 26,132,361 A IBD IBD_U 6.47 0 0.94 (0.92–0.96) 1.21 × 10⁻⁸ –
4 rs6856616 38,325,036 G IBD IBD_U 9.78 61.6 1.10 (1.06–1.14) 9.72 × 10⁻⁷ –
4 rs2189234 106,075,498 A UC UC 8.85 0 1.08 (1.05–1.11) 1.95 × 10⁻¹⁰ –
5 rs395157 38,867,732 A IBD IBD_U 19.5 0 1.10 (1.08–1.12) 2.22 × 10⁻²⁰ OSMR, FYB, LIFR
5 rs4703855 71,693,899 A IBD IBD_U 6.83 70.3 0.93 (0.91–0.95) 7.16 × 10⁻¹¹ –
5 rs564349 172,324,978 G IBD IBD_U 8.12 37.5 1.06 (1.04–1.08) 1.54 × 10⁻⁷ C5orf4, DUSP1
6 rs7773324 382,559 G CD IBD_U 7.67 0 0.92 (0.90–0.94) 1.06 × 10⁻⁹ IRF4, DUSP22
6 rs13204048 3,420,406 G CD IBD_S 7.23 53.5 0.93 (0.91–0.95) 2.89 × 10⁻⁸ –
6 rs7758080 149,577,079 G CD IBD_S 7.88 0 1.08 (1.05–1.11) 7.27 × 10⁻⁹ MAP3K7IP2
7 rs1077773 17,442,679 G UC UC 5.86 76.7 0.93 (0.91–0.95) 5.96 × 10⁻⁹ AHR
7 rs2538470 148,220,448 A IBD IBD_U 10.93 54.6 1.07 (1.05–1.09) 3.00 × 10⁻¹¹ CNTNAP2
8 rs17057051 27,227,554 G IBD IBD_U 6.74 15.9 0.94 (0.92–0.96) 5.50 × 10⁻⁸ PTK2B, TRIM35, EPHX2
8 rs7011507 49,129,242 A UC IBD_U 7.49 39.3 0.90 (0.87–0.93) 6.40 × 10⁻⁸ –
10 rs3740415 104,232,716 G IBD IBD_U 6.26 0 0.95 (0.93–0.97) 1.03 × 10⁻⁷ NFKB2, TRIM8, TMEM180
12 rs7954567 6,491,125 A CD CD 8.25 0 1.09 (1.06–1.12) 1.30 × 10⁻⁹ CD27, TNFRSF1A, LTBR
12 rs653178 112,007,756 G IBD IBD_U 6.57 49.7 1.06 (1.04–1.08) 1.11 × 10⁻⁸ SH2B3, ALDH2, ATXN2
12 rs11064881 120,146,925 A IBD IBD_U 7.02 31.7 1.10 (1.06–1.14) 5.95 × 10⁻⁸ PRKAB1
13 rs9525625 43,018,030 A CD CD 8.55 37.3 1.08 (1.05–1.11) 1.41 × 10⁻⁹ AKAP1, TFSF11 17 rs3853824 54,880,993 A CD IBD_S 8.46 50.4 0.92 (0.90–0.94) 1.17 × 10⁻¹⁰ – 17 rs17736589 76,737,118 G UC UC 6.53 53.4 1.09 (1.06–1.12) 4.34 × 10⁻⁸ – 18 rs9319943 56,879,827 G CD CD 6.33 33.4 1.08 (1.05–1.11) 9.05 × 10⁻⁷ – 18 rs7236492 77,220,616 A CD IBD_S 6.6 0 0.91 (0.88–0.94) 9.09 × 10⁻⁹ NFATC1, TST 22 rs727563 41,867,377 G CD CD 7.1 76 1.10 (1.07–1.13) 1.88 × 10⁻¹⁰ TEF, NHP2L1, PMM1, L3MBTL2, CHADL Loci for IBD, ulcerative colitis or Crohn’s disease were identified through a trans-ancestry analysis of genome-wide and Immunochip genotype data from a cohort of 86,682 European individuals and 9,846 individuals of non-European descent. Loci achieving genome-wide significance (P < 5 × 10⁻⁸) in one of the individual cohorts of European, East Asian, Indian or Iranian descent or log10 (Bayes factor) > 6 in the combined trans-ancestry association analysis were considered to be significantly associated loci. Loci having log10 (Bayes factor) > 6 but P > 5 × 10⁻⁸ in each individual ancestral cohort were required to show no significant evidence of heterogeneity across all four ancestry groups (I2 > 85.7%). Association P values and odds ratios for the non-European cohorts are given in Supplementary table 1. Candidate genes were identified by at least one of the gene prioritization methods we performed (eQTL, GRAIL, DAPPLE and coding SNP annotation (cSNP); see the main text and Online Methods). Genes in bold were prioritized by >2 gene prioritization strategies. UC, ulcerative colitis; CD, Crohn’s disease; IBD, inflammatory bowel disease; chr., chromosome; OR, odds ratio.
aThe minor allele in the European cohort was chosen to be the reference allele. bPhenotype with the largest MANTRA Bayes factor. cThe preferred phenotype (ulcerative colitis, Crohn’s disease or IBD) from our likelihood-modeling approach classifying loci according to their relative strength of association. LR, likelihood ratio. IBD_S and IBD_U refer to the IBD saturated and IBD unsaturated models, respectively (see the main text and Online Methods). dMANTRA log
10 (Bayes factor). eHeterogeneity I2 percentage.
npg
© 201
5 Nature
America, Inc.
of the T cell response. Thus, beyond the involvement of type 17 helper T (TH17) cells (previously identified through associations with, for example, IL23R), our results now implicate all three components of T cell activation (TCR ligation, co-stimulation and interleukin (IL)-2 signaling). Notably, these processes are critical for the development of immunological memory and are common to both CD4+ and CD8+ T cells.
The functions of leading new positional candidate genes are discussed in Box 1.
Comparing non-European IBD with European IBD
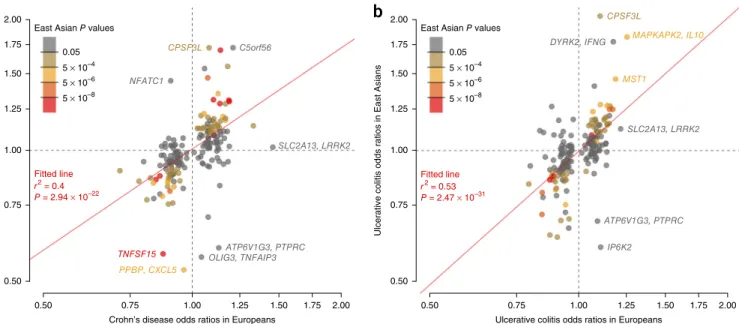
Recent large-scale trans-ancestry genetic studies of complex diseases have shown that the majority of risk-associated loci are shared across divergent populations8,17,18. The true extent of sharing is difficult to characterize because the sizes of non-European cohorts are often much smaller than their European counterparts, limiting power to detect associated loci. Despite our study including a large cohort of 9,846 non-European samples and being the largest non-European study of IBD thus far, this sample size is still small in comparison with the European cohort of 86,640 individuals. As such, we expect that the majority of known risk loci will not be associated in the non-European populations at genome-wide significance. Nevertheless, we observed a striking positive correlation in the direction of effect when comparing the 231 independently associated SNPs in the European and East Asian cohorts (P < 1.0 × 10⁻²² for Crohn’s disease and P < 1.0 × 10⁻³¹ for ulcerative colitis) (Fig. 1). Furthermore, of 3,900 suggestively associated SNPs (5 × 10⁻⁵ ≤ P < 5 × 10⁻⁸) from the European-only IBD association analysis, 2,566 had the same direction of effect in the East Asian analysis (P = 5.92 × 10−88). Consistent with for the first time, 12 of which are the only GRAIL gene reported for
the corresponding locus, including TAGAP and IKZF1. Genes within the 16 previously associated loci that failed to reach genome-wide significance in our current study had similar average connectivities as other genes in the network (17.8 versus 16.4, respectively; Wilcoxon P value = 0.94), thus further supporting their likely involvement in IBD risk. Thirty-seven of 56 DAPPLE candidate genes were identified as candidates in the GRAIL analysis (Supplementary Table 9). Biological implications of newly associated IBD loci
Previous GWAS analyses have highlighted components in several key pathways underlying IBD susceptibility, many involved in innate immu-nity, T cell signaling and epithelial barrier function. Accepting the need for fine mapping to pinpoint causal variants within the newly identified loci, the current study expands the range of pathways implicated.
The process of autophagy, which is an intracellular process during which cytoplasmic content is engulfed by double-membrane autophago-somes and delivered to the vacuole or lysosome for degradation and recycling, has been implicated in Crohn’s disease pathogenesis since the identification of ATG16L1 and IRGM as Crohn’s disease susceptibility genes15. The newly identified Crohn’s disease gene ATG4B encodes a cysteine protease with a central role in this process, reinforcing the importance of autophagy in Crohn’s disease pathogenesis. Likewise, the importance of epithelial barrier function in IBD pathogenesis (previously highlighted by associations with LAMB1 and HNF4A16) is underscored by the new association at OSMR, which modulates a barrier-protective host response in intestinal inflammation.
Many of the newly identified candidate genes, including LY75, CD28, CCL20, NFKBIZ, AHR and NFATC1, modulate specific aspects
Box 1 Select candidate genes in the newly associated iBD susceptibility loci
PTGS2 encodes COX-2, an enzyme that converts arachidonic acid into prostaglandins and that is the pharmacological target of non-steroidal anti-inflammatory drugs (NSAIDs). Prostaglandins were once thought to be exclusively proinflammatory (hence the anti-inflammatory moniker of NSAIDs), although there is now increasing evidence that some may have important anti-inflammatory roles through inhibiting T cell activation and promoting regulatory T cell development25. Consistent with this new evidence, NSAIDs are generally avoided in IBD, as they are known to precipitate disease flares.
LY75 encodes DEC-205 (also known as CD205), a cell surface receptor that is highly expressed on dendritic cells and is involved in the endocytosis of extracellular antigens and their presentation on major histocompatibility complex (MHC) class I molecules26. This receptor has been shown to have an important role in T cell function and homeostasis27.
CD28 encodes a key co-stimulatory molecule that has an important role in T cell activation. The corresponding locus contains other genes that are also involved in T cell co-stimulation, including ICOS and CTLA4. Stimulation of T cells in the absence of co-stimulatory signal typically leads to anergy—one of the three main processes that can bring about tolerance, an important means of preventing aberrant immunological responses to intestinal antigens.
CCL20 encodes a chemokine that is produced by the intestinal epithelium28 and that binds and activates CCR6. This interaction is important in regulating the migration of T cells (especially regulatory T cells) and dendritic cells to the gut, with increased production of CCL20 being detectable during inflammation29. Consistent with this evidence, IBD in mouse models is modulated by the absence of CCR6 (ref. 30). The CCR6 locus is itself associated with IBD.
NFKBIZ encodes NF-κB inhibitor ζ (NFKBIZ), an inducible regulator of NF-κB. This protein has been shown to have several functions, including roles in natural killer cell activation31 and monocyte recruitment32. Recently, however, NFKBIZ has also been shown to be a critical regulator of TH17 cell development through its interaction with ROR nuclear receptors33. Accordingly, this association further underlines the importance of T
H17 cells in IBD pathogenesis.
OSMR encodes the oncostatin M receptor, a cytokine receptor component that heterodimerizes with other proteins to form both the oncostatin M receptor and the IL-31 receptor. Oncostatin M is present at elevated levels in biopsies from patients with active IBD and is thought to promote intestinal epithelial cell proliferation and wound healing, thereby augmenting the barrier function of the intestinal epithelium in intestinal inflammation16.
AHR encodes the aryl hydrocarbon receptor, a ligand-activated transcription factor that can bind to a range of aromatic hydrocarbons, including several compounds derived from dietary components. This receptor is highly expressed on TH17 cells, and its ligation leads to their expansion and enhanced production of cytokines, including IL-22 (ref. 34). Moreover, deficiency of this receptor (or its ligands) also disrupts intraepithelial lymphocyte homeostasis, leading to failure to control intestinal microbial load and composition and aberrant immune activation resulting in epithelial damage35. Accordingly, this association further highlights the importance of the interaction between genes and the environment in IBD pathogenesis.
PTK2B encodes protein tyrosine kinase 2β (also known as Pyk2), an important intracellular kinase for diverse signaling pathways, including mitogen-activated protein kinase (MAPK) and JNK signaling. Its functions include roles in monocyte migration and neutrophil degranulation.
NFATC1 encodes nuclear factor of activated T cells, cytoplasmic 1, an NFAT transcription factor that is specifically expressed upon activation of T and B cells following ligation of their respective receptors. This expression supports lymphocyte proliferation and inhibits activation-induced cell death, leading to enhanced immune responses36. NFAT transcription factors are the main molecular targets of calcineurin inhibitors, such as cyclosporine, which are used in the treatment of IBD.
npg
© 201
5 Nature
America, Inc.
the concordant direction of effect at associated SNPs, there was high genetic correlation (rG) between the European and East Asian cohorts when considering the additive effects of all SNPs genotyped on the Immunochip19 (Crohn’s disease rG = 0.76 and ulcerative colitis rG = 0.79) (Supplementary Table 10). Given that rare SNPs (minor allele frequency (MAF) < 1%) are more likely to be specific to a particular population, these high rG values also support the notion that the majority of causal variants are common (MAF > 5%). Although the Indian and Iranian cohort sizes were small in comparison to the East Asian cohort, we observed similar trends for homogeneity of odds ratios at associated loci (Supplementary Figs. 9 and 10) and high genetic correlations with the European cohort (Supplementary Table 10). Together with the strong effect size correlations at known risk loci, these results indicate that the majority of IBD risk loci are shared across ancestral populations. Therefore, ancestry-matched groups of IBD cases and controls can be combined from divergent populations to amass the large sample sizes needed to detect further disease-associated loci.
Not all IBD risk loci are shared across populations, as evidence by rG being significantly less than 1 (P < 8.2 × 10⁻⁴) for all pair-wise population comparisons. In most cases, apparent differences in genetic risk were explained by different allele frequencies across populations. For instance, consistent with previous genetic studies of Crohn’s disease in East Asians2, the three coding variants in NOD2 (encoding nucleotide-binding oligomerization domain–containing protein 2) that had a large effect on IBD risk in Europeans (odds ratio (OR) = 2.13–3.03) had a risk allele frequency (RAF) of 0 in East Asians. Beyond these three coding variants, there is also evidence of at least four additional low-frequency independent NOD2 vari-ants on the Immunochip that are associated with Crohn’s disease in Europeans (H.H., unpublished data). In the East Asian cohort, two of these variants had a RAF of 0, whereas we were not powered to detect association at the other two variants because we observed fewer than four copies of the risk allele (MAF < 0.0004). Furthermore, no SNP within NOD2 achieved even suggestive evidence of association in the East Asian cohort (all P > 7.18 × 10⁻⁴). Larger sample sizes and more
complete ascertainment of variants (particularly in non-European cohorts) will be required to better assess the genetic architecture of NOD2 across divergent populations. Similarly, at the IL23R gene (encoding IL-23 receptor), previous studies have shown that there is substantial genetic heterogeneity between European and East Asian individuals in IBD risk2. In line with these observations, the IL23R SNP with the largest effect on risk of Crohn’s disease and ulcerative colitis in Europeans (rs80174646) had a RAF of 1 in East Asians, and secondary IL23R variants observed in Europeans were also not significantly associated with disease in the East Asian population (rs6588248, P = 0.65; rs7517847, P = 0.04). These two secondary vari-ants are common in East Asians (rs6588248, MAF = 0.39; rs7517847, MAF = 0.42), and, assuming the effect sizes observed in Europeans, we had 100% power to detect association with rs7517847 at P < 5 × 10⁻⁸ but only 84% power to detect association with rs6588248 at P < 0.05. Therefore, wecannot rule out the possibility that rs6588248 is involved in Crohn’s disease susceptibility in East Asians. Both variants showed significant heterogeneity of effect between the European and East Asian Crohn’s disease cohorts (P < 2.44 × 10⁻⁴). However, IL23R clearly has a role in IBD in the East Asian population, as evidenced by the association at rs76418789 with both Crohn’s disease and ulcerative colitis in East Asians (IBD P = 1.83 × 10⁻¹³). The same variant was previously implicated in a GWAS of Crohn’s disease in Koreans (Supplementary Table 5) (ref. 4). This variant, which has a much lower allele frequency in Europeans (MAF = 0.004) than East Asians (MAF = 0.07), demonstrated suggestive evidence of association with IBD in Europeans (P = 3.99 × 10⁻⁶; OR = 0.66) and became genome-wide significant (P = 2.31 × 10⁻¹⁰; OR = 0.53) after conditioning on the three known European risk variants (rs11209026, rs6588248 and rs7517847).
We were well powered to detect genetic heterogeneity between our East Asian and European cohorts at several alleles of large effect in Europeans (Fig. 2 and Supplementary Fig. 10). For example, at ATG16L1, the reported Crohn’s disease risk variant in Europeans (rs12994997) had a RAF of 0.53 and an OR of 1.27. The variant showed no evidence of association in East Asians (P = 0.21), a finding driven at
a
CPSF3L
CPSF3L
DYRK2, IFNG MAPKAPK2, IL10
MST1 ATP6V1G3, PTPRC SLC2A13, LRRK2 IP6K2 C5orf56 NFATC1 SLC2A13, LRRK2 ATP6V1G3, PTPRC OLIG3, TNFAIP3 TNFSF15 PPBP, CXCL5
East Asian P values 2.00
1.75 1.50
1.25
1.00
Crohn’s disease odds ratios in East Asians
0.75
0.50
0.05
0.50 0.75 1.00
Crohn’s disease odds ratios in Europeans
1.25 1.50 1.75 2.00 5 × 10⁻⁴ 5 × 10⁻⁶ 5 × 10⁻⁸ P = 2.94 × 10⁻²² r2 = 0.4 Fitted line P = 2.47 × 10⁻³¹ r2 = 0.53 Fitted line East Asian P values 2.00
1.75 1.50
1.25
1.00
Ulcerative colitis odds ratios in East Asians
0.75
0.50
0.05
0.50 0.75 1.00
Ulcerative colitis odds ratios in Europeans
1.25 1.50 1.75 2.00 5 × 10⁻⁴
5 × 10⁻⁶
5 × 10⁻⁸
b
Figure 1 Comparison of odds ratios for Crohn’s disease and ulcerative colitis risk variants in Europeans and East Asians. (a,b) For each SNP, odds ratios
(on a log scale) were estimated within each population for Crohn’s disease (a) and ulcerative colitis (b). The color of each point denotes the association P value for that phenotype in East Asians. The red line denotes the best-fitting least-squares regression line, weighted by the inverse of the variance of
the log(ORs) in East Asians. Significance and goodness-of-fit are shown in red.
npg
© 201
5 Nature
America, Inc.
least in part by a significant difference in allele frequency (RAF = 0.24 in East Asians; FST = 0.15). However, assuming the effect size at this SNP in the East Asian cohort was equal to that seen in the European cohort, we would still have more than 80% power to detect suggestive evidence of association (P < 5 × 10⁻⁵). In addition to differences in allele frequency, we also observed evidence of heterogeneity of odds at this SNP (East Asian OR = 1.06; P = 8.45 × 10⁻⁴). The previously reported lead SNP at the IRGM locus in Europeans also showed only nominally significant evidence of association with Crohn’s disease in East Asians (rs11741861: European P = 5.89 × 10−44, East Asian P = 2.62 × 10⁻³) as well as evidence of heterogeneity of effect (European OR = 1.33 versus East Asian OR = 1.13; heterogeneity P = 1.20 × 10⁻³). However, not all loci demonstrating significant heterogeneity of odds had lower effect sizes in the non-European cohort: two of the three independent signals at TNFSF15-TNFSF8 had much larger effects on IBD risk in East Asians (rs4246905: European OR = 1.15 and East Asian OR = 1.75; rs13300483: European OR = 1.14 and East Asian OR = 1.70), despite similar allele frequencies in the two populations.
The third European risk variant was not significantly associated in East Asians (rs11554257: P = 0.21), although this might reflect a lack of power (76% power to detect this variant at P < 0.05 when assuming an identical odds ratio).
Although the incidence of IBD is rising in developing countries, comparable data on the clinical phenotype of disease in European and non-European populations are limited. We collected subphenotype data on 4,686 patients with IBD from East Asia, India and Iran and compared these data with available clinical phenotypes for 35,128 Europeans. Given that the current cohort is the largest available for clinical comparisons of IBD in Europeans and non-Europeans, we performed basic comparative statistical analyses. Overall, our data showed some demographic differences between the European and non-European populations, with male predominance in Crohn’s disease (67% of non-European patients with Crohn’s disease were male in comparison to 45% of European patients; P = 7.09 × 10−78). Furthermore, we observed more stricturing behavior (P = 2.02 × 10⁻³³) and perianal disease (P = 5.36 × 10⁻³³) and less inflammatory Crohn’s
a
NOD2 22 22 ETS2, PSMG1 RPL3, SYNGR1 PDGFB, RPL3 GPR12, USP12 GOT1, NKX2–3 RCL1, JAK2 GNA12 LOC285740, PHACTR2 FCGR2A FCGR2A IL23R CTH, PTGER3 RNF186, OTUD3 RNF186, OTUD3 21 21 20 20 19 19 18 18 17 17 16 16 15 15 13 13 12 12 11 11 10 10 9 9 8 8 7 7 6 6 5 5 4 4 3 3 2 2 1 1 STAT3 GOT1, NKX2–3 ZNF365, ADO TNFSF15, TNFSF8 TNFSF15 HLA-DQA1, HLA-DQB1 HLA-DQA1, HLA-DQB1 HLA-DQA1, HLA-DQB1 IL 12B, LOC285627 PPBP, CXCL5 TBC1D1, FLJ13197 ZBTB38 GPR35 NOD2 NOD2 DAB2, PTGER4 Chromosome Chromosome ATG16L1 IL23R IL23R European EuropeanMonomorphic in non–Europeans Similar MAF and OR Different MAF Different OR Different MAF and different OR
East Asian East Asian
b
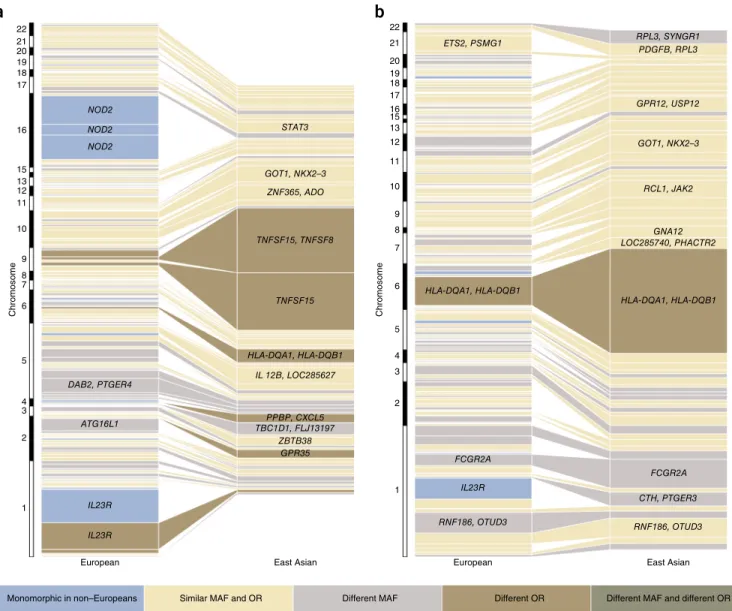
Figure 2 Comparison of variance explained per risk variant for Crohn’s disease and ulcerative colitis between East Asians and Europeans. (a,b) Each
box represents an independently associated SNP for Crohn’s disease (a) and ulcerative colitis (b). The size of each box is proportional to the amount
of variance in disease liability explained by that variant. Only SNPs with association P < 0.01 are included in the East Asian panel. The color of each box denotes whether any difference in variance explained is due to differences in allele frequency (FST > 0.1/monomorphic in East Asians), significant heterogeneity of odds ratios (P < 2.5 × 10⁻⁴) or both.
npg
© 201
5 Nature
America, Inc.
disease (P = 4.28 × 10⁻³²) in the non-European population. In ulcera-tive colitis, there was a lower rate of extensive colitis reported in the non-European population (P = 1.52 × 10⁻³⁴), which was also reflected in a lower rate of colectomy (P = 1.23 × 10−69) (Supplementary Table 11). Although these data have been collected retrospectively, the current findings are in line with previously reported prospectively collected clinical findings in incident cases of IBD in non-Europeans2.
DISCUSSION
We identified 38 additional IBD susceptibility loci by adding an extra 11,535 individuals of European descent and 9,846 individuals of non-European descent to our previously reported non-European-only cohort of 75,105 samples. Given that trans-ancestry association studies prin-cipally identify risk loci shared across populations, we would expect to identify a similar number of associated loci had all the individuals in this study been of the same ancestry. Our analyses suggest that significant differences in effect size are minimal at all but a handful of associated loci, further indicating that trans-ancestry association studies represent a powerful means of identifying new loci in com-plex diseases such as IBD. Furthermore, the nearly complete sharing of genetic risk among individuals of diverse ancestry has important consequences for association studies and disease risk prediction in non-European populations. First, a significant association in one population makes the locus in question a very strong candidate for involvement in IBD risk worldwide. Second, our data suggest that odds ratios estimated from a very large association study are likely to better represent the effect size of the associated variants in a second, ancestrally diverse population than those estimated from a substan-tially smaller study in the second population itself (because of the larger sampling variance in the second study). Finally, because rare alleles are more likely than common variants to be specific to a partic-ular population, the substantial number of IBD risk loci shared across ancestral populations implies that the underlying causal variants at these loci are common. This adds further weight to the grow-ing number of arguments against the ‘synthetic association’ model explaining a large proportion of GWAS loci20–22.
Although the majority of risk-associated loci are shared across populations, we were able to detect a handful of loci demonstrating heterogeneity of effect between populations. Major European risk variants in NOD2 and IL23R are not present in individuals of East Asian ancestry. The relatively small sample size of the non-European cohorts and the fact that Immunochip SNP selection was only based on resequencing data from individuals of European ancestry hinder our ability to identify association with sites that are monomorphic in Europeans but polymorphic in non-Europeans. Targeted resequenc-ing efforts in large numbers of non-European IBD cases and controls, similar to those undertaken in European cohorts, may identify such associations and thus provide further insight into the genetic architec-ture of IBD23,24. The much smaller number of individuals in the non-European cohorts also reduces power to detect heterogeneity of effect versus the European cohort, and we therefore may be overestimating the degree of sharing between the various ancestry groups.
In addition to allele frequencies differing between ancestral popula-tions, patterns of LD can also vary greatly; such differences further complicate comparisons of genetic architecture for complex disease across diverse populations. For example, we observed significant heterogeneity of odds at the TNFSF15-TNFSF8 and ATG16L1 loci, potentially suggesting that gene-environment interactions increase the variance explained by these associations in either European (ATG16L1) or non-European (TNFSF15-TNFSF8) populations. Although this hypothesis is attractive, the heterogeneity in effect
sizes could also be underpinned by differential tagging of untyped causal variants at these loci in one or both populations. Although the Immunochip provides dense coverage of 186 previously associated loci, SNP selection was based on low-coverage sequence data from a pilot release of the 1000 Genomes Project. Approximately 240,000 SNPs were selected for inclusion, with an assay design success rate of approximately 80%. Therefore, it is possible that causal variants could remain untyped, even within the dense fine-mapping regions of the Immunochip, and the chances of this occurring are greater still in populations of non-European ancestry. Until the causal variants that underlie these associated loci have been identified (or all SNPs within these loci are included in the association tests), we cannot rule out the possibility that differential tagging of untyped causal variants is driving the observed heterogeneity in effects.
In summary, we have performed the first trans-ancestry associa-tion study of IBD and identified 38 risk loci, increasing the number of known IBD risk loci to 200. Together, these loci explain 13.1% and 8.2% of the variance in disease liability for Crohn’s disease and ulcerative colitis, respectively. The majority of these loci are shared across diverse ancestry groups, with only a handful demonstrating popula-tion-specific effects driven by heterogeneity in RAF (for example, NOD2) or effect size (for example, TNFSF15-TNFSF8). Concordance in direction of effect is significantly enriched among SNPs demon-strating only suggestive evidence of association, indicating that larger trans-ancestry association studies may represent a powerful means of identifying more risk loci for IBD. By leveraging imputation based on tens of thousands of reference haplotypes or directly sequencing large numbers of cases and controls, these studies will more thoroughly survey causal variants and thus have increased ability to model the genetic architecture of IBD across diverse ancestral populations. URLs. National Human Genome Research Institute (NHGRI) GWAS Catalog, http://www.genome.gov/admin/gwascatalog.txt; functionGVS, http://snp.gs.washington.edu/SeattleSeqAnnotation141/; Variant Explorer, http://molgenis70.target.rug.nl/index.htm. METHODS
Methods and any associated references are available in the online version of the paper.
Note: Any Supplementary Information and Source Data files are available in the online version of the paper.
ACKNOWLEDGMENTS
R.K.W. is supported by a VIDI grant (016.136.308) from the Netherlands Organization for Scientific Research (NWO) and the Broad Medical Research Program of the Broad Foundation (IBD-0318). L.F. is supported by the Netherlands Organization for Scientific Research (NWO), through NWO VENI grant 916.10.135 and NWO VIDI grant 917.14.374. The research leading to these results has received funding from the European Community’s Health Seventh Framework Programme (FP7/2007–2013) under grant agreement 259867. T.B.K. is supported by Centre of Excellence grant BT/01/COE/07/UDSC/2008 from the Department of Biotechnology of the government of India (New Delhi, India). The collection of Iranian samples has been supported by the Tehran University of Medical Sciences, Iran. UK case collections were supported by the National Association for Colitis and Crohn’s Disease, the Wellcome Trust, the Medical Research Council UK and the Peninsular College of Medicine and Dentistry, Exeter. We also acknowledge National Institute for Health Research (NIHR) Biomedical Research Centre awards to Guy’s and St Thomas’ NHS Trust/King’s College London and to Addenbrooke’s Hospital/University of Cambridge School of Clinical Medicine. A.P.M. is supported by the Wellcome Trust under award WT098017. J.Z.L., T.S., J.C.B. and C.A.A. are supported by the Wellcome Trust (098051).
AUTHOR CONTRIBUTIONS
Study design: J.Z.L., S.v.S., H.H., A.P.M., J.C.B., B.Z.A., M.P., T.B.K., M.J.D., A.F., C.A.A. and R.K.W. Collection of samples and clinical information: S.C.N., J.C.L.,
npg
© 201
5 Nature
America, Inc.
S.A., J.H.C., N.E.D., Y.F., A.H., R.C.J., G.J., W.H.K., H.P., W.G.N., V.M., T.R.O., H.V., A.S., J.J.Y.S., R.M., K.Y., S.-K.Y., M.K., T.B.K., A.F. and R.K.W. Quality control and genotype calling: J.Z.L., S.v.S., B.Z.A., H.H., L.J., T.S. and C.A.A. Statistical analyses: J.Z.L., S.v.S., H.H., A.T., L.J., R.A., S.R., H.-J.W., L.F., C.A.A. and R.K.W. Writing of the manuscript: J.Z.L., S.v.S., H.H., J.C.L., J.C., B.Z.A., M.P., C.A.A. and R.K.W.
COMPETING FINANCIAL INTERESTS
The authors declare no competing financial interests.
Reprints and permissions information is available online at http://www.nature.com/
reprints/index.html.
1. Molodecky, N.A. et al. Increasing incidence and prevalence of the inflammatory bowel diseases with time, based on systematic review. Gastroenterology 142, 46–54 (2012).
2. Ng, S.C. et al. Incidence and phenotype of inflammatory bowel disease based on results from the Asia-Pacific Crohn’s and Colitis Epidemiology Study. Gastroenterology
145, 158–165 (2013).
3. Asano, K. et al. A genome-wide association study identifies three new susceptibility loci for ulcerative colitis in the Japanese population. Nat. Genet. 41, 1325–1329 (2009).
4. Yang, S.K. et al. Genome-wide association study of Crohn’s disease in Koreans revealed three new susceptibility loci and common attributes of genetic susceptibility across ethnic populations. Gut 63, 80–87 (2014).
5. Juyal, G. et al. Genome-wide association scan in north Indians reveals three novel HLA-independent risk loci for ulcerative colitis. Gut 64, 571–579 (2015). 6. Jostins, L. et al. Host-microbe interactions have shaped the genetic architecture of
inflammatory bowel disease. Nature 491, 119–124 (2012).
7. Mahajan, A. et al. Genome-wide trans-ancestry meta-analysis provides insight into the genetic architecture of type 2 diabetes susceptibility. Nat. Genet. 46, 234–244 (2014).
8. Okada, Y. et al. Genetics of rheumatoid arthritis contributes to biology and drug discovery. Nature 506, 376–381 (2014).
9. Pirinen, M., Donnelly, P. & Spencer, C. Efficient computation with a linear mixed model on large-scale data sets with applications to genetic studies. Ann. Appl. Stat.
7, 369–390 (2013).
10. Morris, A.P. Transethnic meta-analysis of genomewide association studies. Genet. Epidemiol. 35, 809–822 (2011).
11. Yamazaki, K. et al. A genome-wide association study identifies 2 susceptibility loci for Crohn’s disease in a Japanese population. Gastroenterology 144, 781–788 (2013).
12. Okada, Y. et al. HLA-Cw*1202–B*5201–DRB1*1502 haplotype increases risk for ulcerative colitis but reduces risk for Crohn’s disease. Gastroenterology 141, 864–871 (2011).
13. Juyal, G. et al. An investigation of genome-wide studies reported susceptibility loci for ulcerative colitis shows limited replication in north Indians. PLoS ONE 6, e16565 (2011).
14. Westra, H.J. et al. Systematic identification of trans eQTLs as putative drivers of known disease associations. Nat. Genet. 45, 1238–1243 (2013).
15. Rioux, J.D. et al. Genome-wide association study identifies new susceptibility loci for Crohn disease and implicates autophagy in disease pathogenesis. Nat. Genet.
39, 596–604 (2007).
16. Beigel, F. et al. Oncostatin M mediates STAT3-dependent intestinal epithelial restitution via increased cell proliferation, decreased apoptosis and upregulation of SERPIN family members. PLoS ONE 9, e93498 (2014).
17. Dastani, Z. et al. Novel loci for adiponectin levels and their influence on type 2 diabetes and metabolic traits: a multi-ethnic meta-analysis of 45,891 individuals. PLoS Genet. 8, e1002607 (2012).
18. Teslovich, T.M. et al. Biological, clinical and population relevance of 95 loci for blood lipids. Nature 466, 707–713 (2010).
19. Lee, S.H. et al. Estimation of pleiotropy between complex diseases using single-nucleotide polymorphism–derived genomic relationships and restricted maximum likelihood. Bioinformatics 28, 2540–2542 (2012).
20. Dickson, S.P., Wang, K., Krantz, I., Hakonarson, H. & Goldstein, D.B. Rare variants create synthetic genome-wide associations. PLoS Biol. 8, e1000294 (2010). 21. Anderson, C.A., Soranzo, N., Zeggini, E. & Barrett, J.C. Synthetic associations are
unlikely to account for many common disease genome-wide association signals. PLoS Biol. 9, e1000580 (2011).
22. Wray, N.R., Purcell, S.M. & Visscher, P.M. Synthetic associations created by rare variants do not explain most GWAS results. PLoS Biol. 9, e1000579 (2011). 23. Beaudoin, M. et al. Deep resequencing of GWAS loci identifies rare variants in
CARD9, IL23R and RNF186 that are associated with ulcerative colitis. PLoS Genet.
9, e1003723 (2013).
24. Rivas, M.A. et al. Deep resequencing of GWAS loci identifies independent rare variants associated with inflammatory bowel disease. Nat. Genet. 43, 1066–1073 (2011).
25. Kalinski, P. Regulation of immune responses by prostaglandin E2. J. Immunol. 188, 21–28 (2012).
26. Bonifaz, L. et al. Efficient targeting of protein antigen to the dendritic cell receptor DEC-205 in the steady state leads to antigen presentation on major histocompatibility complex class I products and peripheral CD8+ T cell tolerance. J. Exp. Med. 196, 1627–1638 (2002).
27. Fukaya, T. et al. Conditional ablation of CD205+ conventional dendritic cells impacts the regulation of T-cell immunity and homeostasis in vivo. Proc. Natl. Acad. Sci. USA 109, 11288–11293 (2012).
28. Izadpanah, A., Dwinell, M.B., Eckmann, L., Varki, N.M. & Kagnoff, M.F. Regulated MIP-3α/CCL20 production by human intestinal epithelium: mechanism for modulating mucosal immunity. Am. J. Physiol. Gastrointest. Liver Physiol. 280, G710–G719 (2001).
29. Kaser, A. et al. Increased expression of CCL20 in human inflammatory bowel disease. J. Clin. Immunol. 24, 74–85 (2004).
30. Varona, R., Cadenas, V., Flores, J., Martínez, A.C. & Márquez, G. CCR6 has a non-redundant role in the development of inflammatory bowel disease. Eur. J. Immunol.
33, 2937–2946 (2003).
31. Miyake, T. et al. IκBζ is essential for natural killer cell activation in response to IL-12 and IL-18. Proc. Natl. Acad. Sci. USA 107, 17680–17685 (2010). 32. Hildebrand, D.G. et al. IκBζ is a transcriptional key regulator of CCL2/MCP-1.
J. Immunol. 190, 4812–4820 (2013).
33. Okamoto, K. et al. IκBζ regulates TH17 development by cooperating with ROR nuclear receptors. Nature 464, 1381–1385 (2010).
34. Duarte, J.H., Di Meglio, P., Hirota, K., Ahlfors, H. & Stockinger, B. Differential influences of the aryl hydrocarbon receptor on Th17 mediated responses in vitro and in vivo. PLoS ONE 8, e79819 (2013).
35. Li, Y. et al. Exogenous stimuli maintain intraepithelial lymphocytes via aryl hydrocarbon receptor activation. Cell 147, 629–640 (2011).
36. Serfling, E. et al. NFATc1/αA: the other face of NFAT factors in lymphocytes. Cell Commun. Signal. 10, 16 (2012).
npg
© 201
5 Nature
America, Inc.
ics committees or institutional review boards of all individual participating centers or countries. Written informed consent was obtained from all study participants.
GWAS cohort, quality control and analysis. Cohorts and quality control. The
GWAS cohorts and quality control are described in detail in Jostins et al.6.
Briefly, seven Crohn’s disease and eight ulcerative colitis collections with genome-wide SNP data were combined. Samples were genotyped on a com-bination of the Affymetrix GeneChip Human Mapping 500K, Affymetrix Genome-Wide Human SNP Array 6.0, Illumina HumanHap300 BeadChip and Illumina HumanHap550 BeadChip arrays. After SNP and sample quality control, the Crohn’s disease data consisted of 5,956 cases and 14,927 controls, the ulcerative colitis data consisted of 6,968 cases and 20,464 controls, and the data for Crohn’s disease and ulcerative colitis combined (IBD) consisted of 12,882 cases and 21,770 controls. The number of SNPs per collection varied between 290,000 and 780,000.
Imputation. Genotype imputation was performed using the prephasing/
imputation stepwise approach implemented in IMPUTE2/SHAPEIT (chunk size of 3 Mb and default parameters)37,38. The imputation reference set
con-sisted of 2,186 phased haplotypes from the full 1000 Genomes Project data set (August 2012, 30,069,288 variants, release v3.macGT1).
Association analysis. Genome-wide association analyses was carried out for
Crohn’s disease, ulcerative colitis and IBD (the Crohn’s disease and ulcerative colitis cases combined). After applying filters requiring MAF > 1% and imputa-tion INFO score > 0.6 to all imputed variants, around 9 million variants were found to be suitable for association analysis. Association tests were carried out in PLINK, using the post-imputation genotype dosage data and using 10, 7 and 15 principal components for Crohn’s disease, ulcerative colitis and IBD, respectively, as covariates, chosen from the first 20 principal components. The Crohn’s disease, ulcerative colitis and IBD scans had genomic inflation (λGC) values of 1.129, 1.114 and 1.160, respectively. Accounting for inflation
due to sample size and polygenic effects, these Crohn’s disease, ulcerative colitis and IBD λΓ values are equivalent to λGC 1,000 (the inflation factor from
a sample size of 1,000 cases and 1,000 controls)39 values of 1.015, 1.011 and
1.010, respectively.
Immunochip cohort, quality control and analysis. Description of the
Immunochip. The Immunochip is an Illumina Infinium microarray
compris-ing 196,524 SNPs and small indel markers selected on the basis of results from GWASs of 12 different immune-mediated diseases. The Immunochip enables replication of all nominally associated SNPs (P < 0.001) from the index GWAS scans and fine mapping of 186 loci associated at genome-wide significance with at least 1 of the 12 index immune-mediated diseases. Within fine-mapping regions, SNPs from the 1000 Genomes Project pilot Phase 1 (European cohorts), plus selected autoimmune disease resequencing efforts, were selected for inclusion (with a design success rate of around 80%). The chip also con-tains around 3,000 SNPs added as part of the Wellcome Trust Case Control Consortium 2 (WTCCC2) project replication phase. These SNPs are useful for quality control purposes because they have not previously been associated with immune-mediated diseases (‘null’ SNPs).
Cohorts of European ancestry. Recruitment of patients and matched controls
genotyped with the Immunochip was performed in 15 countries in Europe, North America and Oceania (Table 1). Diagnosis of IBD was based on accepted radiological, endoscopic and histopathological evaluation. All included cases fulfilled clinical criteria for IBD. Genotyping was performed across 36 batches and included a total of 19,802 Crohn’s disease cases, 14,864 ulcerative coli-tis cases and 34,872 population controls. The Immunochip cohort included 3,424 Crohn’s disease cases, 3,189 ulcerative colitis cases and 7,379 population controls present in the GWAS cohort. The overlapping Immunochip samples were excluded from the trans-ancestry association analysis but included in the modeling of European versus non-European IBD because this was based solely on Immunochip data.
Cohorts of East Asian, Indian and Iranian ancestry. East Asian patients with
IBD and controls were recruited from the following countries: Japan (Institute of Medical Science, University of Tokyo, RIKEN Yokohama Institute and Japan
IBD cases and controls were recruited from Dayanand Medical College and Hospital, Ludhiana, and the University of Delhi South Campus. Iranian cases and controls were recruited from the Tehran University of Medical Sciences. Samples recruited as part of a European cohort but that clustered with a European cohort in principal-component analysis were reassigned to the non-European cohort. In total, 6,598 East Asian, 3,088 Indian and 1,393 Iranian individuals were genotyped on the Immunochip (Table 1, Supplementary
Figs. 1 and 2, and Supplementary Table 12).
Phenotype data. Detailed phenotype data (including sex, ancestry, age of
disease onset, smoking status, family history, extraintestinal manifestations and surgery) were available for 47,799 European IBD cases and 3,986 non-European IBD cases (Supplementary Table 11). Disease location and behavior were assessed with the Montreal classification. Clinical demographics and disease phenotype were compared in the European and non-European cohorts using χ2 analysis (SPSS 20).
Genotyping and calling. The Immunochip samples were genotyped in 36
batches. Normalized intensities for all samples were centrally called using the optiCall clustering program40 with Hardy-Weinberg equilibrium
blank-ing disabled and the no-call cutoff set to 0.7. Before callblank-ing all data, we first established the optimal composition of sample sets. Calling per genotyping batch turned out to give the most reliable genotype clustering (in comparison to calling individual ancestral populations separately within each genotyping batch, calling all individuals per ancestry group together or calling all avail-able data together).
Quality control. Quality control was performed separately in each
popula-tion (East Asian, Iranian, Indian and European) using PLINK41. Individuals
were assigned to populations on the basis of principal-component analysis. This analysis was performed using EIGENSTRAT42 on a set of 15,552
Immunochip SNPs that had pairwise r2 < 0.2 and MAF > 0.05 and were present
in 1000 Genomes Project Phase 2 data. The first two principal components were estimated for the 1000 Genomes Project individuals and projected onto all Immunochip cases and controls. As expected, a clear separation between the different populations was seen (Supplementary Fig. 3). Samples were assigned to the population with which they clustered, and those that did not cluster with any of the reported populations were removed.
Marker quality control. SNPs were removed if they (i) were not on
auto-somes; (ii) had a call rate lower than 98% across all genotyping batches in the population and/or lower than 90% in one of the genotyping batches; (iii) were not present in 1000 Genomes Project Phase 1 data; (iv) failed Hardy-Weinberg equilibrium (FDR < 1 × 10⁻⁵ across all samples or within each genotyping
batch); (v) had heterogeneous allele frequencies between the different genotyp-ing batches within one population (FDR < 1 × 10⁻⁵; in genotyping batches with
more than 100 samples); (vi) had different missing genotype rates for cases and controls (P < 1 × 10⁻⁵); and (vii) were monomorphic in the population.
After marker quality control, 125,141 SNPs remained in the East Asian data set, 145,857 SNPs remained in the Indian data set, 152,232 SNPs remained in the Iranian data set and 144,245 SNPs remained in the European data set.
Sample quality control. Samples with a low call rate (<98%) and samples
with an outlying heterozygosity rate (FDR < 0.01) were removed. Identity by descent was calculated using an LD-pruned set of SNPs with MAF > 0.05. Sample pairs with identity by descent of >0.8 were considered duplicates, and pairs with identity by descent of >0.4 and <0.8 were considered related. For all duplicate and related pairs, the sample with the lowest genotype call rate was removed. After sample quality control, 6,543 (2,824 cases, 3,719 controls) East Asian samples, 2,413 (1,423 cases, 990 controls) Indian samples, 890 (548 cases, 342 controls) Iranian samples and 65,642 (31,664 cases, 33,977 controls) European samples remained.
Per-population association analysis. Case-control association tests for
Crohn’s disease, ulcerative colitis and IBD were performed in each ancestry group (European, East Asian, Indian and Iranian) using a linear mixed model as implemented in MMM9. A covariance genetic relatedness matrix, R, was
included as a random-effects component in the model to account for popula-tion stratificapopula-tion. To avoid biases in the estimapopula-tion of R due to the design of the Immunochip, SNPs were first pruned for LD (pairwise r2 < 0.2). Of the
remaining SNPs, we then removed those that lay in the HLA region or had
npg
© 201
5 Nature
America, Inc.