I
|J</
5rc
EARTH SURFACE PROCESSES AND LANDFORMS' VOL' 1O'
I7}I87
(1985)CARBON
DIOXIDE
IN
CAVE ATMOSPHERES.
NEW
RESULTS
IN
BELGIUM
AND
COMPARISON
WITH
SOME
OTHER COUNTRIES
CAMILLE EK'
Laboratoire de Géomorphologie et de Géologie du Quarernaire, I)niaersité de Lièle, Place du 20'Août,7, 8-4000 Liège' tselgium ÀND
MICHEL GEWELTI
Centre d'Etüe de l,Energie Nucléaire (CENISCK), Mesures Bas-Nioequx, Boeretang,2æ, B-24A0 Mol, Belgiun-r
Receiued l5 December 1983 Ret:ised 24 MaY 1984
ABSTRACT
More than 600 measurements of the carbon dioxide content of cav€ air in Belgium lead up to the conclusiotr that the maiu factors of
is
distributlo"uii,
(l)
a flow originaüng from the biomass and diffusing in the soil and the voids of bedrock;iZj
"tr*0,
discernible ior..y
tiiU air only,io go dôwa by density; (3) in some caves, draughts caused, for instaoce, by aswift underground strealn.
Results in-Belgium are càmpared with published and unpublished data.from other countries, sbowiog tbat
Co,
is often less abundantii
cold climati caves and io caves of semi-arid regions (iafluence of the biomass).ip*i"flrt.Dtion
is paid to human coûtamitration during analÿses: tbe influence of people passiog through the caveo."iUy
tÀe operator, but aiso tbe influence of the operator himseif are discussed, and the use of special precautions (incluâing a ôOr-absorbing mask) in defioed critical situations is stresed.KEy woRDS carbon dioxide caves Human contamination seasonal variarions
INTRODUCTION
Carbon dioxide
is
ol
paramount
importancein
lirnestone solution.Although
theaction
of
other
acids is neither igaored nor unàerestimated here, it is obvious, at least in temperate and cold regions, that carbonic gas isin
most cases theprime
mover aDd themain
agentof
carbonate dissolution.Carbon dioxide in water comes either directly
from
the air or from the metabolism of thebiomass-and in
this
casealso,
oftdn
througb
a
gaseousphase-hence the primordial interest
of
knowing
the
CO.
concentrations and movements
in
the limestone environments, Particularlyin
cave air,in
soilair
andin
the lowermost atmosphere.More
than 600 measurementsof
carbondioxide
have been carriedout in
Belgium,all of
them carefullylocated
in
space, time and weather conditions. 'ÿ/etry
here to summarizein
a few pages the main resultsof
these analyses andto
compare themwith
some other studies of carbonic gasall
over theworld.
'Cbcf dc travaux.
t Rcscarch fi5si5rrn1 National Fund for Scicntific Rcsearch (F.N.R.S., Belgiun)'
019',7 -933't
lïs
I 02017
3-t
ssoi.50':r.1 ,.):r : a:.\ ,;::i r,r {1 ::i :::: ri .1j
,]
.ri 174 C. EK AND M. GEWELTMETHODS
AND
TECHNIQUES
M e t hods
of
me asureînentA1l
our
recent measurements are donewith
a gas pump detector(Bendix-Gastec).
The Gastec detector tubes (2LL
or
2 L) give a direct reading of the CO, conceutration in the air(ppm/vol).*
Before, an electrolytic field device had been used(Koepf,
1952;Hilger,
1963; Delecour, 1965; Eket al.,l961;Delecour et
al.,196g).This system, based on the electrolysis of a NaCl solution which had absorbed
CO,
is more precise (t
0.1 mgCo2ll
i'e--
60 ppm: Ek, 1981) but heavier and slower. Thus,for
field invesrigation, the Gastec pump sysrem is more useful: it is very light and only 2 or 3 minutes are needed for one measurement. The minimal precision,guaranteed
by
the manufacturer,is
t
25 per centbut
it
seemsthat
the effective precision is better and thereproducibility
of measurementsis
+
10 per cent (Ek et a1.,198l).
When*e
.*pr.si
the results in ppm/vol, werefer
to
the Gastec detector measurements.For
older measurements done*ith
the electrolyticmetiod,
we keep the expression of the results in mg COr/1. The equivaleuce depending among other thingsor
temperatureis
about
0.18mg/l:
100ppm/vol in
TpN
conditions.Precaut ion dur ing the meosurements
With
respect tothe
human breathingout CO,
(about 4&103 ppm:Miotke
1974),itis
veryimporrant
to avoid human exhaiation during the measurements. A carboo dioxiàe absorber system has been systematically used when measuremeDts have beencarried out in
fissures,joints,
and confiaed atmosphere..This system, describedin Figure
l,
is composed of a plexiglas surrounding wall in theform
of ay
branch,with
two valvesof
large diameter (-
2'5 cm). Theinlet
valve opens to the cave air, and the air breathed in and out is ejectedthrough the outlet valve into a stainless steel reservoir filled with soda lime. The exhaled
CO,
is thenabàrbed
by this soda lime.
A
rubber mouthpiece-coming from
asnorkel-is
fixed to the plexiglas-surrounding walland a nose
clip
obliges the operator to breathe by the mouth. The rubber mout-h piececÀbined
with the noseclip is more
comfortable
thanthe'total'
nose and mouth mask we used before. TÀe necessity of using thisCO,
absorber system is evident and
will
be demonstrated later. In the same way, we donot
use acetylene (carbidelamp), but only electric light during
analyses.RESULTS
AND
DISCUSSION FOR
BELGIAN
CAVES.Fusures uersus larger passages
Cave
air
generally contains more carbon dioxide than the open atmosphere. Under temperate conditions,the
CO,
Pressurein
the caves is generally two to twenty times highertharrin
open air,.o-.ii*.,
more. In the caves, thefirst differentiation to
appearto
the air-analyst is grossly relatedto
thewidth of
the cavity: the fissures generallydisplay
a higherCO,
content than larger passages, namely galleries and chambers.In
theTrou
Joney, atComblain,
a very shallow cave, valuesof
7'8 and tb.6 mg COr;1at
(approximately 4300 and 5900ppm)
measurqdin
ûssuresin July
1966 were3
or
4
timeshigher than the nài,r"r
displayedby
the passageways (Ek era/.,
1968). Similar observations were carried outin
Poland (Ek el a1.,1969).InBrialmont
Cave and
in
Ste-Anne Cave, both atTilff,
fissures have a higberCO,
contentüan
the respective passagesof
these caves (see
Figure
3).In Rochefort
Cave, thepCO,
isdiminishing from
rhe fissures to thebulk of
theatmosphere
of
a large chamber,The Hell, both in May
and September (Figure 2). The strong gradientof
pCO, at
theoutlet
of
the fissure seemsto
indicatethat
the carbondioxide
diffusesfrom
the crackinto
thechamber (Delecour
et
a1.,1968;Ek,
1969).Some fissures do
uot
display a highpCOr.
But, ahtrough not universal, tbe distinction between fissures andrTo convert the CO, cooceotration (in ppm
by volume) into partial pressure (pCO, in atoosphere), rhe following expression can bc used:
pco2 (in "t*.y =
pp-
co'l-!P1Pot'-r'')
'
76&106where: Pahos.
:
baroneuic presstue (in rrm Hg)Pw
= lvater vapor prEssurc (in mmfigi
t75
CARBON DIOX1DE IN CAVE ATMOSPHERES
BUBBER F MôurxptEce INLET VALVE SODA LIME PLEXIGLASS SUBFIOUNOING WALL OUTLET VALV€ sÈrRal SPRING BBEATHING IN BBEATHING OUT
5
tocmæ
APPROXIMATE SCALEl
It
Figure 1. COr-absorbing device used in confrned
tt*'
lti;:ti*ï;::rtJ"lhe
op€rator Pass€s thtoush soda lime before being
Figurc 2. Co, ütraüons ir the air of .Thc Hell,, a large chambcr in Rocbefort Cavc. Cross-section showing sampling locatioûs and
Co,
mea:rursrDeûts of May 12, lg66 and
#;;;;
,'3-,-isi-9rl"difi"d
from Dclecour et al'' 1968)
larger passages is very general,
particularly in
shallowor not too
deep cave§'In
Belgjlm.' most
accessiblefissures are in the upper part o[the galleries
an;
p"rræt',
*a
thus'as
for
fluids' there is likely to be a possibleconnection between tbe
soil
and the""r..
rirrlî,ot"üty
t*pt"ios'
for
instance'
that the gradient of Co2
THE I{EIL- CHAMBEF IN FOCHEFOFT CAVE
a
Focx deorlsi'16
c. EK AND M. cEtilELT
litÏî
tLïi"[lild
the main passases is steeper in Brialmont cave (a very shallow cave) rhan in sre-Anne,Flow of
carbon dioxidefrom
the surfoce soilAs shown
in
Figure 2' the maximumpco,
is observed,in
the caveconsidered, in a fissure connected
with
;ïj::ïj.r:iïil:io..ol
doiine.ni,
r"",,
andthe;,;;;;
gradient,n"*,
","ir,
ngure rrom theThe observations indicate
that
co,
is coming through the cracks
from
the soil,from
which biogenicco,
originates' This is corroborated uy
*ui.r
uo"lysis(Ek, i96gr
;;,.ations
of 32 underground seepage lvaters allowed the calcuiation ofpCo,
tr"o
"titptere
in
equilibriumwitn
these waters:riis
pressure is r0 to 30Iîî.|,i::ïi:::.":ï'pbo,
i'
op'o
ui.
rt
i,
ir,ri
s"r-;-;;!.i","uy
nott*"
oruoa..g,ouoa
rivers, butit
Asim,ai.oo.,u,,ll',T.:id:iiTrJ:tr"i?üri."ïHî#,ii,ï;:::riru*:;:*J:;;
abundance in caves' Yet
in
1937,Ad;;;;;
swinnertonh;r;;;*,
that the
co,
coutenr in rheso,
is 25 to90 times the amounr
of CO,
*r.aü
fou"d in
the armosphere. Since then' a greatnumbeiof
co,
..urrrr.*e,ts
have been done in the soil atmosphere, in varied edaphic
environments'
A
lot of
parametett(toiiivp.,
temperature, rvater content,-level
of
biologicactivity,
etc)are
involved in the
co'
production lntoit-
üJe
references oo ,hu,
-"u.r
can be found forexampre in:
Atkinson
(197't);Bakaiowicz(1979tBôgli(19;r'is76),.o"r.r
r,'i.tt-iiiiiî.,,,,oor",o/.(r983);Garimov(r966);Haas
;Ïï:,i'i,iïô:'
(1e'77);uioit.
(r'gz+l;Ni"od
(re75);pa;",,.,
rrgzgl;
n",Jir.j,i+, \,ste,
rstsl,RusserSeasonal euolution
The biogenic origin of most
co,
induces a seasonal variation of its pressure. This
was shown by Ek (1979)
but
was already suggestedn
yy-'i
,L
ilotl'
rrr.
first crear
uJrtutirti""lly
significaut coDfirmation of thislact
was given by Gewelt andEk
(lggii
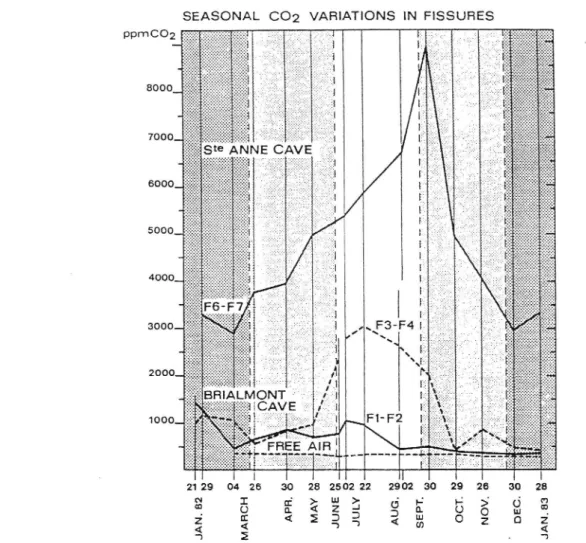
ltr§trualry slgnlncaut coFigure 3 shows the differences beiween the
pco,
figures ofJanuary and september obtained in two fissures,
in
a wet passage' January.and september"";;;'.;"d
,;r*rr.i;1,
theminimum
aud maximum varues ini:i:lii:iiÏ'ï.o3§:HÏï,if
ir","
ptàces,tn"to,
p.É,,,,,.,
observedin January are arways ress
-i:iffliiï'Jîi::ïïiffi'.t;utiu§te-Anne
cave and Briarmont cavein
re82 andre83. Most
of
The seasonal evolutionof
the p-assag"rr"y,i. lu*trated
in Figure 4, which shows that
in Brialmont
cave, lying a few metres beneath the soilt"rriâiil.
co.
content;f
,Ë;;
begins to
io"r"u*
ioiîro.
"oa
disprays amaximum
extendilg
throughtle
wtrotesumi.r,
*i.r.",
in
ste-Àni"
cave, lying some eighty to one hundrediili:iî:hl:î#"ï"Jffilf:::',
the increase inco,
p,*,,."
i,,ro*
ana rJaasioiui
*"io
pu,sases to a
In
the fissures' thefact
tÀat theflow of
co,
is comingfrom
thesoii is obvious
if
one considersthat
themaximum
pressureof CO,
is earlierin Brialmont
Caveilaa
beneathin
Ste-Anne Cave,but
moreover themaximum is displayed earlËr in
tn"
nrr*À
oithe
uppe, leu"r
orn.i"r-onr
cave,Fl
and F2, than in the cracksF3 and F4 of
the lower levelof
the same""r"
1o.
Figure 5).The
diffusion of CO,
is schematicattyiliustrated by
Figure 6.Vertical
dffireruiarion
In
a single room orlulltry.:lt pco,
is frequently higher near the roof-than near the ground.
In
this case, there is no static densityequilibrium
(éô.ir o.nr"itu"ï
"it;;;;;
gradienr is aninvÀe
density gradient. Thiskind
of verticaldistribution
".
tàot
iir'
Ek etar.rrôoa,
rxàjmay
berelated;it.,
*rtu
remperarure,with
airblow'
or withhumidity. Th.
fl;;rrirg
rro,,_tÀ.*it
i, p.irrrp,
wanner and abovea,
richer inCo,
which
explains the highpco,
obsetueà"""r
,rr"
ceiling.rni,
pn.io*enon
of soil
co,
coming from
thJfractured
upper zoue is ciearlÿ,no*o
i,
flgur"
Z.C.ARBON DIOXIDE IN CAVE ATMOSPHERES
Ficure 3. CO. titradons in Ste-Anne Cave. Cross-section of the main passage, 340 m east of tie entrancc, showing sampling locatioos
,oà
obs"rred values in January and September. Squares referto
CO, measurements, triaDgles to temp€rature and moisturemeasurements. The cross-section is somewhat schematize4 all points being not really in a vertical plane (after Gewelt and Ek" 1985)
For
examplein
the Comblain-au-Pont cave (Figure 7), thepCO,
increases from the entrance to the bottom.Nearby the
entranceof
the cave,the CO,
content correspondsto
thenormal
openair
vaiue (330 ppm),afterwards the
pCO,
increases to the bottom.An
inversion was found in the little chamber situated 3'5 m overthe bottom: the higher
CO,
content
in
this
zonemay be due
to
the diffusion
or
also
to
the
confinedmorphology of
thelittle
chamber (Delecour etal.,
1968;Ek
eta/.,
1968)-The
general downwards increasingCO,
gradieut can be due
to
an accumulation
by
gravity.
Thisphenomenon can also be reinforced by a thermal inversion which catches
tle
air near the bottom. Referringto
the Figure 8 where the temperature variations (in " C) and relative humidity (percentage) are shown duriug one year
in
Ste-Anne and Briaimont caves,it
can be seen that there is a thermal inversiouin
the main passageof
Brialmont cave rhe whole year long. The cold air is always caught near the bottom of the gallery (G6) and the
warner air is
located nearthe roof (G7). This thermal
inversionis
moreimportant during
the summer (difference of 2.5'C) and is accompanied by aCO,
stratification which can be seen in Figure 4(G6-G7)
andFigure 5 (F1-F2,
F3-F4)
(Gewelt andEk,
1985). The thermal inversion blocks the CO2 and the colder air inthè lower passage.
A
measurement done atmid-heig}t
(September 30, 1982), between G6 and G7 showsthat
the richer
CO,
layer is not only located near the bottombut
also in the half of the height of the gallery. Thus the downwardsCO,
increasing gradientis
relatedwith a gravity stratification,
accentuatedby a
thermic inversion. This may be a normal situationin
caves whereair
circulation (andventilation)
are reduced and where stratificaüon is possible. Vertical caves areprobably
a bettertrap for
COr.t17 J u u J cc U |-3 U dl F I
I
U IStE ANNE CAVE-CFOSS SECTION AT THE
.LITTLE
OPPOSITION" c ITTLE OPPOSIT .LABOfIATOFY. UNDEBGFIOUNO FIIVEF R2 Fil 28oo-7ooo o I CO2 M€ASUREMENTS(pPmlvol.) liJSiUS:{??,?%??"" ÿ Td.Tw MEASUÊEMENTS178
C. EK AND M. C]:WELT
GALLEFIIES
SEASONAL
CO2
VABTATTONStN
29 26
30!à
I
9zo
0222
2go2 !.--.,
qi
; <
H30
28 25c>ur
<t
=oS
)
2129
04 N?6-_.o
<ît
)=
28 ?', @ 2 1 Figure 4. Sۉsonal cvolution of the CO, couteatof the main passagcs of Ste-A
underground river; G: dry Dassq"*.- ,É^r:a-r
.
^oo" aad Brialoont Caves.un derground river; G: d.y
Àoe"*"i
t."ain J - ri._.àXïffj.,.rËfi
Bi!) R: wet passage: theIn
Figure git
can alsobe seen rhat the relative
humidity
in Ste_A 100 per cent)-
rhis
shorr ranse
mry u,
"or..r"t"d
;il;,;il:î*."ï;ï:
;"3rir:î::lrî:rïï,rg:i;
with
the presenceof
anundergt'"'a
l,.r-
.Driqqlrc
;;i.,
"îrLg*s
arsoto
ttresaiuration
of
the cave::ff::li:*x"'fi:iî:îi',î:1ji*fffi'.î{#rjiîyi:ll*me
variab,e (rromer
,"
16r;;;
Horizontal gradient
Éf.iiiilâiffi*î1:iÎklïH,î,l#v
observed in horizontar caves.rhis
was shown ror the nrst rimemore
abund*,
,L*",a,
,h;",a"î#ffiiîJ[]ï..."*fi::î:i""",:,::1ii*H**"mes
more andThe same phenomenon' but
above
ii.
ârir"",
;;
tfu;
R#fir"nu.p.
cave, is snorunin
Figure 9.co^
contents
of
air 20 cm above*"æt
tr'"iî.crllr.,
rro*
tÀ.;;;Ë0.
exurgence. Thewa."r is in equ,ibrium.
Ëi!,i*,:*Jiï::i*
*r"'
iu"
J,"i*.rges
rromth.
,;;;;
enteisin tn"
".o,,iüre
passage or rheHtiîî*Ïi1ï,",','ff
:jï,i,
iîjff
ffiî:î.'.',ïï;ilg
j;*l;*iisr,'î#*H;*"H",m
An
examplecombining tn"
t*o
r""ü"
&orirooor
gradient andco,
supplyby underground river to caye
SEASONAL
CO2
VABIATIONSlN
FISSUHESCARBON DIOXIDE IN CAVE ATMOSPHERES 1'79
Figure 5. Seasonal evolution of the C0, conæot of the ûssures of Ste-A.nne and Brialmont Caves. Eacb liae is the mean of the measured values in two adjacent ûssures (modiûed from Gewelt and Ek, 1985)
air) has been found in Ste-Anne cave by Gewelt and Ek (1985). Referring to Figure 10 where 27 measurements
carried
out
on January7,
1983 along themain
passageof
Ste-Anne cave are reported, an increaseof
COz concentration in cave atmosphere from the entrance to the end ofthe cave can be observed. Linear regression 3is calculated with all the measures. The correlation coefficiert, r
=
0'96 is very high and gives evidence of the existence of a positive linear relatiou betweenCO,
content and distance from the entrance. This phenomenoncan frrst be correlated
with
the decrease of the ventilation towards the end of the cave. However,it
can be seenin Figure
l0
that trrvo measurement clusters are distinguishable and that they are separated by a thresholdof
about 800- 1000 ppm. This first group of measurements is located near the entraoce aud corresponds to the
dry
part ofthe
cave. ThepCO,
increasesfrom
300 (freeair) to
1500 ppmat
160 mfrom
the entrance. Thecorrelation
coefficient(linear
regressionl)
is
r
:
0'83.
For
the
secondgroup
of
measurements (linear regression 2), r=
0.89 and theCO,
concentrations are higher towards the sump (end of the cave).It
is veryinteresting to see that the threshold between the two groups of measurements corresponds to the vanishing
of
the underground river
into
the lower passage of the cave. Tbe CO, content is maximum (3200 ppm) upstream then decreases downstream and, whenthe underground river
disappearsin
thelower gallery, the CO,
concentration falls
down
about 80G-1000ppm and then continuesto
decrease upto
the entrance.One might assume that the progressive lowering of CO, content of the air dowDstream shows variations
of
equilibrium between air and water. There is no doubt that the underground river is a purveyor ofCO, for
the21
29 04 26 30
2A 2sO222
29û230 29 26 30
2Aq ü
Ë
tËi
q
r
E
à
s
q f>-)180 C. EK AND M. GEIilELT MAX
''l'nll
o§ii$
#l/
r/il
coz
Figure6'
schematiccross-section of ste-Aare
ad
Briata:,*ffi"iIlmî*diffusion
of carbon dioxide, ."
r.""",o
b, ,h.Figurc 7. Cross-scction from .The
Shaft, of Comb&ria_au_p.",
*-ll
e'rarcc
"
;i:i.(Hffl#:,",?
,iff**"
læsüons. pCO, incrcascs from",ï:iÏï1ffi"-I"i'ff
üTffi
LYJ'.îiif*:i:;i..:tl*:rhisco,suppryrromthewarer
just
above thewater
tt""
roo;ffiui'ë
Figure
l0).
the waærter"t:
pôor'is
gènerally higherContaminations
some measures we have
used
for constnrtion
of Figures4 and 5 are too
hig!
becauseco,
contaminadon has been identified-For
moredet'ils
"uour
G n"t*"I*"-LiJà;
previoù
p";;G;rt
and Ek, 1985). '7HE SHAFT- ôEco- uet-arN-aulàÀ,r
cAvE
- -N
HEtcHT ABovE BoTToM§swNrf*...i\i-CARBON DIOXIDE IN CAVE ATMOSPHERÊS
æ 25o222
290,2§
29 2C 30
28 181 I H.o/o 95 90 85 80 75 70 65 Td oc 20 18 16 11 12 ,or3\i
TE
EiE2
29 (rl (Di
-r
o ÉFigurc g. Seasonal cvolution of thc rclative humid.ity asd &Epcratuæ in Sæ-Anne ?.d Brialmont cavcs. Thc hachured zooe shows the
thermal invcrsion in Brialmont cavc (after Gewelt and Ek, 1985)
Figurc 9. Evolution of CO, content of air 20 cm abovc watcr lcvcl bctwecn thc sump and the cxurgeoæ iD lbe RetnouchâmPs cave. The
r82 ppmC02 (Vot.) 3200 3000 2800 2600 2400 2200 2000 1 800 1600 1400 1200 1000 800 600 400 200 C. EK AND M. GEWELT
StE
ANNE
CAVE
CO2 MEASUBEMENTS ALONG THE
PASSAGE (JAN. 07,I983) MAINo
ar
---(.'-2
ar,2,3: LINEAB BEGBESSION
. h:i6O cm r h! lOcm + DBY PaSSAGE ++ UNOERGBOUND FilvEH +
SUMP
160
24O
32O
4OO
48ODISTANCE FÊOM THE ENTRANCE
Figure
l0'
Horizontal evolution (2)y:
Z.ex
+17t9.7 ofco,
(r cootent = 0.89); of (3) airr=
in 5.3 ste-Aqne cavc. Linearx iSor.l
1r=b.X1 (after regressions: Gewelt and(l)
y:
Ek,q.l x
1985)+4g4.7(r=
o.g3);v/e just want to
show here some examplesof
thecontrol of
human breathing onco,
measurements.Conlamination due
to
theoperator
:
The
following
exampleswill
prove the necessity of carryingout
co,
measurements
with
a gas absorber system,particularly in
confined atmosphere, like fissures"oir"ry
narïow
galleries.-In
3800ste-Anne
ppm' In
cave the (september 26, 1982),a
measurement donein
a
fissurewith
theco,
absorber gives same fissure, after breathingfor
five minutes atabout
I
m from the measurementsite, we measured 5000 ppm.
This
represents an increaseof
32 per cent.-In
absorber andBrialmont
avoiding cave(January 21,
lg82)a
measurementin
the fissureFl
was donerapidly, without
gas breathing. The result is 1000 ppm. The,À.
-""r.rrement
was carried out after sixexhalations
in
the ûssure and wefound
1900pp-
ii.".
increaseof
90 per cent).-In
system' Three theTrou
Joneypairs
(comblain-au-Pont),
of
6ve measurements were donewith
andwithout
theco,
absorber measures have been doneiu
acorridor
of
about
1 m2 section: theco,
average content§ increases by 80 per cent passingfrom l-18,
I-66, andl.7J
mgcor/l
toz.li,1.n,and
2.ggmg/l
respectively'
At
theextremity of
the cave,in
thedistal room,
co,
-concâtratious'pass
from
2.03 and2'32
mgll
to 5'96 aod 6'46.mgl l. This represents an increaseof
lô0 per cent (measurements date: December7,
1969:Ek,
unpublished).Contamination due
lo
rhe cauers andthe
tourists-In
three Rochefort operators cave'in
a big chamber, theinitial
co,
concentrationin
the air is 2.30 mg/I. The presenceof
for
five hours gives a measurement;f
3.31mgil
which represents"o
inü."r.
of 44 per cent(measurement date: September 30, 1969:
Ek,
unpublished)."-In
-
caveis ste-Ann€ (with two cave (May 28, 1982), a measure intheiallery
gaie aooo ppm; 20 minutes after the passageof
1g carbide lamps), asdond
measurementwascarried out and 4g00 ppm wasrecorded (i.e. an increase
of
20 per cent).-In
of
Remouchamps about 20 tourists cave, Mérenne-schoumaker (1975) has observed,with
one of us (Ek), that the presence causes an immediate increase ofs25
mg/rin
thenarrow gaileriË'This
represents a direct increase of theinitial
co,
content of 6 percent.oüngiwhole
day in the tourist season,the increase
CARBON DIOXIDE IN CAYE ATMOSPHERES 183 We consider thus that the
CO,
absorber system is a real necessity for measurements in confined places.In
another
way, the CO, production by
the cavers isdifficult
to
avoid aad we must perhaps deducta CO,
background. The CO, peaks are also partly correlated with a maximum of caving activity during the summer.
Therefore noise reaches a maximum
during
this period. Anotherdifficulty
isthat
theCO,
concentration,increased
by humau
CO,
doesnot rapidly
decreaseto its initial
value(Ek
etal.,
1981).RESULTS
AND
DISCUSSION FOR CAVES
IN
OTHER COT'NTRIES
Carbon dioxide measurements become increasingly numerous under all cümatic conditions. We shall here use the classification of
Troll
and Paffen (1964) who distinguish, beside the Cool-temperate Zones, two seriesof
colderzones-the
Polar and Subpolar Zones and the Cold-temperate BorealZone-and
two series of warmerzones-the
Warm-temperate Subtropical Zones and the Tropical Zone. The ColdClimatic
ZonesIn
the Szàpolar Zone, somef,fty
unpublished analyses by Ek in Labrador (summer 1979), under oceanicsubpolar conditions, displayed very low values
in
soil andin
cracks and fissuresin
dolomite.No
true caves were foundbut,
even uuder a thick soil cover or in deep cracks or just above spring waters, theCO,
contentwas always below 600 ppm.
In
the
Cold-temperateBoreal Zone,
some36
measurementscarried
out
in
SwedishLapland,
under continental boreal conditions, displayed figures never exceeding 850 ppm in fissures and 450 ppm outside the fissures(Figure
Il:
Ek, unpublished); 200 ppm were recorded twice close to an undergroundtorrent
surface: such a low value, well under the mean value of outside atmosphere, is not unusual in cold climates. The meanof all
measurementsin
385ppm (+
o:
150).Around Lake
Mistassini,in
the Canadian boreal forest, about 20 analyses(Ek,
1981) displayed valuesreachingamaximumofl300ppminasmallcave.Themeanvaluesfoundwerell@ppminthesoil,450ppm
in the open air under forest cover 800 ppm in caves and fissures.
It
should be noted that all measuremeuts herereferred
to in cold climatic
zones(Labrador, Lapland
and Lake Mistassini) werecarried out in July
andAugust.
Although
much too scarce, these analyses of the air of cold regions show its paucityin CO,
content. Thisconciusion is strenglhened by the computations of Ford
(1971),liloo
and Marsh (1977), and Roberge (1979), all based on \r/ater analyses in limestone regions, showing that in Canada the cold regions are poor inCO,
andthat the tundra
andthe
alpine meadows arepoorer than the
boreal forest. Concordant conclusions areFIVEB
-..Figure I
l.
Lower Cavc, at Bjortl.idca (Swcdish l-aplaad). Cross-scction at I 6 m from the cave eotraacc. CO, contcnt of the air in ppm (July 26, 1982)o2
184
i}:J#,ii,i*ïîlJtJiffr:l,ilîi;:,,rements
in theair of
castreguard cave,in
rhe canadian RockyThe Cool-temperate Zones
under
oceanic and suboceanic climates, measures are availablein
England, Belgium, and France.
In England'
Atkinson (1975,
lg77) observes valuesrather similar
to
the ones of Belgium:in
GB. ,cave, 33 measurements display^co-ntents averaging4100 ppm
in
g"[.ri.r
à"a
g200 ppmin
the fissureswith,
in thoseplaceq a
maximumof
16000 ppm.This
is concordant with the more than 600 analyses carried out in Belgium, where therange is 300-7000 in the passageways and reaches a
maximum of
9000 in fissures(this
paper).In France' where Renault (1982c) lists two to three thousana
à*tyr"r,
tt.
co,
content is much varyiug and isoften
veryhigh' In
the karstic plateaux ofthe
southe-
t"ra"r.îtheMassif
ô.ro"r,iI"
maximumpco,
reaches 70 000 ppm'
A
co,
contint
of 40 000. to. 50 000;p-
;
r.Jir"otty
reported (Renaurt,1982a). Lower
ranges are cited
in
relation
with
the
morphology
of'Ëaves:"ui",
oi
medium
co,
content
(10000 to30 000
ppm)
are generally longhorizontal
câves;.caves.
of
rowco,
content ( t 000to
r 0 000 ppm) are ofrenhorizontal too'
but more ventilated, and""1?tdjrpl"Iing
acorÉncentration
nearto
the freeair
(300 to1000
ppm)
are oftentwo€ntrance
caves,witn
higÀ*,
"îourutiân
(Reuault,
t9z6).The
co,
distribution
is relatedto
the cave morphology and thecirculation
of theair,
and its evolution is
comelated
with
meteorological parameters,such as
"-Ëru,.rüi"ro-.tri"
pressure, andrainfall
(see,for
example'Renault,1968,l976, 1979,1982a,b,c;Renaüt;ràB;;";;r9gr).Despitedetaileddeveropmenrson
the causes of the high
co,
contents, oo""orlâ
wisha."t;;,iti;lïir".rrrioo
on possible influences of humanËâ:"ü;î"ï.i"§::,',:ïi;;3.""
questionorair-water;;;;il;",
see, roril;;;{oq,,",,
res6, rese,under
continental and subcontinental climates' themeasured values show cousiderable variations as
weil
In
Quebec' Ek (1981), having carried out some 200 aaalysesio
"iir""roos,
obtains a range ofco,
contentgoing
from
440to
I100 ppmin
the galleries and chamberr,rrrr.r"",
thefissures display maximum values
il
sunmer (up to
2800ppm).A
crosed cave dispravshigil;c6;
iiigure
rz). These figures are in accordancewith
the measurementsmade
ia
pàland,in
the silesianupland
(Ek er al., 1969), showing, during-the snow-meltp";oa,or
ii;;d;;
rpirg,r-.,
500to u00
ppmin
passagewaysand a
maximum
of
1370 ppmin
the términal
ûssureoi ,n"
""r...
--C. EK AND M. GEWELTSW
NE
4300 â 2 1 OmFigurc
l2
st'Lconard cavc' Montrcal (Qucbcc,canada).,cross-- scctioa acarby rhc far cad of thc cave.
co,
conænt of thc air in ppm-CARBON DIOXIDE IN CAVE AT}{OSPHERES
In
the caves of Kentucky, 400 to 800 ppm were generally obxrved byMiotke
(1974) in the galleriesduring
the summer; in winter, he uoted 400-600 ppm; the maximum vaiue he observed was about l300 ppm; all these observations were made
in
rather spacious caves.In some caves of Ukraine, values ranging from 500 to 40 000 are noted by Klimchuk et al.(1981); the highest figures are attributed to the abundance of organic matter in the concerned cave, and the possible (although
not
measured) occurrence of CHo, possibly immediately oxydized in COr; the occurrence of gypsum is also noted.
Lewis (1981) has studied a cave under a cultivated area, and frequently invaded by organic matter. The
author
ascribesto
thelatter
fact thehigh CO, content-5000 to
25 000ppm--of
the cave.Few measurements are known to us in the caves of the mowtain climates of the cool-temperate zones.
ln
theSwiss Alps, one
CO,
measurement was done by Forel (1865) in a cave near Saint-Maurice.In
BôdmerenalpCave, above the
Hôlloch
Cave, Bôgli (1970) finds a very poor CO, content (160 ppm), in relation to the high altitude of the cave (1670 m) and the strong wiud outside. In the galleries of the Hôlloch Cave,CO,
contentsare
low-from
250to
400ppm-but,
in
confined places connectedwith
the saturated zone,Bôgli
(1970) measures 1300 ppm, the highest observed valuein
this cave. Gomparable values were also foundduring
the1973-1974
winter (Bôgli,
1975).In the Polish Carpathians,Ek et al. ( 1969) have found in four caves, during the snow-melt, 200
to
I 100 ppm(40
titrations)
and a maximumof
2000ppm in
a fissure.In the low and middle French
§renean
Mountains,pCO,
exceptionally reaches 14000 ppm (Renault andBrunet, 1981). Generally, however, the CO2 content of the air is lower in the mountain caves than in caves
of
lower
altitude (Renault,
1968).The Warm-temperate Subtropical Zones and the Tropical Zone
In Northern Italy,
a cave of theLigurian
coast displayspCO,
values ransingfrom
400to
800ppm;
themaximum
pCO,
(1500ppm) was observedin
a fissure (24 measurements: Gewelt andEk,
1983).In the atmosphere of the caves of Bungonia (New South Wales, Australia), considerable amounts of CO2,
biologically produced, are always present (James, 1977).
In
thenorth of
Madagascar, the seasonal evolution of the carbon dioxide of soil air was studiedby
Rossi (1974). The measured values rangefrom
5000to
32000ppm, thismaximumbeing
observedin the
humic horizou, at the beginning of the rain season. Measurements carried out above that humic horizon, at the baseof
thelitter,
display a lowerCO,
content.CONCLUSION
It
seems clearly established now that theCO,
piesent in caves has generally a predominant organic origin.It
isthus less abundant,
for
instance, undercold
climates.Phenomena such as the climatic variations, the seasonal rhythms, the greater abundauce
in
the fissures connecting the caveswith
the soil, the varied gradients are indeed largely interconnected.\Ye believe
that in
some cas€s, highCO,
contents arepartly
resultingfrom
humaaperturbations. As
a consequeDc€,the
useof
a CO,
absorber systemis
necessary,particularly
in
confi.ned places.In
caves frequently visited by cavers or lourists, the human influences on CO, measurements are difficult to avoid,but
this fact must be taken
into
accountfor
theinterpretation of
the results.Other
acids can dissolve limestonein natural
environments.But
the paramount importanceof CO,
is evident. Limestones, which are so largely biogenic, remain thus after their formation lænnanently involvedin
the biological cycles
of our
planet,of which
theyform
an original and very characterisüc component.Atmosphere and organic reactions are
not
the only origins of the carbon dioxide;CO,
can be produced byinorganic reactions, originate from the depth of the Earth, etc. These origins and their relative importance, as
well as
CO,
variations during the Quaternaryclimatic
changes arestill
a wide-open researchfield.
Stable isotopes and !aC analyses could certainlycontribute
to
this topic.186
C. EK AND M. GEWELT
This work
has been supported bv ResearchË",=-":ttiiilil'",
Fundfor
scientific Research (Bergium). The authors aregratefJ
toptort.,àr;.
;;;,
for his*"rî
"ïr"3re
commenrs.Th.y
wish arsoto
thaukiHi:ît"îîfii#:|i'#ï:H:;à.,i"e
à.ra
*.",,,"*.ni,
uiîLo-i,ique
w,rem io,
i",
herpwith
the REFERTNCESAdams, C. S. and Swinr
atrnsÉnl
rl-cïiriî'".ë""o*
A'c'
t937' 'solubility of limestone', Trans. Am.Geoph. t)nion,pl 2, 504_50E.
.
rimesrooes',,i,ii.n.-r^.'o3Ï*o)!i,iil*"|.ï;;li,W;;"il;#i:'.',i;e:
an imponant*oi-r
org,oundwarerharduess in
Ar*inson, T.
c.
1s77..c."r,u",a^,g_!gï;#;âî;ere
of the unsarurated zon, lrmestones', J
' o{ H vdr.çlegy, ss, r I r
-l
ij.
-*-ovnÊre ot the unsaturated zone: an important contror of groundwater hardness in Atkinson, T. C., Smari, p.r"ï"a wiei*ï.
r.
U ,,
;:F,,,'i,rJïiffi
î1i[iiü,{!''-,x-"':ï::î::;:.ïîïr7,ï;i'î)ïi:::.::
Bôgli, A. 1969. Co.-.Gehalii^a"ïilin q
liinen
Karsruoaen und Hôhlen,. làr_
ïi:i.,ï.,i'T:i',î*:r:#â];'jrr"{ïillrïi.in}ïï;,,î".i:ii;"|
i,:,';,::::;::::;:i:}1lll
l,,,
""':f*Tiril;..iï"'"
voa Lurt uad Kalkgehalte von wàssera im
unrerirdischen Karst,, Z. Geomorph. N. F., suppt.-.d.,26,
*,lft;;*r-"*-ilmïfuî:*t$â#r,,*î#,,3.r,ï,ï:;:",ï,:*U:::::ïï.
*r,,*:**çg-*r,*iffifïü:',-;iri*,..,":x*:fxi:'ï":x::1*
gËig:ffi.f1+[*+]roi**,îft
,r,,:i.,:i:,:,in:
,-,,.,j;jiï:ff*lr.§':?*kî{:i#i}';g,tnr.îi:i
;:;,'a,r:r:i;Jfr:iï;ui'!"x:TJi#*#îi!t:rt:,:,
i,Ét
i#î:::danst'airdesgrottcscomparaisonerÉbcc-Bergi
,",,;;:;::::':;1,ï';ir)îrf,i.rîl;,
-
at.yt1,.e"r',
k;;;;îü'.Zl
l'rll;rTâ.*tctreurensazcârboniquedel'aird'unecavitédueuébecragrortedcsaint-Léonard,ireï#i_H;J1,.":,,:::::::-:_
--ï:,uüon
in the southera Rocky Mouotains and serkinl Mounta ins,, Co,,.r. Earth sci., E,
i!!i#,
i:ff.
;Tfï:'.êl:*"::lle.des
Fg"
ruü.r*;::*u:sc.-aar.
(Lausa",;;;;*'^rEr
luoun*ins" can'r' Earth sci''E
:.ÏËi#jlff+tjpl,Î*ffis*;;g';rll*rrEïi:i:.':*e
Faæ premièresmesures,,Bu,, s.c
New Directions ;'-
i;;;.
GeoBooksrôe;ffiil:
i,i;U*Si;1liîf-e
deux grotres berges: ste-Anne er Briarmonr (rirCI., jn'ît
T'r[î:Tr'
D' w'' Thorstcnsoo' D' c" aad ]vccts, E. p. 1983.'rrcoz ardr.co:
mcasuremenb ou soi
latmosphere,, Radiocarbon,
,#f,ffi,;71î*g,*ire
des sors équaroriaux' Apprication de
ra méthode respirométrique in situ,,
Bur.
rnst. Asron. stat.ffi;sg*
:..::::
CARBON DIOXIDE IN CAVE ATMOSPHER.ES i87
patersoo, K. 1979. 'Field studies of limestone erosion processcs, Oxfordsbire Scarplands, England', Actes Symp. int. Erosion karstiEte, U.,r.S., Aix-en-ProveDc€, Marscille, Nîmes, mém. l, A.F.K:, 87-95.
Renault, P. 1968. 'Sur la distincüon de plusieun régions karstiques en raison de la teneur en anhydride carbonique des atmosphères de
srottes"
c.
R. Acad..sci. Par§ 26? (D), ?288-2290.RJoault, P. 1916. 'l-e gaz carbonique danj les Brorr€s du Quercy', Butt. Comité Départ. Spéléo. Lot-, 2'.94-104' .
i.o"olt,
P. 1979. 'Mesures penodiques de la iCO, dansàes Éottes françaises', Acres Symp. int. Ersion karstique, U./.S., Aix-eu-Provencc, Marscille, Nîmcs, mém. l, A.F.K., 17-33.Renault, P. and Brunet, J. 1981. 'Les variaüons de la p6O, atmosphérique dans les grortes des Pyren&s centrales-grottes de Moulis et de
Niaux (Ariège)', Colloque de §eyssras sur le karst, F.F.S.,5-18.
Renault, P. 1982a.
'k
COz dans làtmosphèrc de quilqucs cavemes du Quercy (Départemeût du Lot-France)' , Spéléo-Dordogne,14, 3- I 15.Renauit, P. 1982b. 'Rôle de la morphologic et du climat d,ns le tra1sfcrt du CO, au niveau de la surfacc aqüfère, 3e Colloque Hydrologie en Pays calcaire, Neuchatet-Bcsançon 1982, Ann. Sc. Unio. Besançon, Géotogie, Mém. 1,281 pp-(5 pp).
Rcnault, P. 1982c. 'CO, atmosphérique karstiquc et speléomorpbologie. Intérêt pour les speléologrres', Reo. belge de Géographie,lM, l2l-130.
Roberge, J. 19'19. Géomorphologie du Karst de Ia Haute Saumons, île d'Anticosti, Qübec, M.Sc. Thesis, Mc Master Univ., Hamilton, 211 pp.
Roques, H. I 956. 'Sur I'existence d'un gradient karsüque des pressions partielles de I'acide carbonique', C. .R. Acad. Sci. Paris,242,3100-3102.
Roques, H. 1959. 'Sur la répartiüoo du CO, dans lcs kants', lnn. Spéléol., 14,9-22.
Roques,H. 1962.'ÀppareillagespourledosagcdcCOrdaaslesmélangesBazrux.§otcdelaboratoire)', laa.Spéléo., l7(3),455-462.
Roques, H. 1963. 'Sur la répartiüon du CO, dans lcs kants (2c mémoirc)', Ann. Spélèo., lE (2), 142-184.
Roques, H. 1964. 'Contribution à l'étude statiquc et cinétiquc des systèmes gaz carboniquc-eau carbonate', Ann. Spéléo., l9(2),
255-4Â,4.
Rossi, G. 1974. 'Sur uoe serie de mesurcs de tcncurs en CO, dc sols tropicaux', Bull. Ass. Géogr. Frary.,415-416' 141-144.
Rossi, G. 1976. 'Karst et dissolution des cakaircs ca miliculropical', Z. Geomorph. N. F., Suppl.-&d.,26,
124-152-Rossi, G. 1979. 'Quelques obscrvations sur lc CO, dans lcs sols tropicaux et leurs cooséqucnc€s possibles sur la dissolutioo des calcaires', Actes Symp. int. Erosion karstique, U./.S., Aix<n-Provcnca, Marseille, Nîmes, mêm. l, A.F.K.,35-39.
Russel, E. J. aad Russcl, E. E. 1950. Soils Conditions orrd Plant Growth,Sth ed., London" 688 pp.
Schoeller, H. 1950. 'Contribution à l'étude statique et cinétique des systèmes gaz carbonique-eau-carbonate', C. R. Acaà. Sci., Parrs, 230,
560-561.
Troll, C. and Paffen, K. H. 1964. 'Karte der JahrcszciænHimaæ dcr Erde', Erdkunde, Ad.,