THÈSE
En vue de l'obtention duDOCTORAT DE L’UNIVERSITÉ DE TOULOUSE
Délivré par l'Université Toulouse III - Paul Sabatier Discipline ou spécialité : Anthropologie génétique
Présentée et soutenue par FORTES LIMA César Augusto
Le 17 Décembre2015
Titre: Tracing the genetic origin of African descendants from South
America
JURY
QUINTANA-MURCI Lluis, Directeur de recherche CNRS COTTIAS Myriam, Directrice de recherche CNRS
CHIARONI Jacques, Professeur GESSAIN Antoine, Professeur CALDERON Rosario, Professeur
DUPUY Francis, Professeur
DUGOUJON Jean-Michel, Directeur de recherche émérite CNRS
Ecole doctorale : Biologie Santé Biotechnologie (BSB)
Unité de recherche : Anthropologie Moléculaire et Imagerie de Synthèse, CNRS - UMR 5288 Directeur(s) de Thèse : DUGOUJON Jean-Michel
AUTEUR : FORTES LIMA, César Augusto
TITRE: Tracing the genetic origin of African descendants from South America.
DIRECTEUR DE THESE : DUGOUJON Jean-Michel
LIEU ET DATE DE SOUTENANCE : Toulouse, 16 Octobre 2015
DISCIPLINE ADMINISTRATIVE : Anthropologie génétique
Laboratoire d'Anthropologie Moléculaire et Imagerie de Synthèse, CNRS- UMR 5288 AMIS. 37 Allées Jules Guesde, Université Paul Sabatier, CP: 31073, Toulouse, Midi-Pyrénées, France.
ACKNOWLEDGEMENTS
First and foremost, I wish to thank Dr. Rosario Calderón for inspiring me to pursue a graduate Master degree in Physical Anthropology, and thanks for encoring me to study human history and population migrations using genetic advances. I also wish to thanks my colleagues at Complutense University of Madrid, Dr. Beatriz Ambrosio, Candela Hernández, and Dr. Antonio Gonzalez, for encouraging me to continue asking questions about genetic population structure and human genetics.
I thank Dr. Eric Crubezy, director of laboratory AMIS UMR 5288 CNRS for supporting my project. I would also like to express my thanks to the long list of fellows, scientists, and administrative personnel from the EUROTAST Marie Curie Initial Training Network (http://eurotast.eu/), who have been involved in or have supported the work included in this thesis in various ways, and have constantly encouraged me to push forward, I am very grateful for everything. A very special thank you goes to: i) Dr. Hannes Schroeder and Dr. Tom Gilbert for helping me in my population genetic research and useful discussions in all EUROTAST meetings, and especially during the Genotyping Workshop carried out in the Centre for Geogenetics in Copenhagen, Denmark; ii) Dr. Jay Haviser and Dr. Corinne L. Hofman for training me in the archaeological field of slavery in the Dutch Caribbean in the St. Eustatius Center for Archaeological Research in St. Eustatius; iii) Dr. Ibrahima Thiaw, Dr. Kodzo Gavua, and Dr. Paul Lane for providing me with the adequate historical context to understand the
transatlantic slave trade, especially during the training journey and symposium dedicated to
explore the legacies, perspectives, and memories of the slave trade on Gorée Island in Dakar, Senegal, and on Elmina and Cape Coast Castles in Ghana; iv) Dr. Luisa Pereira and her group in the Institute of Molecular Pathology and Immunology (or IPATIMUP), Porto, Portugal, for helping me to analyse African mitochondrial DNA genomes during my month-long position as a Visiting Researcher at IPATIMUP; and v) all EUROTAST fellows for their unwavering support during this entire process and for providing me with the framework through which I understood the social and genetic implications of the study of the transatlantic slave trade. I have had several very insightful discussions with all of them, which have contributed in their own ways to the formulation of this thesis, and my development as a population geneticist.
I thank Stephanie Schiavinato and Laure Tonasso for helping me with the Y chromosome STR genotyping, and Dr. Patricia Balaresque for her astute feedback on everything related to the Y chromosome. I thank Dr. Karine Fontaine and stuff at the IntegraGen (Genopole Campus, Evry, France) for performing the Y chromosome SNP genotyping. I thank Dr. Mark Stoneking and Dr. Roland Schröder for performing the high-throughput sequencing of complete mtDNA genomes at the Max Planck Institute for Evolutionary Anthropology, Germany.
I thank Pr. Tomas Axelsson and his staff in the SNP&SEQ Technology platform in Uppsala University, Sweden, for performing the genome-wide SNP genotyping. I thank Dr. Lluis Quintana-Murci and Dr. Etienne Patin for sharing the genome-wide SNP data of Central African populations.
Likewise, I would like to acknowledge hundreds of participants from various populations in South America, West Africa and West Europe, who voluntarily donated their DNA samples and whose genetic data are reported in this study for the first time. I am very grateful to scientific partners for collecting DNA samples, such as Dr. Antonio Salas, Dr. Pedro Moral, Dr. Rosario Calderón, Dr. Luisa Pereira, Dr. Florence Migot Nabias, Dr. Gil Bellis, and Dr. André Chaventré. A very special thank you goes to Dr. Andres Ruiz-Linares and Dr. Gabriel Bedoya for recruiting the Afro-Colombians samples; Dr. Maria Cátira Bortolini and Dr. Rafael Bisso Machado for recruiting the Afro-Brazilians samples; Dr. Antoine Gessain for providing us the first Noir Marron samples; Dr. Jacques Chiaroni, Dr. Stéphane Mazieres, and Dr. Pascal Bailly for helping me to manage DNA samples from the new Noir Marron sampling.
I would also like to extend my gratitude to my dearest family, close friends, and colleagues at the Laboratoire d'Anthropologie Moléculaire et Imagerie de Synthèse of University Paul Sabatier for their patience and guidance during my thesis. A very special thank you goes to Dr. Nicolas Brucato for very insightful discussions regarding to Noir Marron communities and genetic analysis of human diversity.
And last but not least, I thank Dr. Jean-Michel Dugoujon, my advisor on this project, for give the chance to participate in the Marie Curie Network and his unconditional support all these years. He has been extremely patient through my trials and peculiarities, and have provided me with timely and constructive feedback and assessment throughout the length of my doctoral
pursuit.I could not thank him enough for everything.
This work is dedicated to memory of distinguished Professor Georges Larrouy for telling me the unknown history of settlement in the Guianas, region that he has developed from the 1960s until nowadays. I would like to send my warmest acknowledgements to him, for his years of dedication to these populations, and with extraordinary emotion we review the genetic history of people in the Guianas and outside of the Guianas.
Note: None of this work would have been possible without the financial support of the European Commission. This research has received funding from the People Programme (Marie Curie Actions) of the European Union’s Seventh Framework Programme FP7/2007-2013/ under REA grant agreement n° 317184. This material reflects only the author’s views and the Union is not liable for any use that may be made of the information contained therein.
This dissertation is dedicated to my dearest parents, Virginia and Jose, and my best friend, Jaime, whose support and belief in me and helped me successfully complete this project.
a
I N D E X Contents
INDEX ... a
I. INTRODUCTION ... 1
A. Historical background of the Trans-Atlantic Slave Trade ... 1
A.1. Global consequences of the Trans-Atlantic Slave Trade ... 1
A.2. Abolition of the slave trade ... 6
A.3. Historic links between African coastal regions and the New World ... 8
A.4. Historic links between South America and African coastal regions ... 19
B. Formation of the African-American communities ... 29
B.1. Historical, cultural, and social backgrounds of the Noir Marron communities ... 30
B.1.a. Formation of the Saramaka community ... 37
B.1.b. Formation of the Ndjuka community ... 38
B.1.c. Formation of the Aluku community ... 39
B.1.d. Formation of the Paramaka community ... 40
B.2. Formation of the Afro-Brazilian communities ... 40
B.3. Formation of the Afro-Colombian communities ... 42
C. Linguistic influences in the formation of Marron Creole languages ... 44
C.1. Africa’s linguistic diversity ... 44
C.2. English-based Creole’s linguistic diversity ... 46
D. Genetic systems to study ancestry and admixture in the New World ... 51
D.1. Y chromosome genetic system ... 52
D.2. Mitochondrial DNA genetic system ... 56
D.3. Genome-wide SNP data diversity ... 60
D.4. Genetic landscape in the African populations ... 64
D.5. Genetic landscape in the African-American populations ... 67
E. Objectives of present study ... 70
II. MATERIAL AND METHODS ...72
A. Population samples and sampling procedures ... 72
A.1. African-American populations ... 73
A.2. West African populations ... 74
A.3. West European populations ... 75
A.4. Native American populations ... 76
A.5. DNA extraction ... 76
A.6. Datasets elaborated ... 77
B. Y chromosome analysis ... 80
B.1. Genotyping techniques for Y-STRs ... 80
B.2. Genotyping techniques for Y-SNPs ... 83
b
B.3.a. Admixture estimation of paternal ancestry ... 88
B.3.b. Geographic patterns of Y chromosome in Africa ... 89
C. Mitochondrial DNA analysis ... 90
C.1. Sequencing techniques of mtDNA ... 90
C.2. Statistical analysis of mtDNA ... 91
C.2.a. Phylogenetic reconstruction of African mtDNA lineages ... 92
C.2.b. Geographic patterns of mtDNA in Africa ... 93
D. Genome-wide SNP data analysis ... 94
D.1. Genotyping techniques of genome-wide SNP data ... 94
D.2. Statistical analysis of genome-wide SNP data ... 95
D.2.a. Quality control procedure and assembled datasets ... 95
D.2.b. Inbreeding coefficient and runs of homozygosity ... 102
D.2.c. Estimation of admixture events... 103
D.2.d. ADMIXTURE analysis ... 105
D.2.e. Principal component analysis ... 106
III. RESULTS ...108
A. Y chromosome results ... 108
A.1. Y-SNP diversity detected ... 108
A.1.a. Y-SNP diversity in the Noir Marron communities ... 113
A.1.b. Y-SNP diversity in the Afro-Brazilian population ... 114
A.1.c. Y-SNP diversity in the Afro-Colombian population... 114
A.2. Y-STR diversity detected ... 115
A.3. Spatial distribution of the African Y haplogroups... 121
A.4. Origin of African Y chromosome diversity among the African Americans ... 122
B. Mitochondrial DNA results ... 126
B.1. Heteroplasmy calling detected ... 126
B.2. Mitochondrial DNA diversity detected ... 128
B.2.a. MtDNA diversity in the Noir Marron communities... 133
B.2.b. MtDNA diversity in the Afro-Brazilian population ... 134
B.2.c. MtDNA diversity in the Afro-Colombian population ... 135
B.3. Spatial distribution of the African mtDNA haplogroups ... 135
B.4. Origin of African mtDNA diversity among the African Americans ... 146
C. Genome-wide SNP data results ... 148
C.1. Genotyping Quality of genome-wide SNP data ... 148
C.2. Inbreeding coefficient and runs of homozygosity test ... 149
C.3. Admixture models by using the TreeMix analysis ... 150
C.4. Admixture models by using the ADMIXTURE analysis ... 154
c
IV. DISCUSSION ...168
A. Genetic history of the African-American populations in South America ... 168
A.1. Genetic history of the Noir Marron communities ... 169
A.2. Models of sex-biased gene flow in African Americans... 171
B. Genetic African heritage of the slave trade in South America ... 175
B.1. Paternal genetic legacy of the African-American descendants ... 177
B.2. Maternal genetic legacy of the African-American descendants ... 178
B.3. Autosomal genetic legacy of the African-American descendants ... 179
C. Genetic landscape of West African ancestry in African Americans ... 181
V. CONCLUSIONS ...187
VI. BIBLIOGRAPHY ...188
VII. ANNEXE ...224
A. Supplementary material of Y chromosome ... 224
B. Supplementary material of mitochondrial DNA ... 237
C. Supplementary material of genome-wide SNP data ... 254
1
I. INTRODUCTION
A. Historical background of the Trans-Atlantic Slave Trade
A.1. Global consequences of the Trans-Atlantic Slave TradeThe transatlantic slave trade was one of the most extraordinary movements of people in the world history, which persisted for nearly four centuries and resulted in the forced deportation of millions of Africans to the Americas and Caribbean colonies. This historical event ranks as one of the world's worst crimes against humanity. Between around 1500 and the 1860s about 12.5 million African captives were taken from a slaving coast that stretched thousands of miles, from Senegal to Angola, and even round the Cape and on to Mozambique (Figure 1). That means around 30,000 captives a year over three and a half centuries. The captives were enslaved victims of debt, dehydration, and famine; however the largest single source of captives was violence, including warfare, state-sponsored raiding, and kidnapping. As the scale of the Atlantic slave trade grew, the circles of violence in Africa linked to transatlantic slavery intensified and widened. In some Atlantic nations slavery existed as a legal institution and socio-economic system.
Enslaved Africans were loaded on to Atlantic slave vessels; of these, around 11 million survived the transatlantic Middle Passage to reach landfall in the Americas, and many more died in the early years of captivity. Yet until quite recently the full significance of this massive enforced displacement of humanity was largely overlooked by historians. Just a generation ago, the slave trade was considered to be of interest only to maritime historians, or to those studying the histories of Africa or the Americas (Walvin, 2011).
The overriding motive that lay behind the uprooting, enslavement, and coerced long-distance transport of millions of sub-Saharan Africans was the ruthless desire for wealth of European colonizers, to find the cheapest workforce for the production and export of: precious metals, sugar, rum, rice, tobacco, cotton, coffee, indigo, and other luxury goods (Eltis & Richardson, 2010). The magnitude of the slave trade conveys at least a hint of the magnitude of human suffering. By 1820, enslaved Africans constituted around 80% of all the people who had embarked for the Americas since 1500, and mortality on the slave ships averaged at least 15%. Besides, the numerous deaths that occurred as slaves were marched from the African interior to the coast and as they waited to sail, jammed into castle prisons or on board ships (Eltis & Richardson, 2013).
2 Figure 1: Overview of the transatlantic slave routes from African regions to American regions from
1501 to 1866. Red ellipses point out three different regions in South America: Spanish Caribbean Mainland, Dutch Guiana and French Guiana, and Southeast Brazil (Eltis & Richardson, 2010).
The transatlantic trade also represented one of the most important commercial and cultural ventures in the formation of the modern world and a fundamental element in the creation of a socioeconomic world system. In very different ways, the transatlantic trade had an extraordinary impact on the American, African, and European continent. In the Americas the most obvious consequence was demographic growth and economic transformation. Until 1830, between three and four Africans crossed the Atlantic Ocean for every European, making the Americas more a
demographic extension of Africa than of Europe before the 19th century. Areas that had once
been only lightly populated by indigenous peoples became effectively African, they were in fact African settlements on the far side of the Atlantic (Araujo, 2014).
The transatlantic slave trade even affected the landscape in the Americas. For instance, the labour of enslaved Africans converted Caribbean islands into major agricultural-industrial regions, and their skylines dotted with windmills and factory chimneys, as raw sugar cane was transformed into crude sugar. These colonial settlements were connected to Africa and Europe by regular arrival and departure of growing numbers of ships criss-crossing the Atlantic. They
3
arrived in the Americas with Africans and materials for the plantations, and departed with slave-grown produce (Walvin, 2013).
In Europe the consequences were enormous, and indeed the wider world, the rapid development of towns and ports involved in slaving was one visible effect of the trade. Profits from both the ships and the plantations flowed back to Europe to be invested in docks, quaysides, port facilities, and related industries as well as rural retreats for those who prospered. For instance Liverpool, London, and Bristol in Britain; Nantes and Bordeaux in France; Lisbon in Portugal; and Texel in Netherlands, all were transformed by their involvement in the transatlantic slave trade (Walvin, 2011). In respect to European dwellers, the slave-produced sugar, tobacco, coffee, chocolate, and other luxury stimulants not only altered the European diet by the late 1700s, had also helped to shape a costumers mentality among European workers, especially in Britain. For instance, workers became more willing to accept factory discipline in order to afford luxury stimulants, and later factory-produced cotton clothing, made possible by the cotton gin and slave labour (Brion Davis, 1999).
The slave trade was an exceptionally cruel and brutal system, both inhumane and immoral, and victims had always struggled against their fate. However, much of the European nations accepted slavery and the slave trade as legitimate and moral five centuries ago. Europeans also believed that enslaving Africans was legitimate because the institution of slavery already existed in Africa. The sense among Europeans and Americans that the slave system itself was morally flawed and irreligious (indeed that it was unchristian) was a very late development. Every European nation that had an Atlantic coastline (such as Spaniards, Portuguese, Dutch, British, French, Danes, and Swedes) participated in the transportation of slaves from Africa to the Americas during the slave-trade era. Furthermore, ideas of European racial superiority
increased through the slave-trade era. For instance, in the 18th century the British Parliament
passed dozens of Acts that defined Africans as a commodity (Walvin, 2013).
The first enslaved Africans who arrived into the Americas, departed from Europe rather than directly from Africa, and not until the mid-1520s did the first slave ship sail directly from Africa. Besides, African captives may have arrived in the Americas on Columbus’s third voyage in 1498. The slave-trade era is generally considered to have begun un uninterrupted human traffic in 1501, when vessels crossing the Atlantic from Spain begun to carry some African captives for sale in the Greater Antilles (the largest islands of the West Indies); and ended in 1867, when the last slave ship from Africa thought to have disembarked its captives in Cuba (also in Greater Antilles) (Eltis & Richardson, 2010).
4
Indeed, the first enslaved Africans to arrive were probably personal servants, however with the discovery of gold in Hispaniola and the collapse of the Amerindian population in West Indies, the Spanish began to bring slave labour primarily to maintain exports. For the first century of the transatlantic slave trade, the production of precious metals (such as gold and silver) dictated the involvement of the Western Hemisphere in the slave trade. Until the 1590s, the principal source of demand for African captives was precious metals rather than sugar. For the next two centuries, both the size and the range of the transatlantic slave trade expanded dramatically; it was mainly the sugar plantations that created the demand for slave labour. In fact, within the plantation sector, sugar plantations concentrated 80% of the African captives unloaded from the crowed slave ships (Eltis & Richardson, 2010).
Sugar plantations spread widely in the three centuries after they were established in Brazil in the 1560s, and still many plans of sugar plantations have survived. For instance in Cayenne, an
outpost of French sugarcane cultivation in French Guiana in the 18th century, sugar plantations
required major investments in buildings and equipment as well as enslaved African labour (Figure 2). The enslaved Africans, who typically numbered 100–200 or even more, lived in rows of huts (Morgan, 2013).
Figure 2: Plan of a Large Plantation in Cayenne (French Guiana) in 1763. Image titled; "Vue de
l'habitation du Sr. de Préfontaine, située a Cayenne". The image consists of a detailed plan of the Préfontaine’s layout, a very large plantation, which comes with the chapel, storehouse, kitchen, hospital, and sugar mill. The rather sizeable slave village (called ‘cazes des negres) is in the upper right hand corner with its rectangular houses. © John Carter Brown Library at Brown University.
5
Sugar-growing required a large workforce, it was hard and heavy work. Local labour was scarce in the Americas because millions pre-Colombian indigenous people had died after the colonisation of their lands by Europeans. Many were killed in battle, trying to repel the invaders. Other were worked to death, especially in mines. Ultimately, European diseases, such as measles, influenza, cholera, and smallpox wiped out large numbers on indigenous inhabitants. For instance, between 1492 and 1550 the Amerindian population of the West Indies was reduced by 90% owing to massacres. Therefore, European colonist looked to the African continent for a new supply of cheap labour. This resulted in the largest forced migration in human history (Walvin, 2011).
A breakdown of the slave-trade era into three time periods reflects the principal slave-trading nations’ entry into and departure from the trade. In the first period, the Spanish and the Portuguese established the first European empires in the Americas, with large assists from northern Italian capital and maritime expertise, they were pioneered the early slave trade. The Iberian powers dominated the trade, with Portugal and Spain being united in 1580-1640 and, in commercial terms, their separation taking place in 1641. By that time, the Portuguese flag, flew
over much of the transatlantic slave trade until the mid-17th century (Eltis & Richardson, 2010).
A second phase of the trade started around 1642, when the northern European nations established their own colonies in the Americas, and almost immediately began to engage in the trade, joined by traders from mainland North America. The Dutch, French, English, Danes, Swedes, and Brandenburgers (later Prussians), systematically sent vessels to Africa to obtain
captives before 1700. By the early 18th century, the slave trade systems in the North and in the
South Atlantic world were firmly established. The Portuguese flag no longer had much of a presence in the slave traffic to Spanish America and the Caribbean but had come to control the South Atlantic slave trade, which was conducted not from Portugal but from Brazil (Eltis & Richardson, 2010).
The second phase ended in 1808, when British and U.S. anti-slave-trade laws of 1807-1808 took effect and other northern European nations began disengaging from the trade. Disengagement ushered in the third period, which lasted through 1867, and during which abolition and suppression dramatically altered the pattern of participation in the slave trade. With the gradual withdrawal of the northern European powers, the slave trade came to be dominated once more by the Portuguese and the Spanish, operating largely from bases in Brazil and Cuba respectively, and against a background of growing abolitionist and suppression activities (Eltis & Richardson, 2010).
6
A.2. Abolition of the slave trade
The abolition of slavery in the Atlantic world occurred during the 19th century. However, its
origins are generally recognized to be the intellectual ferment of the 18th century Enlightenment,
with the political turmoil of the “Age of Revolution” and the economic transformations associated with the development of modern industrial capitalism (Drescher, 2009). The abolition movement started with small groups of Europeans and North Americans, who began to turn against the entrenched and lucrative business of slave trading, and the maritime nations of Europe and North America, led by Danish and British governments, finally began legislating to ban the slave trade (Walvin, 2011).
Although antislavery ideas circulated much more widely beginning in the 1760s, the first sustained effort to do something about slavery began in the 1780s, particularly with slave rebellions and the British campaign to end the slave trade. The Saint Domingue Revolution was a well-known slave rebellion in the French colony that broke out in 1791 and soon turned into a revolution; leading to the freedom of 500,000 enslaved Africans and to the creation of the Republic of Haiti in 1804. Consequently, the Saint Domingue Revolution closed down the biggest slave market in the Caribbean, and added a new sense of urgency to the issue in France, Great Britain, and the United States (or U.S.). As it did each of the increasingly troubling slave rebellions that erupted elsewhere in the region during this era, which dropped considerably the number of enslaved Africans (Brion Davis, 1999).
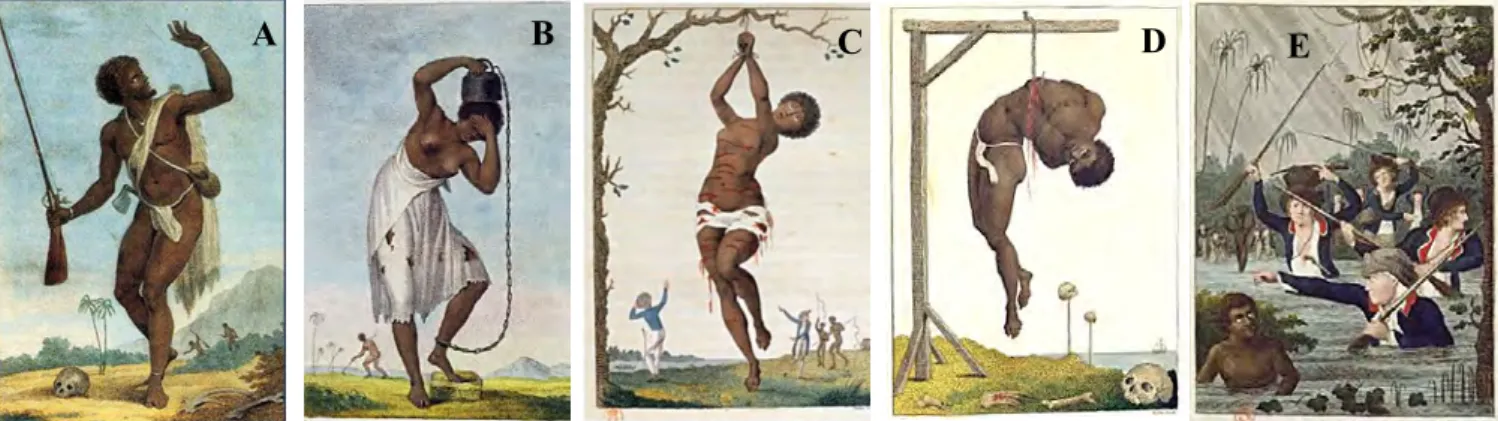
The growing popular awareness of African resistance to their suffering, both on the ships and on the plantations, persuaded more people to support the campaign against the slave system. It was becoming important that Africans hated their bondage and wanted it ended. The abolition movements in Britain, and later in the U.S., employed two powerful political images reproduced everywhere to argue the end of slavery. On the one hand, the famous image of the kneeling slave asking “Am I not a man and a brother?”, or “Am I not a woman and a sister?” (Figure 3A). This image was reproduced by abolitionists after 1787 in many different forms, such as cameos (called ‘Wedgwood cameo’), medallions, and brooches. On the other hand, the other image was of the Brookes slave ship. It was a plan and cross-sections of the slave ship, with enslaved Africans crammed (sardine-like) head to toe, to illustrate the horror of the slave ships (Figure 3B). Both images demonstrate the inhumanity of a system that kept Africans in chains
and subjected to oceanic torment in ships; andboth images have survived to this day as a graphic
portrayal of the slave trade and the campaign against it (Walvin, 2013).
American criticism of the slave trade became widespread in the last years of the 18th century,
mainly because North America no longer needed new captives. The existing slave population was expanding quickly. The U.S. trade was mainly internal and overland, not transatlantic.
7
Other slave societies in the America, notably in Brazil and in the French and Spanish Caribbean, continued to demand slaves from Africa. South America still clung to plantations slavery, and expanded greatly the next century (Walvin, 2011).
A: B:
Figure 3: Representations of Wedgwood cameos (A) and Brooks slave ship diagram (B) published by
the British Society for Effecting the Abolition of the Slave Trade in 1788. © British Museum.
In the first decade of the 19th century, the British and the U.S. governments abolished the slave
trade in 1807, and made efforts to suppress it throughout the Atlantic world. Although, the institutions of slavery itself lived in the British colonies until 1838 and in the United States until 1865. Despite their efforts, over 2.5 million Africans were further transported across the
Atlantic as slaves in the decades of the mid-19th century. Markedly, the British played a large
role in suppression of human traffic, albeit the fight against the slave trade always had a strong international dimension, and many European nations took actions against the slave trade only after signing treaties agreeing to do so. Portugal was the last European nation to abolish the slave trade in 1836 (Walvin, 2011).
Slowly thereafter, slavery would be outlawed in many of the new independent Latin American nations throughout the British Empire in 1833, and thirty years later in the Dutch colonies. In 1820, the Spanish government ended the legal slave trade to Cuba. In 1848, slavery was abolished in the French colonies. Although the law was passed in 1794, the decree was never respected, not even after the French Revolution (1789-1799), and Napoleon Bonaparte restored the practice. Therefore, 54 years later, slavery became effectively illegal in metropolitan France and its colonies (Drescher, 2009).
Slavery was also gradually abolished in the Northern United States, with all Northern states passing emancipation acts between 1777 and 1804. However, for the slave owners of the Southern United States emancipation was still unthinkable. This issue was one of the prime causes of the American Civil War (1861-1865). Not until the 1860s, slavery came to a halt in the entire United States, when the American Civil War ended with the defeat of the Confederate States, and the last 40,000 slaves were freed by the final ratification of the Thirteen Amendment to the Constitution in December 1865. Finally, Brazil took actions for its own traffic in 1831,
8
although an illegal trade continued two decades thereafter, until 1850 when Brazil suppressed its slave trade (Campbell, 2015; Davis, 2006).
The end of the slave trade marked a dramatic turnabout, and the system, which had served the Europeans so well in their settlement and development of key areas of the Americas and brought them such material reward, was rejected. More than that, the West came to view slavery as a
moral aberration. In the 19th century, because of the slave trade became illegal, slave vessels
were subject to capture and condemnation. After passing their own acts of abolition, the British and the Americans embarked on a crusade to persuade, or force, everyone else to follow their example and outlaw the slave trade.
Indeed, Europeans and Americans became fierce enemies of slavery and slave trading, concerned to destroy it wherever they encountered it in Africa, India, and East Asia. Unfortunately, the history of slavery continued to hold nowadays, it is a sobering thought that there are an estimated over 27 million slaves on Earth today (Bales et al., 2009). More than at any point in history, and more than were stolen from Africa during the four centuries of the transatlantic slave trade.
A.3. Historic links between African coastal regions and the New World
Information on the sources of African captives entering the Atlantic slave trading is considerably limited, as is information on the circumstances in which they were enslaved and forced to move to the coast for the voyage to the plantations and mines of the Americas. Many captives came from places much closer to the African coast, and some captives came from several hundred miles inland and took them months to reach the African coast. They were victims of dehydration and famine before arriving at the places of embarkation. However, there is an important lack of records about the African ethnicity of slaves arriving in the Americas. For instance, the largest historical databases, such as the Transatlantic Slave Trade Database (Eltis et al., 1999), details the departure port for the majority of slaves, but not their home town or ethnicity.
Besides, political borders in the African continent were remarkably different during the slave trade era than the current political distribution of African countries. For instance, the explored West African regions by Europeans were called “Negroland” and “Guinea” (Figure 4). The extensive trade in ivory, gold, and slaves made these regions wealthy, with a considerable
number of centralized African kingdoms developing in the 18th and the 19th century. Afterwards,
European traders subdivided the region based on its main exports, such as the Slave Coast, the Gold Coast or the Grain Coast (Lovejoy, 2011).
9 Figure 4: Map of African continent in 1736, and in detail “Negroland” and “Guinea” regions
established by European settlers. That is one of the finest maps of West Africa to appear in the mid-17th century. The coast is highly detailed with numerous notations in Latin regarding the peoples and tribes of the region. © http://www.geographicus.com/.
10
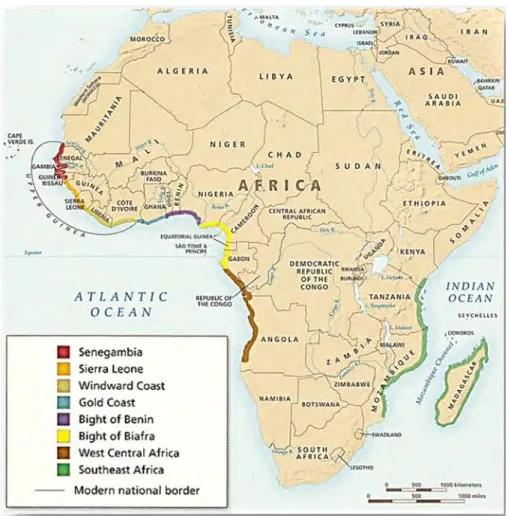
According to historical resources, from 1501 to 1867 enslaved Africans were embarked from eight major historical coastal regions in sub-Saharan Africa (see Figure 5): 5.7% of the captives were form Senegambia, 3.2% from Sierra Leone, 2.7% from Windward Coast, 9.6% from Gold Coast, 16.1% from Bight of Benin, 12.3% from Bight of Biafra, 46.3% from West Central Africa, and 4.1% from Southeast Africa (see Figure 6). Furthermore, the proportions of African captives arrived to the Americas differed remarkably among North, Central and specially South America (Figure 1) (Eltis & Richardson, 2010; Eltis & Richardson, 2013).
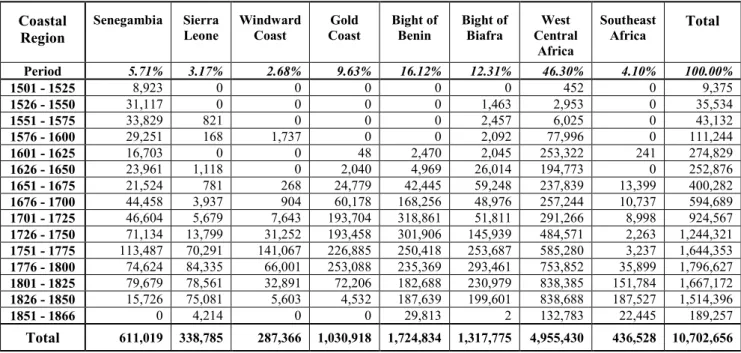
The Table 1 shows the distribution of the estimated number of enslaved Africans embarked on slave vessels in different African coastal regions during the slave-trade era (Voyages Database, 2009). West Central Africa was always the largest regional point for captives throughout most of the slave trade era (Figure 6), and much of the trade there was focused on Angola. As the transatlantic slave trade expanded after 1641; Gold Coast, Bight of Benin, Bight of Biafra, and West Central Africa slaving regions became more prominent than they had been (Figure 6). Ten ports of trade that dotted the African seaboard were embarkation points that collectively supplied almost two-thirds of the captives. All these ports were located south to the Windward Coast included: Anomabu (on the Gold Coast); Ouidah (on the Bight of Benin); Bonny and Old Calabar (on the Bight of Biafra); Luanda, Benguela, Cabinda, Malembo, and Loango (on the West Central Africa); and Quilimane (on the Southeast Africa) (Eltis & Richardson, 2010).
Table 1: Estimated number of enslaved Africans embarked on slave vessels, and leaving major African
coastal regions from 1501 to 1866 (see Figure 6) (Voyages Database, 2009).
Coastal
Region Senegambia Sierra Leone Windward Coast Coast Gold Bight of Benin Bight of Biafra Central West Africa Southeast Africa Total Period 5.71% 3.17% 2.68% 9.63% 16.12% 12.31% 46.30% 4.10% 100.00% 1501 - 1525 8,923 0 0 0 0 0 452 0 9,375 1526 - 1550 31,117 0 0 0 0 1,463 2,953 0 35,534 1551 - 1575 33,829 821 0 0 0 2,457 6,025 0 43,132 1576 - 1600 29,251 168 1,737 0 0 2,092 77,996 0 111,244 1601 - 1625 16,703 0 0 48 2,470 2,045 253,322 241 274,829 1626 - 1650 23,961 1,118 0 2,040 4,969 26,014 194,773 0 252,876 1651 - 1675 21,524 781 268 24,779 42,445 59,248 237,839 13,399 400,282 1676 - 1700 44,458 3,937 904 60,178 168,256 48,976 257,244 10,737 594,689 1701 - 1725 46,604 5,679 7,643 193,704 318,861 51,811 291,266 8,998 924,567 1726 - 1750 71,134 13,799 31,252 193,458 301,906 145,939 484,571 2,263 1,244,321 1751 - 1775 113,487 70,291 141,067 226,885 250,418 253,687 585,280 3,237 1,644,353 1776 - 1800 74,624 84,335 66,001 253,088 235,369 293,461 753,852 35,899 1,796,627 1801 - 1825 79,679 78,561 32,891 72,206 182,688 230,979 838,385 151,784 1,667,172 1826 - 1850 15,726 75,081 5,603 4,532 187,639 199,601 838,688 187,527 1,514,396 1851 - 1866 0 4,214 0 0 29,813 2 132,783 22,445 189,257 Total 611,019 338,785 287,366 1,030,918 1,724,834 1,317,775 4,955,430 436,528 10,702,656
11 Figure 5: Historical African coastal regions from which slaves were carried during the slave trade.
The map shows the limits of the eight major coastal regions in sub-Saharan Africa during the slave trade period and their alignment with modern African nations. ‘Upper Guinea’ is broken down into three sub-regions: Senegambia, Sierra Leone, and Windward Coast (Eltis & Richardson, 2010).
Figure 6: Estimated number of enslaved Africans disembarked on the Americas from 1501 to 1866
12
In the 18th century, slave traders competed intensely with each other on the African coastal
regions (Figure 7). Certain European countries dominated particular regions for a time. The Portuguese flag was usually the one seen in the major ports of West Central Africa region (Luanda and Benguela), and on the southern rivers of the Senegambia region. The English were almost as successful in excluding other nations from the Bight of Biafra region, in what is now southeast Nigeria (Lovejoy, 2011). They managed to carry off 87% of the slaves taken from this region. The French dominated slaving ports just north of the Congo River prior to the outbreak of the Saint Domingue slave rebellion (1791-1804). The Dutch had enclave markets on the Gold Coast region and at Cap Lahou (now Grand Lahou, in Ivory Coast). Moreover, traders from countries on the Baltic Sea (Finland, Sweden, and Denmark) carried off most of the captives taken from the eastern Gold Coast, the area around Fort Christiansborg (now Osu Castle, in Ghana) (Eltis & Richardson, 2010).
Senegambia, Sierra Leone, and Windward Coast slaving regions are commonly grouped into ‘Upper Guinea’ region (Figure 5), together these regions represent around 11.6% of the embarked enslaved Africans (see Table 1). Upper Guinea was a large area that currently includes the modern countries of Senegal, Gambia, Guinea-Bissau, Sierra Leone, Liberia and part of Ivory Coast. Senegambia slaving region includes modern Senegal, Gambia, and part of Guinea-Bissau, as well as counting offshore islands. While Sierra Leone slaving region stretched from Guinea-Bissau to west of Cape Mount (in modern western Liberia). This region includes modern Guinea, part of Guinea-Bissau, Sierra Leone, and western Liberia. Lastly, Windward Coast slaving region (also called as the Grain Coast) stretched from east of Cape Mount to Grand Lahou (in modern Ivory Coast). This region includes modern Liberia and Ivory Coast (Eltis & Richardson, 2010).
Upper Guinea was the first part of Africa to be pulled into the transatlantic slave trade, and
enslaved Africans went initially to Europe. In the 16th century, the Portuguese gathered slaves
from many parts of Upper Guinea to Cape Verde Islands. Uninhabited prior to 1460, the Cape Verde Islands were firstly settled by the Portuguese with the specific aim of establishing a staging post for slave ships travelling between Africa, Europe, and the Americas. The prominence of these islands lay in their strategic location at the crossroads of shipping routes. Enslaved Africans were used here as agricultural labour to produce food to sustain the small colony of European settlers and passing ships. Therefore, slavery lies at the very early origins of Cape Verde society (Lane & MacDonald, 2011).
13
Figure 7: Maps of slaves African
coastal regions during the three phases of the slave trade:
1st phase from 1501 to 1641; 2nd phase from 1642 to 1807; 3rd phase from 1808 to 1867. The blue line in the three maps represents the average of the midpoint latitudes of each African coastal region weighted according to the volume of slave departures from each region (Eltis & Richardson, 2010).
14
The slave traffic from Upper Guinea grew after 1642 (Figure 7), largely because of the entry of English and French companies into the slave trade between 1660 and 1700. The English concentrated on the Gambia River, and the French on the Senegal River. Shipments of captives from Upper Guinea reached their historic peak in 1750-1780, when the Portuguese chartered companies to expand the area where enslaved Africans were transported to Brazil. Finally, the withdrawal of the British, the French, and the Dutch from slaving accelerated a general decline in transatlantic trafficking from Upper Guinea between the 1780s and the late 1820s, with the exception of Galinhas in Guinea-Bissau that continued to be a source of slaves until 1856 (Eltis & Richardson, 2010).
During the slave trade period, Europeans built castles, forts, and trading factories on some parts of the African coast to facilitate trade and confront invasions. For instance, Saint-Louis, established by the French in 1659, was a fortified trading fort commanding the entrance to the Senegal River in Senegambia. Embarkations of enslaved Africans from the fort began in the 1680s and continued through the 1820s. The French were the main carriers, and most African captives went to French America, in French Guiana and especially in St. Domingue (called Haiti after 1804) (Eltis & Richardson, 2010).
The island of Gorée (Figure 8A), which lies 3.5 Km off the coast of Senegal opposite Dakar,
was the largest slave-trading centre on the Senegambia from the 15th to the 19th century. Ruled
in succession by the Portuguese, Dutch, English, and French; the island was used as a ‘slave warehouse’ consisting of over a dozen slave houses, and each house contained between 150 and 200 enslaved Africans from different locations in Upper Guinea. For instance, the ‘House of Slaves’ (Figure 8B), which was built in 1776 by the Dutch, is currently the last surviving slave house in Gorée (Thiaw, 2010). Each cells of 2.60 square meters were reserved for different sex, and contained up to 15 or 20 people seated with their backs against the wall, and chained around the neck and arms. In the middle of that chain, there was a big iron ball that the captive had to carry between his two hands and two legs, which were released only once a day to satisfy their needs. The extremely poor hygienic conditions were so sickening that the first pest epidemic in the island was originated in that house in 1779 (Thiaw, 2011). Today, the island serves as a reminder of human exploitation, and as a sanctuary for reconciliation (Figure 8C).
Both the Gold Coast and the Bight of Benin were key regions in West Africa for slave traffic
in the late 17th and most of the 18th century (Figure 7). Both regions supplied more than
2,750,000 of the enslaved Africans, which means more than 25.75% of the enslaved Africans embarked during the slave trade (Table 1). Ports such as Ouidah, Elmina Castle, Cape Coast, and later Lagos were among the very largest sources of captives anywhere on the West Africa coast (Eltis & Richardson, 2013).
15
Figure 8: The island of Gorée in Senegal. A: Historical museum of Gorée (‘Fort d’Estrées’), B: Cell
in the Slave House (‘Maison des Esclaves’) with a tiny window, and C: Statue of freed slaves ('La statue de la libération de l'esclavage'). Today the whole island was recognized by UNESCO as World Heritage Sites in 1978. © 2014 Cesar A. Fortes Lima.
The Gold Coast slaving region stretched along 400 miles (643.7 Km) coastline, from east of Axim (in Southwester Ghana) to the Volta River (Figure 5); and most of this region is in modern Ghana. European built most of their trading forts along this coastline, several of which remain today as important historic sites. For instance, Elmina Castle (Figure 9A), which was built in Ghana by the Portuguese in 1482 and captured by the Dutch in 1637, became the headquarters of Dutch trading activity on the Gold Coast. The principal destination of captives leaving
Elmina shifted to Dutch Guiana and Dutch West Indies during the 18th century. Moreover, Cape
Coast Castle (Figure 9B), which was built in what is now called Ghana, by the Swedes in 1653 and was seized by the British in 1664, was the headquarters of English monopoly on slave trading in West Africa. Enslaved Africans taken from Cape Coast Castle often went to Barbados and Jamaica (Eltis & Richardson, 2010).
Figure 9: Elmina Castle (A) and Cape Coast Castle (B) in Gold Coast region (modern Ghana) remain
today as important historic sites, andare the Ghana’s major historic attractions for tourists. Both castles
are used as an exceptional testimony to one of the greatest tragedies in the history of human societies, and were recognized by UNESCO as World Heritage Sites in 1979. © 2014 Cesar A. Fortes Lima.
A
B C
16
The Bight of Benin slaving region (also known as the Slave Coast) stretched along roughly 500 miles (804.6 Km) across the Gulf of Guinea, from near the mouth of the Volta River (Cape Saint Paul) in eastward Ghana to the Nun River, an extension of Niger River in Nigeria (Figure 5). Today this coastline is part of east Ghana, Togo, Benin, and western Nigeria. The Bight of Benin received its name from the centuries-old kingdom of Benin located in southern Nigeria (now Benin City). This is a rich region in culture and history (Law, 2004; Toyin & Childs, 2004). Prior to European colonization, major African kingdoms existed in this area, including: the Asante (from 1750 to late 1800s) in modern Ghana; Fon (during 1700s) and Dahomey kingdoms (during 1800s) in modern Togo and Benin; and the Yoruba (from 1000s to 1800s) and Benin (from 1200s to 1897) kingdoms in what is now Benin and southern Nigeria (Law, 2004; Lovejoy, 2013).
Ouidah (or Whidah, in modern Benin) on the Bight of Benin was the largest single
embarkation point for captives shipped from West Africa by the end of the 17th century. Its
emergence as a slave port dates from the late 17th century. The Kingdom of Dahomey conquered
it in 1725-1727, and ruled it until the late 19th century. For the vessels leaving Ouidah, the Dutch
and British Caribbean were the chief destinations, as well as the Dutch Guiana (Law, 2004). This historic site (also known as Route de l'Esclave) was added to the UNESCO World Heritage Tentative List in 1996.
The Bight of Biafra slaving region stretched around 370 miles (595.5 Km), from the Nun River to Cap Lopez, at the southern end of the Gulf of Guinea (Figure 5). Today this coastline belongs to modern eastern Nigeria, Cameroon, Equatorial Guinea, and northern Gabon. This slaving region also includes Bimbia Island (Cameroon) and the Gulf of Guinea islands: Príncipe, São Tomé, and Bioko. This slaving region emerged as other major source of slaves in the 1660s (Table 1). The slave traffic was largely centred on New Calabar, Bonny, and Old Calabar port (all of them in modern Nigeria). Together, those ports sent out more captives than the rest of this region combined. The majority of the captives were speakers of Igbo dialects from the multi-ethnic Niger Delta region. The gulf islands, São Tomé and Princes Islands, were also important; most of its slaves were obtained hundreds of miles south, in West Central Africa rather than the adjacent mainland. Cameroon was the smallest of the embarkation points in the Bight of Biafra, and the last to engage in the slave trade. Apart from a single voyage recorded in 1658, departures did not begin until the 1760s (Eltis & Richardson, 2010).
The West Central Africa slaving region ranged from Cap Lopez to the southern tip of Angola, which does not match with the West-Central African geographic region. The southernmost slaving port in Atlantic Africa includes modern part of Gabon, the Republic of Congo, the Democratic Republic of Congo, and Angola (Figure 5). Almost all the slaves from West Central
17
Africa left from ports located in modern Angola and the Democratic Republic of the Congo. The first vessels sailing for the Americas left from the Congo River region, however a decade after the founding of Luanda (in modern Angola), the new settlement come to monopolize slave traffic from this region. Luanda was established by the Portuguese in 1575, and in most years after 1620 supplied more African captives to the Americas than any other location in sub-Saharan Africa (Eltis & Richardson, 2010). Although Luanda was the principal slave port, Benguela (also in modern Angola) emerged as a major port south of the Congo River, and remained as a key embarkation point for captives from the 1720s; beating even Luanda in the 1840s. Two-thirds of the captives that embarked in Benguela (that means around 491,000 enslaved Africans) had been disembarked in Rio de Janeiro. The Portuguese, who had a continuous political presence in both Luanda and Benguela, drew many of their captives from marauding trading chiefs whose main source of enslaved Africans were Ovimbundu and Mbundu people. The Bantu-speaking Lunda Empire, in east of Luanda, was also participating to supply large number of enslaved Africans to major slaving ports in West Central Africa. Many enslaved Africans, who came from West Central Africa, were mostly called ‘Congos’ in the Americas; however they were in fact drawn from a wide range of ethnolinguistic groups (Eltis & Richardson, 2013).
Lastly, the Southeast Africa slaving region was the slave-trading region farthest away from the Americas. Consequently, more captives died on large voyages from that region than from anywhere else. The Southeast Africa stretched along the East Africa’s coastline and included the islands of Madagascar and Zanzibar (Figure 5). This part of Africa provided enslaved Africans to the Indian Ocean and Arabian markets for many centuries. After 1781, slave departures to the Americas grew rapidly. The centre of the slave trade in this region was Mozambique, particularly in embarkation points such as Mozambique Island, Quilimane, and Lourenço Marques (now Maputo). By the 1830s, this region had become the largest supplier of slaves to the Americas after West Central Africa (Figure 7); probably owing to the expansion of plantations in Brazil and British-led efforts to suppress slaving activities north of the Ecuador. In this region, African captives were mostly Yao and Makua peoples (Eltis & Richardson, 2013).
Traditionally, historians have described the transatlantic slave traffic as dominated by males and adults. Adults were usually defined as those older than thirteen or fourteen years old or taller than four feet four inches (~1.33 m). Historians have attributed high ratios of males to females to the plantation owners’ demand for strong labourers (Eltis & Richardson, 2013). Today, it is possible to measure variations in the gender and age of distribution of enslaved Africans transported across the African coastal regions (Figure 10). Modern research shows
18
that, in comparison to other long-distance migrations before 1800, the numbers of females and children in the trade were extremely high, and that important differences among African regions cannot be explained by the demands of buyers in the Americas (Morgan, 2013).
Figure 10: Map of gender and age of slaves carried from African regions to the New World from 1545
to 1864 (Eltis & Richardson, 2010).
Given the gender and age of slaves embarked on slave vessels in different African regions (Figure 10), three important patterns emerged: i) the male percentage of captives leaving the Bight of Biafra region was always lower than the female percentage of captives leaving other coastal regions; ii) adult-to-child ratios varied enormously across African coastal regions (approximately 26% of all slaves carried out to the Americas were children); and iii) over time, the proportion of males carried off from Africa increased as did the proportion of children, and strikingly appears across all African slaving regions at about the same time (Eltis & Richardson, 2010).
19
A.4. Historic links between South America and African coastal regions
The transatlantic slave trade changed dramatically the demography of Africa and also the New World. South America (43.1%) and the Caribbean (51.9%) accounted for 95% of the disembarked enslaved Africans in the Americas; and fewer than 4% disembarked in what became the United States (Figure 1). Only a very small percentage of slaves disembarked in Africa, after their ships were diverted because of slaves on-board rebelled. However, around two million enslaved Africans died during the Middle Passage (Eltis & Richardson, 2010). Indeed, the Middle Passage was one of the most dreadful and traumatic experience for African captives. They were herded naked onto small overcrowded vessels, and dispatched to far-off lands from which no return was possible (Eltis & Richardson, 2013).
To highlight the extent of this movement, the Table 2 shows the estimated number of enslaved Africans arriving at the main Spanish, French, Dutch, and Portuguese colonies in South America in different numbers and at different periods of the slave trade. This historic data was obtained from 4,349 well-documented slave vessels, which embarked over 1,640,000 enslaved Africans from 1549 to 1856 (Voyages Database, 2009). In general, slave vessels that completed the longest passages experienced also the highest shipboard mortality. Hence, slave vessels arrived to Cartagena present the highest mortality percentage during voyage (23.1%), than vessels arrived to Guiana (16.3%) or Southeast Brazil (8.8%) (Table 2). The male percentage (71.2%) and the percentage of adults (94.4%) were higher in Rio de Janeiro than other regions in South America (Table 2). This fact points out the high demands of labour workers in plantations and mines in Brazilian. In the Spanish American mainland, the 85% of the enslaved Africans arrived from 1576 to 1650, which is remarkably earlier than in French and Dutch Guiana, and in Southeast Brazil. Because of the Spanish Crown had forbidden the enslavement
of Amerindians at the beginning of the 17th century; and at that time the enslavement of Africans
enabled a rapid develop of Cartagena (Navarrete, 2011). Later, the slave traffic with African regions ended up in Cartagena in 1788, which is also remarkably earlier than in other slave regions in South America (Table 2).
From 1604 to 1815 about 400,000 enslaved Africans arrived to work in plantations in Guiana region, between Brazil and Venezuela, mainly ruled for Dutch settlers, but also for English, French and Portuguese, and Jewish settlers (Eltis & Richardson, 2010). On the one hand, Surinam (known now as the Republic of Suriname), was the foremost settlement for the Dutch in Guiana, and the centre of: i) the rapid growth of sugar cultivation before 1770, and ii) the inflows of African labour needed to sustain it. There are estimated around 295,000 captives that arrived in Surinam (Figure 11A), albeit there are only 221,430 documented disembarkations (Table 3). The principal sources of enslaved Africans were West Central Africa (30.4%), Gold
20
Coast (23.2%), and Bight of Benin (16.0%) (Figure 12A); and there are not any historic records from Southeast Africa (Voyages Database, 2009). Elmina Castel in Gold Coast was the main port with 11.4% of the captives (that means 25,147 enslaved Africans) (Table 3). On the other hand, French Guiana supported a modest and erratic inflow of African captives in its main port, Cayenne, now capital city. African captives arriving in Cayenne came from most African coastal regions, with the exception of Gold Coast (see Figure 11B) (Eltis & Richardson, 2010). Interestingly, the contribution of different African coastal regions was homogeneous and with similar periodicity, mainly with Senegambia (26.7%), Bight of Benin (22.5%), Bight of Biafra (19.2%), and West Central Africa (22.5%) (Figure 12B). Ouidah in Bight of Benin was the most prominent outfitting port with 13.2% of the captives, and Saint Louis in Senegambia was another important port with 9.4% of the captives (Table 3).
Table 2: Estimated number of embarked (Emb.) and disembarked (Dis.) enslaved Africans arriving at
main Spanish, Dutch, French, and Portuguese ports in South America from 1549 to 1866. There are also indicated: the total of voyages; the percentage of slaves embarked who died during the Middle Passage; the percentage of male and female enslaved Africans; and the percentage of children and adults (Voyages Database, 2009).
Region Spanish America Dutch Guiana French Guiana Southeast Brazil Main port Cartagena Surinam Cayenne Rio de Janeiro
Period Emb. Dis. Emb. Dis. Emb. Dis. Emb. Dis.
1549 to 1550 224 166 - - - - 1551 to 1575 756 594 - - - - 1576 to 1600 44,646 32,058 - - - - 334 287 1601 to 1625 56,820 40,364 - - - - 1626 to 1650 25,546 18,212 - - - - 1651 to 1675 5,470 4,276 8,398 6,546 1,327 1,000 382 331 1676 to 1700 6,990 5,511 23,496 20,274 1,283 973 3,231 2,831 1701 to 1725 7,969 6,104 23,467 19,738 1,634 1,286 29,537 26,090 1726 to 1750 - - 58,059 49,420 2,651 2,365 96,229 84,440 1751 to 1775 422 344 90,971 80,987 4,219 3,250 69,081 62,853 1776 to 1800 379 284 26,582 23,031 5,997 5,268 136,439 125,429 1801 to 1825 - - 23,893 21,434 5,495 4,828 547,828 493,470 1826 to 1850 - - - - 2,014 1,706 332,635 303,818 1851 to 1856 - - - 1,217 1,021 Total 149,222 107,913 254,866 221,430 24,620 20,676 1,216,913 1,100,570 Total of voyages 598 765 100 2,886
% died during voyage 23.10 14.30 18.20 8.80
% male / female 66.70 33.30 60.60 39.40 51.00 49.00 71.20 28.80 % children / adults 14.80 85.20 18.60 81.40 31.50 68.50 5.60 94.40
21
In the Portuguese colony of Brazil, the organization slave vessels’ voyages was initially
cantered on Lisbon, however in the latter 16th century migrated to Brazil, which emerged as the
principal centre in the Portuguese-speaking world for the dispatch of slaving voyages from Africa (Klein, 2002). African enslaved people increased and became the primary source of enforced labour, especially after the most severe outbreak of smallpox in Brazil (1665-1666)
(Childs, 2007). As Brazil became Europe’s leading source of sugar in the late 17th century, also
Recife, Salvador de Bahia, and Rio de Janeiro emerged as the leading markets in the Americas for slaves brought directly from Africa (Figure 13A). These centres generated large demands for slave labour within the hinterland of major ports such as Rio de Janeiro, and also generated some of the trade goods dispatched to Africa to purchase slaves. These three major ports were also transit points for captive labourers sold on to the gold producing regions of Minas Gerais and Goiás (Campbell, 2015). After 1760, transatlantic slave vessels were addressed to the Amazonian ports of Pará and Maranhão (Figure 13B), in response to the rapid growth of demand for cotton in North Brazil (Eltis & Richardson, 2010).
Rio de Janeiro was the most active and important slaving port in Southeast Brazil (Figure 14), and also was the home port for the slaves vessels that brought African captives to this region (Eltis & Richardson, 2010). West Central Africa was the major source of slaves for all the Americas, and in South America it was particularly dominant. In Rio de Janeiro, 83.7% of the disembarked enslaved Africans came from West Central Africa region (Figure 15 and 16). They were brought to Rio de Janeiro mainly originated from two important regions in Portuguese Angola: Luanda (42.3%) and Benguela (18.1%) (Table 4). Both major regions are populated by very distinct African ethnolinguistic groups, and are inhabited by speakers of languages belonging most of them to the Niger-Congo linguistic subphylum. This subphylum comprises the largest Bantu branch and includes about 500 languages, which are spoken in virtually all of Central, East, and South Africa, except for the areas occupied by the Khoisan-speaking groups (Paul et al., 2015). Therefore, African captives of Bantu origin from South of the Congo and Angola were overwhelmingly forced to move to Brazil during the slave era (see Figure 15).
22 A:
B:
Figure 11: Map of African coastal origins of slaves carried to Dutch Guiana (A) and French Guiana
(B) from 1526 to 1867. The boundaries of historical African political units and ethnolinguistic groups are shown along the African coastal regions (Eltis & Richardson, 2010).
23 A:
B:
Figure 12: Estimated number of enslaved Africans disembarked on Surinam (A) and Cayenne (B),
leaving African coastal regions from 1549 to 1856. There are no records of enslaved Africans arriving from Southeast Africa to Surinam, or form Gold Coast to Cayenne (Voyages Database, 2009).
Table 3: Estimated number and percentage of: 221,430 enslaved Africans disembarked on the Dutch
port of Surinam in Dutch Guiana; and 20,676 enslaved Africans disembarked on the French port of Cayenne in French Guiana, from major African ports from 1664 to 1825 (Voyages Database, 2009).
Surinam Senegambia Gold Coast Bight of Benin Bight of Biafra West Central Africa Period / Port Saint-Louis Elmina Ouidah Bonny Calabar Malembo Loango
1664 - 1675 243 391 1,457 1676 - 1700 1,406 730 424 1701 - 1725 1,032 11,720 455 1726 - 1750 10,985 1,029 802 1751 - 1775 5,495 690 9,275 589 1776 - 1800 100 7,635 343 644 349 1801 - 1825 1,462 2,385 Total 100 25,147 12,410 1,805 4,678 11,425 4,076 Percentage 0.05% 11.36% 5.60% 0.82% 2.11% 5.16% 1.84%
Cayenne Senegambia Bight of Benin Bight of Biafra West Central Africa Period / Port Saint-Louis Ouidah Bonny Loango Portuguese port
1676 - 1700 322 241 1701 - 1725 436 125 1726 - 1750 887 286 1751 - 1775 233 816 1776 - 1800 916 932 328 1,204 1801 - 1825 708 540 580 Total 1,946 2,729 993 580 2,306 Percentage 9.41% 13.20% 4.80% 2.81% 11.15%
24
Furthermore, Rio de Janeiro, with over one million disembarked African captives (Figure 15), was the Atlantic Ocean’s largest single outfitting port for slave ships, as well as the single most important disembarkation point in the Americas. So slave trading played a vital role in the growth of the city’s wealth and population, allowing its merchants and city leaders to invest in the public spaces and buildings (Morgan, 2013). Most enslaved Africans entering the port were
sold on to work in sugar, coffee, and, especially in the 18th century, gold production in Minas
Figure 13: Maps of estimated
number of enslaved Africans arriving in Brazil: from 1561 to 1695 (A), and from 1696 to 1790 (B) (Eltis & Richardson, 2010).
25
Gerais and other provinces. Some of them remained in Rio de Janeiro itself, providing labour for urban crafts, household, and other services (Morgan, 2013). Throughout the Americas, enslaved Africans were used not only to produce sugar, coffee, gold, tobacco, cotton, and other goods for market, also to work as servants of European colonizer to display their owners’ status, which means they were both, producers and symbols of their owners’ wealth (Araujo, 2015).
Figure 14: Maps of estimated number of African enslaved arriving in Brazil from 1791 to 1856. In the
19th century, more African captives arrived in Brazil than in any other colony or country to supply the labour needs of sugar and coffee plantations, especially in Rio de Janeiro (Eltis & Richardson, 2010).
26 Figure 15: Map of African coastal origins of slaves carried to Rio de Janeiro (in Southeast Brazil)
during the third phase of the transatlantic slave trade from 1808 to 1856. In the 1830s, British suppression and anti-slave trade are represented in part on the map by the return loops of Africans liberated from slave vessels and taken to Sierra Leone and St. Helena. The boundaries of historical African political units and ethnolinguistic groups are shown along the African coastal regions (Eltis & Richardson, 2010).
Figure 16: Estimated number of enslaved Africans disembarked on Rio de Janeiro from 1549 to 1856
leaving historical African coastal regions. There are no records of enslaved Africans arriving from Sierra Leone and Windward Coast to Rio de Janeiro (Voyages Database, 2009).
27
Increasing demand for coffee and sugar beginning in the 18th century sustained the Brazilian
slave trade close to peak levels until the mid-18th century. In the late 1820s, more enslaved
Africans were imported into Rio de Janeiro than into any other port in the history of the slave trade (Eltis & Richardson, 2010). After 1820, slave vessels addressed to Rio de Janeiro obtained enslaved Africans from more remote parts of the West Central African coast, instead of the traditional centres of Luanda and Benguela, also drew heavily from Mozambique in Southeast Africa (Table 4). Therefore, Southeast Africa region became an important source of captives, where around 13.5% African captives were taken and forced to move to Rio de Janeiro (Figure 16); so this region should be taken into consideration to trace the African origin of current African descendants from Rio de Janeiro.
Table 4: Estimated number and percentage of 1,100,570 enslaved Africans disembarked on the
Brazilian port of Rio de Janeiro in Brazil from major African ports from 1676 to 1856 (Voyages Database, 2009).
Rio de Janeiro Bight of Benin Bight of Biafra West Central Africa Southeast Africa Period / Port Ouidah Bonny Benguela Luanda Mozambique Quilimane
1597 - 1600 1651 - 1675 1676 - 1700 105 2,726 1701 - 1725 926 105 19,846 1726 - 1750 3,000 79,413 1751 - 1775 1,070 7,711 49,459 431 1776 - 1800 230 39,154 84,581 1,278 186 1801 - 1825 139 734 106,640 165,996 45,675 26,699 1826 - 1850 335 41,843 63,037 25,856 23,884 1851 - 1856 563 Total 2,700 734 199,121 465,058 73,240 50,769 Percentage 0.25% 0.07% 18.09% 42.26% 6.65% 4.61%
In the Spanish American mainland, after the conquest of the Azteca and Inca Empires in the
16th century, the Spanish consolidated an empire that comprised most of the Latin America.
Enslaved Africans entered this empire mainly through Cartagena in Colombia (with around 196,000 captives), and through Veracruz in Mexico (with around 83,000 captives) (Figure 17).
African slavery in Colombia began in the first decade of the 16th century, and by the 1520s,
Africans captives were being imported steadily into Colombia to replace the rapidly declining Native American population. Cartagena was designated as an official port of the Spanish fleet system as early as 1537, and became by far the largest single slaving disembarkation port in the Spanish Americas (Almeida, 2008). Enslaved Africans arrived mainly from West Central Africa (45.2%) and Senegambia (38.9%) regions (Figure 18). In West Central Africa, Luanda was largely the first port were Africans were enslaved (around 25.4%), while Portuguese Guinea was the key port in Senegambia (18.3%) (Table 5).
28
They were forced to work in gold mines, sugar cane plantations, cattle ranches, and large haciendas (landed estates owned by colonists). Indeed, African labour was essential in different regions of Colombia, For instance, African workers were pioneered in the extracting of alluvial gold deposits and the growing of sugar cane in the states of Chocó, Antioquia, Cauca, Valle del Cauca, and Nariño in Western Colombia. However, with the arrival of numerous slaves to staff lowland mines and highland haciendas, the frequency of rebellions increased (Navarrete, 2012).
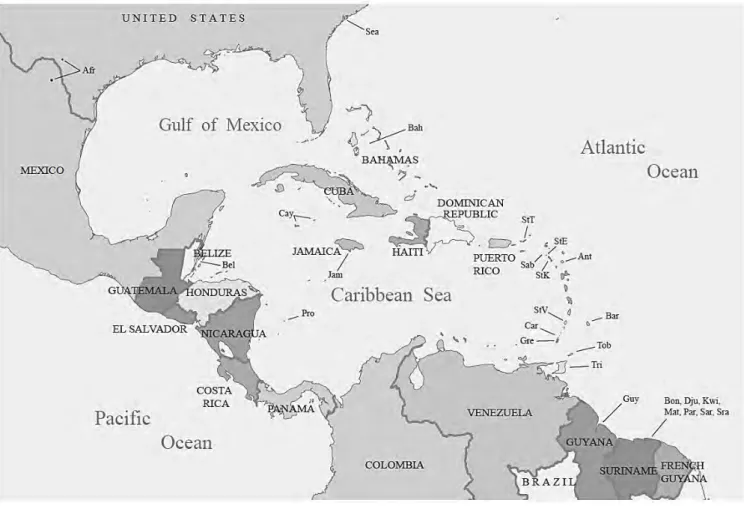
Figure 17: Map of African coastal origins of slaves carried to Cartagena (in Colombia) during the
Spanish transatlantic slave trade from 1501 to 1641 (Eltis & Richardson, 2010).
Figure 18: Estimated number of enslaved Africans disembarked on Cartagena (from 1549 to 1856),
leaving African coastal regions. There are no records of enslaved Africans arriving from Sierra Leone, Windward Coast, and Southeast Africa to Cartagena (Voyages Database, 2009).