Characterizing the Life Cycle of Online News Stories
Using Social Media Reactions
Carlos Castillo
Qatar Computing
Research Institute
Doha, Qatar
chato@acm.org
Mohammed El-Haddad
Al Jazeera
Doha, Qatar
mohammed.haddad
@aljazeera.net
J ¨urgen Pfeffer
Carnegie Mellon University
Pittsburgh, USA
jpfeffer@cs.cmu.edu
Matt Stempeck
MIT Center for Civic Media
Cambridge, USA
stempeck@media.mit.edu
ABSTRACTThis paper presents a study of the life cycle of news ar-ticles posted online. We describe the interplay between website visitation patterns and social media reactions to news content. We show that we can use this hybrid observation method to characterize distinct classes of ar-ticles. We also find that social media reactions can help predict future visitation patterns early and accurately. We validate our methods using qualitative analysis as well as quantitative analysis on data from a large inter-national news network, for a set of articles generating more than 3,000,000 visits and 200,000 social media re-actions. We show that it is possible to model accurately the overall traffic articles will ultimately receive by ob-serving the first ten to twenty minutes of social media reactions. Achieving the same prediction accuracy with visits alone would require to wait for three hours of data. We also describe significant improvements on the accu-racy of the early prediction of shelf-life for news stories. ACM Classification Keywords
H.4.m Information Systems Applications: Miscella-neous;
Author Keywords
Web analytics; predictive web analytics; online news 1. INTRODUCTION
Traditional newspapers have been in decline in recent years in terms of readership and revenue; in comparison, digital online news have been steadily increasing accord-ing to both metrics.1
1
http://stateofthemedia.org/2012/overview-4/key-findings/
Permission to make digital or hard copies of all or part of this work for personal or classroom use is granted without fee provided that copies are not made or distributed for profit or commercial advan-tage and that copies bear this notice and the full citation on the first page. Copyrights for components of this work owned by others than the author(s) must be honored. Abstracting with credit is permitted. To copy otherwise, or republish, to post on servers or to redistribute to lists, requires prior specific permission and/or a fee. Request per-missions from perper-missions@acm.org.
CSCW’14 , February 15–19, 2014, Baltimore, Maryland, USA. Copyright is held by the authors. Publication rights licensed to ACM. ACM 978-1-4503-2540-0/14/02...$15.00.
http://dx.doi.org/10.1145/2531602.2531623
Recent surveys have shown that about half of the pop-ulation of the US gets their news online, and about one third goes online every day for news.2
The study of patterns of consumption of online news has attracted considerable attention from the research com-munity for over a decade. This research started with the analysis of access patterns to websites, and has expanded to include topics such as new engagement metrics, per-sonalized news recommendations and summaries, etc. (see Section 2 for an overview).
One line of research looks at consumption and interac-tion patterns as a single time series and attempts sev-eral prediction tasks on it. For example, predicting total comments from early comments [18, 28], total visits from early visits [16], etc. More recent works incorporate at-tributes from each specific article (e.g. topic, source, etc.) into the prediction [4].
We adopt a novel approach, in which we integrate different types of interactions of users with an online news article including visits, social media reactions, and search/referrals. We evaluate our methods on data from Al Jazeera English, a large international news network, deeply characterizing different classes of articles, and predicting their total number of page views and their effective shelf-life (the effective shelf-life of an article is the time span during which it receives most of its visits). The characterization and prediction of user behavior around news articles is valuable for a news organization, as it allows them (i) to gain a better understanding of how people consume different types of news online; (ii) to deliver more relevant and engaging content in a proactive manner; and (iii) to improve the allocation of resources to developing stories over their life cycle.
Our contributions. In this paper we present a quali-tative and quantiquali-tative analysis of the life cycle of online news stories. Our main contributions are the following: 2
http://www.people-press.org/2012/09/27/section-2-online-and-digital-news-2/
• We find that social media reactions can contribute substantially to the understanding of visitation pat-terns in online news.
• We characterize two fundamental classes of news sto-ries: breaking news and in-depth articles, and describe the differences in users’ behavior around them. • We describe classes of short-term audience response
profiles to news articles in terms of visits and social media reactions (decreasing, steady, increasing, and rebounding).
• We improve significantly the accuracy and timeliness of predictive models of total visits and shelf-life of ar-ticles, by incorporating social media reactions. The remainder of this paper is organized as follows. Sec-tion 2 provides an overview of previous works related to ours. Section 3 introduces our data collection and de-fines the concepts and variables we use. The main re-sults of our paper are presented as descriptive and pre-dictive analysis in the two following sections: Section 4 describes user behavior with respect to different classes of articles, and Section 5 demonstrates the importance of incorporating social media information into the pre-dictive modeling of visits. The last section concludes the paper.
2. RELATED WORK
One of the earliest published studies of user behavior in online news was conducted by Aikat [3], who studied the web sites of two large newspapers from November 1995 to May 1997. This work describes many of the patterns still seen in news sites today: visits occur mostly during weekdays and working hours; readers “skim” pages for information so dwell times tend to be short, and there are clear traffic “bursts” that can be attributed to specific news developments.
With the advent in recent years of what can be consid-ered as new forms of journalism (blogs) and new prop-agation mechanisms for news (micro-blogs and online social networking sites), the volume of research publi-cations in this area has increased considerably. In this section we overview a few previous works closely related to ours, but our coverage is by no means complete. Behavioral-driven article classification. Previous works including [8, 19] that have studied online activi-ties around online resources (e.g. visiting, voting, shar-ing, etc.), have consistently identified broad classes of temporal patterns. These classes can be generally char-acterized, first, by the presence or absence of a clear “peak” of activity; and second, by the amount of activ-ity before and after the peak.
Crane and Sornette [8] describe classes of visitation pat-terns to online videos, and present models that are consistent with propagation phenomena in social net-works. Lehmann et al. [19] extend these classes by ob-serving that for Twitter “hashtags” (user-defined top-ics) the distributions of activity in different periods
(before/during/after) induce distinct clusters of activ-ity that can be interpreted considering the semantics of each hashtag. Romero et al. [25] describe how manually-assigned classes of hashtags are related to different shapes of the exposure curve: the probability that a user will propagate some information (“retweet” in the case of Twitter) after being exposed to the information by a certain number of her neighbors.
Yang and Leskovec [30] describe six classes of tempo-ral shapes of attention. Attention is measured in terms of the number of appearances of a given phrase (of a variation of it) corresponding to an event. The patterns describe the distribution of attention over time, as well as the ordering in which different types of media (pro-fessional blogs, news agencies, etc.) “break” the story. In general, previous works have established that the evo-lution of the popularity of different on-line items de-pends on their class. Figueiredo et al. [10] describe how YouTube videos that are posted to a “top” page on the website, and videos that are making use of professionally produced content, are different from randomly-chosen videos in terms of their visit patterns.
Recently, researchers at URL shortening service Bit.ly [6] described how an article’s half-life (see definition in Section 3) is affected by topics, extending a previ-ous observation than in general there are some top-ics that are more time-sensitive than others [12]. For instance, business-related articles have on aver-age a longer half-life, while articles related to poli-tics/celebrities/entertainment have an intermediate one. Sports-related articles have in comparison a shorter half-life. Previously, Bit.ly researchers [5] have shown that this half-life is also affected by the social media platform where the link is first posted (e.g. links on Facebook were longer-lived than links on Twitter).
We deepen and complement previous works on behavioral-driven characterization of online content, by describing the life-cycle of online news articles consider-ing their visitation patterns as well as their social media reactions.
Prediction of users’ activity. The prediction of the volume of user activities with respect to on-line content items has attracted a considerable amount of research. This is attested by a number of papers, some of which are outlined in Table 1. Another active topic that is closely related, but different, is that of predicting real-world variables such as sales or profits using social media signals (e.g. [13] and many others).
Over the years, the models used to predict user behav-ior in social media have increased in complexity. For in-stance, Bandari et al. [4] and Ruan et al. [26] incorporate into their models features extracted from the content of the articles, such as topics. Yin et al. [31] study vot-ing behavior over on-line contents and describe a model that considers that users are divided into two
popula-Table 1. Selected references on predictive modeling of user behavior, sorted by publication year.
Reference Collection Input / Output
Tatar et al. [28] 20 Minutes
input: publication hour, number of comments after a short time, section; output: total number of comments Brody, Harnad,
and Carr [7]
arXiv pre-prints
input: short-term article downloads; output: long-term article citations Lee, Moon, and
Salamatian [18]
DPReviews
/
Mys-pace
input: time to first-comment, inter comment arrival stats; output: time to last comment
Lerman and
Hogg [20]
Digg input: visits; output: parameters of models that consider examination and promotion patterns
Kim, Kim, and Cho [16]
Blogs input: clicks on first 30 minutes; output: clicks until end of lifetime Yu, Chen, and
Kwok [32]
Facebook pages
input: content and media type; out-put: number of FB likes/shares of each post
Lakkaraju and Ajmera [17]
Facebook pages
input: text- and other characteris-tics of the posting and the page; out-put: number of FB likes/shares of each post
Szabo and Hu-berman [27]
YouTube and Digg
input: views (Y), votes (D) in first 10d (Y), 2h (D); output: total num-ber of views/votes Bandari, Asur, and Huberman [4] News aggregator
input: text analysis incl. topics, named entities, subjectivity, etc., source popularity; output: tweet count
Ruan et al. [26] Tweets input: topics, past tweets, content features, user features, etc.; output: tweet count for a given topic Pinto, Almeida,
and Gon¸calves [24]
YouTube input: time series of views in first 7 days; output: number of views after 30 days
Ahmed et al. [2] YouTube, Digg, Vimeo
input: views (Y, V) and votes (D) over time; output: predict future popularity
tions: a group that follows the majority opinion, and a group that does not. Myers et al. [23] study models that describe user activity in terms of information propaga-tions, including the presence of external influences, e.g. traditional media sources that can reach vast audiences, such as television networks. Huang et al. [15] consider an online model of social activities that evolves over time as more information becomes available.
In contrast with previous works, we focus on the dynamic relation between social media reactions and visits over time, and show that both are useful to understand the differences among classes of articles and to predict future visit patterns.
Analysis of news visits and social media re-sponses. Dezso et al. [9] analyze the visits to a large news portal in Hungary. One aspect they study which is closely related to our work is the half-life of articles, which is shown to be distributed according to a power-law across a broad range, with a mean of 36 hours. Agar-wal et al. [1] study the actions users perform after reading an article, which include printing, commenting, rating, and sharing through e-mail or social media. Their fo-cus is on performing personalized recommendations, but they also uncover that article topics have an effect on the probability of each action, with a division between articles users read privately and articles they share pub-licly: “Users tend to share articles that earn them social
prestige and credit but they do not mind clicking and reading some salacious news occasionally in private.” Social media reactions to traditional news media can vary not only in volume but also qualitatively. Hu et al. [14] record tweets during the broadcast of a speech of the US President. They observe that many tweets refer to the speech in general, except for certain topics which are discussed in more detail.
Finally, social media optimization company SocialFlow describes in a whitepaper [22] a comparative study of social media responses to several large media outlets: Al Jazeera, BBC News, CNN, The Economist, Fox News and The New York Times. Among other findings, they note that the probability that a user clicks on a tweet is higher for The Economist (≈ 19%) than for Fox News (≈ 16%), Al Jazeera (≈ 11%) or The New York Times (≈ 4%). However, followers of Al Jazeera are almost twice as likely to retweet article links than followers of the other channels.
In contrast with previous works, we consider jointly traf-fic to the website and social media reactions, as both con-stitute acts in which users engage with the news content. Additionally, we quantify the richness of Twitter mes-sages over time measuring entropy and counting unique tweets, and show that these variables are key to more accurate predictions of future visits.
3. CONTEXT AND DATASET
In this section we provide some context to our research and describe the dataset that will be used on the remain-der of the paper.
3.1 Traditional news and social media
Our dataset is provided by Al Jazeera English,3 a
well-established news organization that reaches hundreds of millions of viewers through its TV channel. Their web-site is divided into five major sections: News, In-Depth, Programmes, Sports, and Weather – plus a collection of blogs, which is outside the scope of this study. Approxi-mately 40 editors/producers work on the areas of News, In-Depth, and Programmes.
The editors of Al Jazeera English maintain Facebook and Twitter4 accounts (we call them “corporate accounts”
in the rest of the paper) and use them actively to an-nounce their content. This seems to be a standard prac-tice adopted by all major media organizations in recent years. Each account (facebook.com/aljazeera and @AJEnglish) has over 1.5 million followers as of May 2013. Using these accounts, articles in the News sec-tion are shared immediately after being posted online. Articles on the In-Depth and Programmes sections are 3http://www.aljazeera.com/
4
Currently Facebook and Twitter are the two most frequent sources of social media referrals to Al Jazeera. Reddit ap-pears in a third place but only through few articles having extremely high visibility.
Oct 08 Oct 15 Oct 22 Oct 29 Nov 05
Visits
Figure 1. Overall visits to articles. Our study considers all articles posted from Oct. 8th to Oct 29th, 2012 (the graph extends until Nov. 6th).
shared throughout the day with the goal of maximizing audience reach across multiple time zones.
The corporate social media accounts re-share articles at different times of the day, sometimes up to 4 times, on a schedule determined by editors’ judgment and designed to increase user engagement. Close attention is paid to the wording of the items posted in social media, includ-ing aspects such as their length and the use of hashtags in the case of Twitter. Editors use a variety of online tools to obtain low-latency analytics of traffic and social media, and to decide which hashtags and keywords to use in their postings.
More than half of the visitors to the Al Jazeera En-glish website are from the USA, the United Kingdom, or Canada. According to an online survey taken by Al Jazeera English in 2011 (n = 4, 500), 18% of respondents said they used Twitter, 42% Facebook, and 12% both. Social media interactions and traffic to the website can complement or substitute each other. Most frequently, they complement each other: people click on the shared content and visit the website. Sometimes, the social me-dia share can be a substitute for a visit to the article, such as when a video can be viewed directly on the social media site, or when the social media content itself deliv-ers enough information to satisfy usdeliv-ers without requiring them to click through to the full article.
For instance, the news “Pakistan’s Malala now able to stand in UK” (19 Oct 2012) generated an unusually large number of shares on Facebook, but comparatively little traffic on the website. At the time, the student-activist was being treated from nearly-fatal wounds received ten days before, and it is likely that users who were following the story just wanted to express their relief or satisfac-tion at her recovery.
In summary, for Al Jazeera and for most large news or-ganizations, social media is important both because it attracts more visitors to their website than any other external referrer, as well as because it provides more platforms in which to have an audience. Hence, many news organizations adopt an active role in social media in order to increase this positive effect.
Table 2. Summary statistics of our dataset. Total Article avg.
Number of articles 606
-Visits after 1 hour 260 K 430
Visits after 1 day 2.5 M 4,273
Visits after 7 days 3.6 M 5,971
Facebook shares 155 K 256
Tweets 80 K 133
Tweet entropy 5.6 bits
Fraction of unique tweets 19.9 %
Fraction of corporate retweets 36.8 %
3.2 Data collection
We focus on a period of three weeks between October 8th, 2012, and October 29th, 2012. The choice of this period is not random: it was a relatively stable period of traffic, only exhibiting a relatively minor peak on Oc-tober 29th due to Hurricane Sandy. Figure 1 depicts the frequency of visits to all the articles in our dataset during the observation period.
The data collection is done via a “beacon” embedded in all article pages; this produces events that are processed using Apache S4,5 a high-performance system for online
processing, which is used to collect and aggregate the vis-its with a 1-minute granularity. For efficiency reasons, only articles obtaining at least 5 visits in a 10-hour win-dow are monitored. The collected data is stored using a Cassandra6 NoSQL database.
Our system also collects messages from Facebook (using the Facebook Query Language API) and Twitter (using their Search API). Both platforms have strict limitations on polling frequencies, which impose a trade-off between the number of articles we can monitor and the frequency with which we monitor them. To obtain more accurate results for popular articles, and after experimenting with different settings, we decided to poll social media reac-tions for articles that are within the list of the 30 most visited articles during each five-minute data collection window. We remark that this list varies considerably over time.
We selected a uniform random sample of articles whose first visit was recorded during the observation period, and kept only those accumulating at least 100 visits dur-ing their first week after publication. A total of 606 arti-cles was included; this covers over 3.6 million visits and at least 235,000 social media reactions. Table 2 presents some summary statistics on this dataset.
3.3 Metrics
For each article we collected a number of metrics re-garding user visits and social media reactions. First, we observed at a granularity of one minute the number of visits (page views) to each article, and the URL of the previous page seen by the users before reaching an article (referral). We bucketed the latter into four classes: 5
http://incubator.apache.org/s4/
• internal links, mostly from the home page of the web-site: these are the majority of the traffic sources and comprise 70% of the visits;
• external links from other sources including social me-dia sites, news aggregators, and others: 14%;
• direct links, which have an empty referral and corre-spond mostly7to people sharing news through instant messaging, e-mail, or other non-web application: 11%; and
• search referrals, basically links from organic search re-sults: 5%.
We remark that this distribution of referrals corresponds to the articles in our sample, which do not include the homepage of the website, section index pages, or older articles. If we take those into account, the numbers are different, e.g. the search referrals account for 30% of the visits.
We also collected periodically the number of times an article has been shared on Facebook, and the content of any Twitter message containing the URL of the article, or a variant of the URL produced by a URL shortening service. We used this data to compute the following variables:
• Number of Facebook shares per minute (interpolated). • Number of tweets per minute.
• Number of unique tweets per minute. A tweet is deemed unique if its edit distance with all previous tweets pointing to the same article (after discarding shortened URLs and “retweet” prefixes) is more than 10 characters.
• Tweet vocabulary entropy. To compute this, at any given point in time we create a document by concate-nating all the tweets received up to that time. Then, we compute the entropy of the distribution of terms in that document.
• Number of corporate retweets per minute. A tweet is a “corporate retweet” if it includes “RT @AJEnglish” or “RT @AJELive” in its text. A tweet can be both corporate retweet and unique, as users are free to edit the retweet before posting it.
• Number of followers, friends (followees) and statuses of each of the users posting a tweet.
4. BEHAVIORAL-DRIVEN CLASSES
In this section we describe classes of articles according to patterns of user behavior.
4.1 News vs In-Depth
We observe that articles in the two larger sections of the Al Jazeera English website trigger distinct user behavior patterns: visits and social media reactions on articles in the News section (322 articles in our sample) are different from the ones on articles in the In-Depth section (139 articles).
7http://www.theatlantic.com/technology/archive/2012/
10/dark-social-we-have-the-whole-history-of-the-web-wrong/263523/
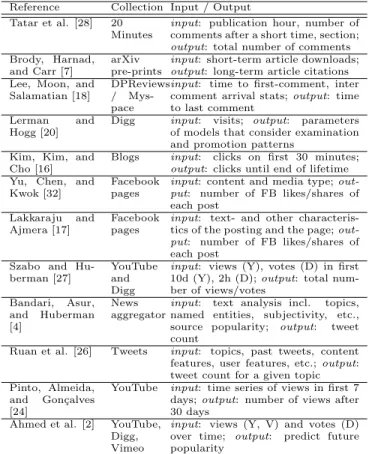
Table 3. Top 10 most frequent words (stemmed and low-ercased) in article titles in the “News” and “In-Depth” sections. Words that appear in both lists are italicized.
Top words (News, n = 322) Top words (In-Depth, n = 139)
Word News In-Depth Word News In-Depth
us 34 17 us 34 17 kill 21 1 pictur 0 10 attack 19 0 obama 6 6 syria 15 4 interact 0 6 dead 15 1 america 0 6 protest 13 0 muslim 0 5 rebel 12 2 syrian 11 4 vote 11 3 syria 15 4 syrian 11 4 presid 4 4 pakistan 10 2 polici 2 4 1 2 3 4 5 6 7 8 9 10 11 12 13 1 2 3 4 5 6 7 8 9 10 11 12 1 2 3 Visits/min.
Tweets or Facebook shares/min.
Hours-equivalent from publication Visits Visits (internal traffic) Twitter Facebook 1 2 3 4 5 6 7 8 9 10 11 12 13 1 2 3 4 5 6 7 8 9 10 11 12 1 2 3 Visits/min.
Tweets or Facebook shares/min.
Hours-equivalent from publication Visits Visits (internal traffic) Twitter Facebook
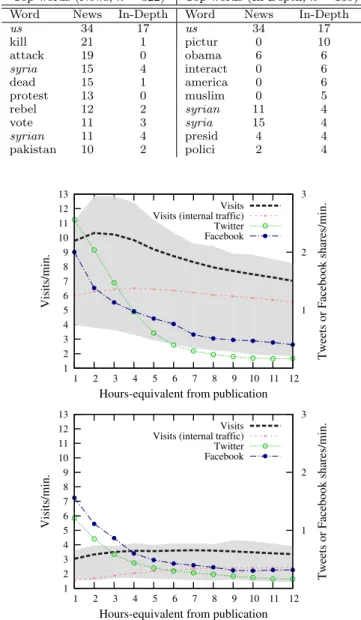
Figure 2. Visits per minute (left y-axis) as well as Tweets and Facebook shares per minute (right y-axis) for the first 12 hours. For visits, the shaded area covers 50% of the data (quantiles 0.25 to 0.75). Top: average for a News item. Bottom: average for an In-Depth item.
Titles. Table 3 includes the most frequent words in ti-tles of articles in these two sections, after converting to lowercase and applying Porter’s stemmer.8 While in our sample the US and Syria appear prominently in both sections, articles in the News section include several vio-lent acts, while articles in the In-Depth section are dom-inated by photos and political analysis. A chi-squared test comparing the entire distributions shows p < 10−13, rejecting the hypothesis that they are equal.
8
http://snowball.tartarus.org/algorithms/porter/stemmer. html
103 104 105
102 103 104
Visits in seven days
Visits in one hour News
f(x) = 12x
In-depth
f(x) = 29x
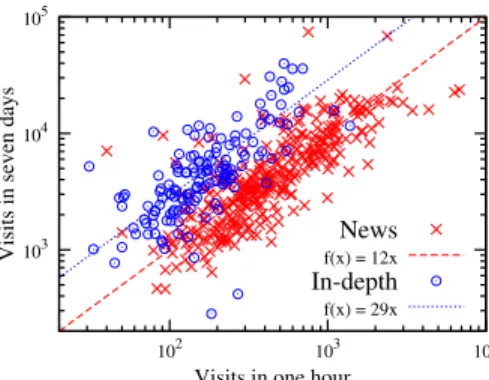
Figure 3. Visits in the first hour versus visits on the first week for articles in the two largest categories. A simple function that assumes that visits after seven days are a multiple of visits after one hour has been included, by performing a least-squares fit in the central portion of each distribution. 100 101 102 103 100 101 102 103 104 Twitter (7d) Facebook (7d) News f(x) = 24x0.36 In-depth f(x) = 2.3x0.72
Figure 4. Differences in the distribution of Facebook vs Twitter shares. On average the ratio of Facebook shares to tweets is 1.9:1 (1.6:1 for News, 2.7:1 for In-Depth). The result of a least-squares fit in the central portion of each distribution is included.
Visits. Figure 2 (top) depicts the average time series of some variables for articles in the News section. Time is expressed in hours-equivalent, which are hours cor-rected by the seasonality (day-night, weekday-weekend) of traffic on the website, as in [27]. Initially there are a number of visits and activity on Twitter and Facebook, that decays rapidly after a short time. This is often the pattern in news media as observed e.g. by [9, 21] and others. After a few hours, a large amount of visits can be explained by “internal traffic”, i.e. visitors arriving from the homepage of the site. For most articles, once the news article is displaced from the homepage by more recent items, its traffic slows down considerably. The profile of visits to In-Depth articles can be more complex. Figure 2 (bottom) depicts the average series for these articles. We can observe that a sustained level of visits is observed during several hours, as the contents of these articles are not as time-sensitive as those of the News section. We remark that in both cases (News and In-Depth) there is considerable variability from one ar-ticle to another. 0.00 0.02 0.04 0.06 0.08 0.10 0.12 0.14 0.16 0.18 0.20 0.10 0.20 0.30 0.40 Frequency
Fraction of unique tweets News In-depth
Figure 5. Differences in the distribution of the fraction of unique tweets. In both cases, Twitter activity is domi-nated by re-tweets or repetitions of the same tweets, but In-Depth articles attract more unique tweets.
0.00 0.05 0.10 0.15 0.20 0.25 0.0 0.1 0.2 0.3 0.4 0.5 0.6 0.7 0.8 Probability
Fraction of corporate re-tweets News In-depth
Figure 6. Differences in the distribution of fraction of cor-porate retweets. In-Depth articles have a larger share of re-tweets from the @AJEnglish and @AJELive accounts.
News items compared to In-Depth items have a more in-tense first hour, as can be seen in Figure 3. For News, visits in one hour are roughly 1/12th of the visits in the first week, while for In-Depth they are on average around 1/29th. The two groups are similar to “pro-moted” (homepage) and “not-pro“pro-moted” stories in Digg as observed in [27].
This difference in behavior can to some extent be ex-plained by the design of the website. News articles are displayed more prominently on the home page, with the most salient location being typically used by a news item; however, In-Depth articles are also visible across the website, including a prominent slot on the top right cor-ner of every page. Additionally to the differences in so-cial media sharing that we discuss next, we observe that long-lived News articles (in terms of effective shelf-life as defined in Section 5.2) tend to include analysis that would actually make them fit for the In-Depth section. Indeed, the top-3 longer lived News articles in our obser-vation period are “Profile: Malala Yousafzai” (Oct 10th, 2012), “Syrian rebels in uneasy alliances” (Oct 25th, 2012), and “Malala is the daughter of Pakistan” (Oct 13th, 2012); their contents, while motivated by specific news events such as the Syrian conflict and the shooting of a school girl, do not describe the events but rather the context in which they are taking place.
Social media. On average the ratio of Facebook shares to tweets per article is 1.9:1, which is to some extent consistent with the survey described in Section 3.1 that indicated that there were twice as many website visi-tors using Facebook as there were Twitter users. Addi-tionally, In-Depth articles are shared more on Facebook given the same level of activity on Twitter, as shown in Figure 4. On average News articles have 1.6 Facebook shares per tweet, while In-Depth articles have 2.7. As shown in Figure 5 there is also a difference in the number of unique tweets. On average, 17% of the tweets about News articles are unique, versus 25% of the tweets about In-Depth articles. This means that a majority of users do not change the content of the tweets when clicking on the “tweet” button next to the articles, or when retweeting from another Twitter user.
There is also a difference in the number of corporate retweets, as shown in Figure 6. On average, 27% of tweets about News articles are corporate retweets, com-pared to 44% of tweets about In-Depth articles. This means that for In-Depth articles a larger share of Twit-ter activity can be attributed to users who are follow-ers of @AJEnglish or @AJELive, and thus are probably more engaged with these Twitter accounts.
Anecdotally, we know that editors spend more time crafting tweets to promote In-Depth articles than News articles, given that the former are not as time sensitive as the latter. In the case of News, the headline is of-ten posted without modifications to Twitter, which may produce a comparatively less appealing tweet.
4.2 Analysis of news articles
We observe that News articles have attention profiles that are quite predictable, while In-Depth and other ar-ticle categories show significantly more variability. We focus on the first 12 hours-equivalent after publication of each article in the News section, and observe the time series of data from all sources including internal links, ex-ternal links, search engines, and social media (similarly to the time series shown in Figure 2, but for each indi-vidual article instead of as an average). We then classify articles into several classes based on visit patterns that are apparent from these observations, starting with the largest class (“decreasing”) and following with the other classes. The classification is done by the authors seeking consensus and discussing borderline cases.
At a high level, the classes of articles in our News sam-ple can be roughly described by an “80:10:10 rule”. The traffic to ∼80% of the articles decreases monotonically during the first 12 hours, the traffic to ∼10% does not de-crease, and the traffic to the remaining ∼10% decreases first, but then rebounds. Articles on each are listed in Appendix A.
Next we provide a brief description of each class and ex-amples of stories appearing in each of them. We remark that in this work we do not attempt to provide a
compre-hensive content-based typology for news articles within each attention profile.
Decreasing (78%). The largest article class repre-sents about 78% of the sample set. Articles in this class demonstrate an initial spike in visits following article publication, followed by a rather consistent drop in the number of visits, either immediately (244 articles), or after a short delay (7 articles).
Delayed onset traffic decreases have been observed be-fore, such as in [21] with respect to the shooting in Au-rora, Colorado, in 2012. This attention pattern can often be attributed to breaking news that resonates with read-ers located in a time zone that is off-peak when the arti-cle is first posted, such as when that portion of the audi-ence is mostly asleep. A story about Hurricane Sandy’s movement up the East Coast of the United States, for example, sees an initially sharp visit growth that begins to decline as the East Coast retires for the evening. The predominance of this class of article indicates that while news itself occurs, and can even be covered, at a constant rate, in most cases readers will only be inter-ested on a news article for a brief period of time after its publication.
Steady or Increasing (12%) Roughly 9% of the sam-ple’s articles retain relatively constant visitor rates dur-ing their first 12 hours. Compared to news categories with very short shelf-lives, such as sports news, these ar-ticles are remarkably consistent. In this subset of news articles, dramatic news and emotional stories appear to garner Facebook shares and, often as a result, extended shelf-lives.
In the U.S., multiple articles on Obama and Romney’s sharp-tongued presidential debate drive consistent Face-book and Twitter responses for a relatively long period of time following the articles’ publication. A poll on racism in the US has similar staying power and Facebook shar-ing. In Central Asia, the Taliban attack on Pakistani schoolgirl Malala appears in a number of these articles, where consistent Facebook sharing buoys the article traf-fic beyond average shelf-life. In Europe, furor over a seismology scandal is posted to Facebook, while in the Middle East, atrocities in the war in Syria and violence between Israel and Hamas also generate hours of steady traffic. Africa sees a new prime minister in Libya, the police shooting of 34 striking miners in South Africa, and a bomb attack on a church in Nigeria, all of which see sustained traffic thanks in part to significant Face-book and Twitter sharing many hours after their initial publication.
Stories in this group were mostly developing stories and many of them had regular updates. One such example is the story about Malala for which Al Jazeera sent a correspondent to the Swat Valley. Being a complex re-gion to cover, a series of news articles and feature stories were written. In addition, Al Jazeera reached out to the
Reddit community for a Q&A session which topped the “Ask me anything (AmA)” section9. section.
A relatively small number of articles (3% of our sample) buck the usual trend and see increased page traffic as time passes after their publication, rather than a decline. To the extent that these articles can be generalized, they resemble the class of articles detailed above. Some of these articles were also updated with supporting content. For at least half of them, web producers added video packages after publication, which may explain to some extent the increase in visits.
Rebounding (10%). About 10% of the articles in our sample initially exhibit a decline in visits/minute, until a point where such decline is reversed. This “rebound” occurs either because of internal or external links. In the case of internal traffic, the traffic patterns behind these rebounding articles sometimes reflect the com-mon newsroom practice of linking to previous coverage in more recent articles. This practice provides addi-tional background context to readers just arriving at the story, but also helps news organizations extract addi-tional value from articles that are otherwise statistically becoming valueless. Stories that required a significant investment of resources to produce are also promoted more heavily than regular articles. We can see that in these cases, these internal links do indeed deliver read-ers to articles whose shelf-lives have nearly expired, when measured by homepage and social media traffic.
The articles that rebound as a result of external traf-fic are benetraf-ficiaries of attention directed from outside of the news organization (e.g. a social networking site, the website of another news network, etc.). Typically each observed burst in external web traffic can be tracked to a single source. Breaking stories can also gain visits as on-going developments drive significant additional interest. This phenomenon is evidenced, for instance, by three rebounding articles tracking Hurricane Sandy’s descent upon the United States.
In general, we see that when News articles cover topics that stray from “hard news”, the article’s attention pro-file reflects the increased variability seen in the In-Depth pieces. For example, some articles ostensibly cover spe-cific actualities, but also bridge into long-standing issues: in the U.S., “Immigrant family in pursuit of the Ameri-can Dream” and “Living the modern AmeriAmeri-can Dream” stoke passions around immigration.
The sometimes blurry line between reporting on imme-diate actualities and longer-term trends like immigration is an area of tension in journalism, one identified by Gal-tung and Ruge when they asked “how do ’events’ become ’news”’ ? [11].
9
http://www.reddit.com/r/IAmA/comments/11p6q3/ i am asad hashim journalist for the al jazeera/
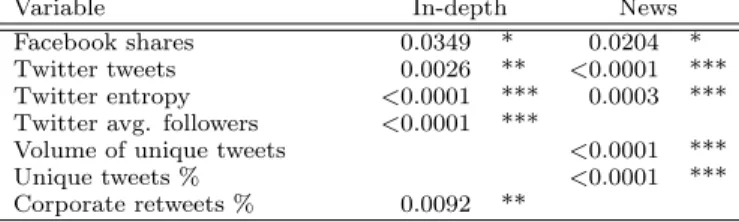
Table 4. Modeling visiting volume after 7 days: Signifi-cance levels for regression models after 20 minutes.
Variable In-depth News
Facebook shares 0.0349 * 0.0204 *
Twitter tweets 0.0026 ** <0.0001 ***
Twitter entropy <0.0001 *** 0.0003 ***
Twitter avg. followers <0.0001 ***
Volume of unique tweets <0.0001 ***
Unique tweets % <0.0001 ***
Corporate retweets % 0.0092 **
5. IMPROVING TRAFFIC PREDICTIONS USING SOCIAL MEDIA DATA
An increased amount of social media reactions is often correlated with more traffic to online articles. This is particularly marked in the case of non-decreasing and rebounding News articles, as well as In-Depth articles whose visitation patterns are more varied and less pre-dictable than regular (decreasing) News articles. In this section, we combine social media reactions with early visitation measures to provide improved predictions of (i) the volume of visits to an article after 7 days from its publication and (ii) the effective shelf-life of articles, i.e. the time during which they will receive most of their visits. We begin by fitting models to our sample data, and then explore the practicality of this approach for new data.
5.1 Modeling visiting volume
Our first goal is to determine to what extent social me-dia reactions can improve the prediction of the overall popularity (total number of visits) of an article. The de-pendent variable that we want to describe with our mod-els is the total number of visits after 7 days (v7d). We use a straightforward approach to answer this question— linear regression models. We include the following vari-ables (described in Section 3.3) as observed at the time at which the prediction is performed: number of visits (v), number of visits from link referrals (vr) and from “direct” traffic from e-mail/IM (vd), shares on Face-book (f ), Twitter (t), mean number of followers of peo-ple sharing on Twitter (foll), entropy of tweets (ent), number and fraction of unique tweets (uni, unip) and fraction of corporate retweets (cp). We use a linear re-gression model that includes all first-order effects as well as second order interactions. We included second-order interactions because of the interdependency of the vari-ables (e.g. an article with more visits is more likely to have more social media reactions):
lm(vis7d∼v)
lm(vis7d∼(v+vr+vd+f+t+foll+ent+uni+unip+cp)2).
The distribution of visits to articles is log-normal distributed in our data, consistently with previous works [29, 4]. We log-transform log(x + 1) the visits as well as the volume of social media reactions. For t=5, 10, 15, . . . we calculate the proportion of the explained variance of these two linear models. The result is shown in Figure 7.
0.0 0.1 0.2 0.3 0.4 0.5 0.6 0.7 0.8 0.9 5 30 60 90 120 150 180 r 2
Time from publication [minutes]
News News (visits only) In-depth In-depth (visits only)
Figure 7. Proportion of explained variance (r2) for the
prediction of total volume of visits, for News and In-depth articles.
It takes about 3 hours to be able to explain > 0.6 of the variance for In-Depth articles, and the additional variables are profitable from the first minutes. After 10-20 minutes we observe the largest difference in our regression models (+0.5 in terms of r2).
We take a closer look at the model variables after 20 minutes to identify the sources of this improvement. For this purpose we stepwise fit the model variables by AIC (Akaike information criterion) as implemented in stats.step in R. Table 4 shows the reliability of the Social media variables to serve as good predictor for the volume of visits after 7 days.
The fraction of traffic from different sources does not ap-pear to be a reliable predictor when all variables are used for the model; when we reduce the model to exclusively these two variables, the traffic from e-mail/IM is a more reliable predictor than the traffic from external links. Social media variables, particularly the number of tweets and the entropy of the vocabulary used in them, seem to be reliable predictors for both In-Depth and News articles. The number of followers of people posting an article on Twitter together with the fraction of corporate retweets seem to be particularly important for In-Depth articles. A possible interpretation is that the response to these articles has a larger component driven by in-fluential accounts and the actions of Al Jazeera editors. In contrast, the number and fraction of unique tweets can be used for the prediction of traffic to News articles. Consequently, a rich online discussion around a breaking within its first minutes is a signal of potentially high and sustained user interest.
5.2 Modeling shelf-life
We define the effective shelf-life τ` of an article as the
time passed between its first visit and the time at which it has received a fraction ` of the visits it will ever receive. In this work we set ` = 0.90, but similar values (e.g. 0.85, or 0.95) yield similar results to the ones presented here. When ` = 0.50 this is equivalent to half-life [5, 6].
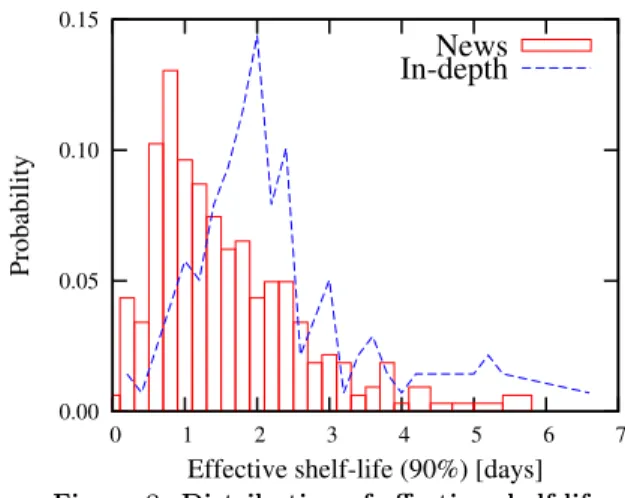
0.00 0.05 0.10 0.15 0 1 2 3 4 5 6 7 Probability
Effective shelf-life (90%) [days]
News In-depth
Figure 8. Distribution of effective shelf-life.
Table 5. Modeling effective shelf-life: Significance levels for regression models after 20 minutes.
Variable In-depth News
Visits R2 0.0005 0.0921
Social media R2 0.4457 0.2193
Social media R2adjusted 0.2274 0.1505
Twitter tweets 0.0138 * 0.0061 **
Twitter entropy 0.0027 ** 0.0024 **
Twitter avg. followers 0.0001 ***
Volume of unique tweets 0.0026 **
Unique tweets % 0.0190 * 0.0445 *
Corporate retweets 0.0001 ***
Traffic from e-mail/IM 0.0482 *
Given that our observation period is finite, we use a seven-day observation period as a proxy for the total number of visits the articles will ever receive, as for basi-cally all the articles in our sample, there is little activity after 3 or 4 days. This is consistent with the experience of Al Jazeera editors and with observations in previous works (e.g. [30]). We remark however that there are rare cases where an article is “re-born” after weeks, for in-stance when it provides background information for a new development.
The distribution of the shelf-life for both classes is de-picted in Figure 8. As observed in the qualitative analy-sis, the average shelf-life of In-Depth articles, 2 days and 9 hours, is longer than the one of News articles, 1 day and 16 hours. Their average half-lives are respectively 20 hours and 8 hours (both are shorter than the 36 hours observed by [9]).
We observe that the effective shelf-life of all articles is in-dependent from their total number of visits after 7 days (Pearson’s correlation r = −0.03). This will lead to low accuracy when predicting based solely on visits. For the predictive task the linear regression model setup is anal-ogous to the one used to model visiting volume; this time the dependent variable is τ90. Our focus is again
on the variables after 20 minutes. Running the first re-gression model (only visits) for this time period reveals differences for News and In-Depth stories (Table 5). For News stories, at least 9.2% of effective shelf-life variance
Figure 9. Screenshot of http://fast.qcri.org/ depicting predictions for four articles. Green bars indicate number of pageviews so far, gray bars indicate predictions. Exact numbers are business-sensitive so they are omitted.
can be described, while visits show no predictive infor-mation for In-Depth stories. Including social media vari-ables changes this picture dramatically. Especially for In-Depth stories, a significant part of the variance can now be described. Stepwise fitting of the social media models shows that the number of Facebook shares and the traffic from external links are no reliable predictors for effective shelf-life. In contrast, all Tweet variables reach significant levels. For In-Depth articles corporate retweets and traffic from e-mail/IM also serve as reliable predictors.
In a nutshell, using social media variables to model effec-tive shelf-life of stories can increase the accuracy of early prediction significantly. This is a very promising result for future research given that we describe the effective shelf-life pattern with data from one single time point without the use of time series or other elaborate models.
5.3 Online predictions
A live system implementing these ideas on data from the Al Jazeera English website is available online.10 This allows us to further test the effectiveness of our methods in an online setting, in addition to the off-line tests we have described so far. Figure 9 shows a screenshot of this application.
The system collects data for all articles irrespective of their section, and produces predictions for all articles in the News section using one set of models, and for all the remaining articles (In-Depth, Videos, Programmes, etc.) using another set. In each model set there are models that are executed 1 hour, 6 hours, 12 hours and 24 hours after an article is published. The target variable in this live system is page-views after 3 days. Every 24 hours, it re-trains the models by adding the articles that have passed the 3-day deadline to the training set. After an initial warm up period of 3 weeks, we monitored all 350 article URLs published during a period of 1 week in July 2013 and kept all the predictions done by the system. 10http://fast.qcri.org/ 100 1000 10000 100000 100 1000 10000 100000 Actual
Predicted (1 hour after publication)
r2 = 0.72 100 1000 10000 100000 100 1000 10000 100000 Actual
Predicted (6 hours after publication)
r2 = 0.85
Figure 10. Predictions of visits after 3 days using the on-line system across all articles. Left: predictions 1 hour after publication. Right: predictions 6 hours after publi-cation.
First, we evaluated the coverage of our system, which as explained in Section 3.2 is designed to focus on the top 30 most visited URLs in every 5-minute period. In practice, we produce predictions within 6 hours for 194 (55%) of the articles seen. Taking as comparison Google Analyt-ics, which is also used by this website,11 we observe that
this covers 65% of the page-views to Al Jazeera English articles. We remark that this partial coverage is not an intrinsic aspect of the system, but a limitation of using public (instead of paid) access to Twitter’s API. Second, we evaluated the quality of the predictions. In order to do so, we store the predictions done by the dif-ferent models. Conceptually, each of the 350 articles is in the testing set, and the training set is composed of all the articles published in the period of 1 to 4 weeks before its publication day. Figure 10 compares the ac-tual number of page-views with predictions done 1 hour and 6 hours after an article is published. The quality of the predictions after one hour is similar to off-line tests (r2= 0.72) even when we are mixing articles from other
sections; 134 articles (38%) not in News or In-Depth – but we also remark the predictive horizon of the live system is shorter (3 days vs 7 days). Predictions after 6 hours have r2 = 0.85. The location of the best
trade-off between timeliness and accuracy in the range of 1 to 6 hours is an important problem, which requires un-derstanding how editors react to the predictions and use them in practice.
6. CONCLUSIONS
Main findings. By adopting an integrated view of users’ behavior, we have observed that there are two classes of articles that generate qualitatively and quan-titatively different responses from readers. News articles describing breaking news events tend to decay in atten-tion shortly after they are published and thus have a shorter shelf-life. These articles also have more repetitive social media reactions, as most users simply repeat the news headlines without commenting on them. In-Depth items portraying or analyzing a topic tend to exhibit a longer shelf-life and a richer social media response, in-cluding more content-rich tweets in terms of vocabulary entropy and fraction of unique tweets, and more shares on Facebook for the same level of tweets.
By going deeper into the first few hours after publication of News articles, we found three distinctive response pat-terns in a roughly 80:10:10 proportion: decreasing traf-fic, steady or increasing traftraf-fic, and rebounding traffic. We found that there can be multiple causes for non-decreasing traffic, including the addition of new content to articles, social media reactions, and other types of referrals.
We have shown that social media signals can improve by a large margin the accuracy of predictions of future visits, as well as the accuracy of predictions of article shelf-life. In particular for In-Depth articles which ex-hibit more complex visit patterns over time, we have found that incorporating measures of the quantity and variety of social media reactions can lead to substantial gains in terms of prediction accuracy.
Practical significance. From the perspective of a news provider, while no automatic system can replace editorial judgment, understanding and predicting the life cycle of stories has three main benefits:
• In the case of News stories, knowing how the audi-ence is interacting with an article is not just “nice to have”, but increasingly a critical component in deliv-ering timely and relevant content to an ever growing online audience.
• For In-Depth stories, which operate on a slower news cycle, knowing when to allocate additional time and resources can significantly improve the news planning process. This is particularly useful for an emerging class of news programmes that combine live online dis-cussions with more traditional TV coverage.
• To a web producer, an article with a longer shelf-life means judicious time can be spent preparing back-grounder pieces which are valuable in providing con-text to a story. From a reach perspective, articles with steady or increasing levels of traffic translate into higher user engagement.
Our work depends on having access to a large repository of social media reactions. As more people get into social media (e.g. Twitter), this line of work will become more relevant and will be able to produce even higher quality predictions.
Limitations and future work. We combine findings from computer science, journalism, and media studies. The research presented here is more difficult to execute than the traditional single-discipline study, but we ex-pect interdisciplinary work on this area to become in-creasingly common as our media and technology con-tinue to converge.
Our data gathering system collects only aggregate in-formation and does not attempt to link actions across sessions or users across platforms; this prevents us from separating post-read from pre-read sharing, an impor-tant distinction explored in [1]. Another limitation of
our work is that we used data from a single website, and we are in the process of gathering data from other sources in order to strengthen our claims. We also used a manual process for categorization of the article classes (decreasing/steady/increasing/rebounding), and we did not attempt a comprehensive content-based classifica-tion of articles inside each class.
In this work, we used linear models and did not attempt anything more sophisticated. We do not claim that our models are the more accurate that can be built using this data, but used them to demonstrate in a clear way the importance of social media signals for the predictive tasks we undertake. Better models are definitively pos-sible, and may yield even larger gains in accuracy when incorporating social media signals.
We also used a data-driven approach in which shelf-life is derived from observations. Alternatively, shelf-life can be derived by fitting a visitation curve produced by a parametrized model [29]. This may lead to an improve-ment in the prediction accuracy.
Reproducibility. The data sample used for this study, including feature vectors and the categorization of arti-cles done during the qualitative analysis, is available for research purposes upon request. A live demo is available at http://fast.qcri.org/
Acknowledgments. The authors wish to thank Al Jazeera English for the data used for this study, Ki-ran Garimella from QCRI for his work in the live sys-tem, Janette Lehmann from Yahoo! Research for her valuable help and comments on an early version of this manuscript; Michael K. Martin and Ju-Sung Lee from Carnegie Mellon University for insightful discussions on regression models; and Edward Schiappa for his feedback on the methodology for the analysis of article classes. Key references: [7, 27]
7. REFERENCES
1. Agarwal, D., Chen, B. C., and Wang, X. Multi-faceted ranking of news articles using post-read actions. In Proc. of CIKM, ACM (2012), 694–703.
2. Ahmed, M., Spagna, S., Huici, F., and Niccolini, S. A peek into the future: predicting the evolution of popularity in user generated content. In Proceedings of the sixth ACM international conference on Web search and data mining (New York, NY, USA, 2013), 607–616.
3. Aikat, D. News on the web. Convergence: The International Journal of Research into New Media Technologies 4, 4 (Dec. 1998), 94–110.
4. Bandari, R., Asur, S., and Huberman, B. A. The pulse of news in social media: Forecasting popularity. Feb. 2012.
5. Bitly Science Team. You just shared a link. how long will people pay attention? The Bit.ly blog, Sept. 2011.
6. Bitly Science Team. Halflife by topic. The Bit.ly blog, Nov. 2012.
7. Brody, T., Harnad, S., and Carr, L. Earlier web usage statistics as predictors of later citation impact: Research articles. J. Am. Soc. Inf. Sci. Technol. 57, 8 (June 2006), 1060–1072.
8. Crane, R., and Sornette, D. Robust dynamic classes revealed by measuring the response function of a social system. PNAS 105, 41 (October 2008), 15649–15653.
9. Dezs¨o, Z., Almaas, E., Luk´acs, A., R´acz, B., Szakad´at, I., and Barab´asi, A. L. Dynamics of information access on the web. Physical Review E (Statistical, Nonlinear, and Soft Matter Physics) 73, 6 (2006), 066132+.
10. Figueiredo, F., Benevenuto, F., and Almeida, J. M. The tube over time: characterizing popularity growth of youtube videos. In Proc. of WSDM, ACM (2011), 745–754.
11. Galtung, J., and Ruge, M. H. The structure of foreign news. Journal of Peace Research 2, 1 (1965), 64–91.
12. Gharan, S. O., Ronaghi, F., and Wang, Y. What memes say about the news cycle? Tech. rep., Stanford University, 2010.
13. Gruhl, D., Guha, R., Kumar, R., Novak, J., and Tomkins, A. The predictive power of online chatter. In Proc. of KDD, ACM (2005), 78–87.
14. Hu, Y., John, A., and Seligmann, D. D. Event analytics via social media. In Proc. of SBNMA, ACM (2011), 39–44.
15. Huang, S., Chen, M., Luo, B., and Lee, D. Predicting aggregate social activities using Continuous-Time stochastic process. In Proc. of CIKM 2012 (2012).
16. Kim, S.-D., Kim, S.-H., and Cho, H.-G. Predicting the virtual temperature of Web-Blog articles as a measurement tool for online popularity. In
Computer and Information Technology (CIT), 2011 IEEE 11th International Conference on, IEEE (Aug. 2011), 449–454.
17. Lakkaraju, H., and Ajmera, J. Attention prediction on social media brand pages. In Proc. of CIKM, ACM (2011), 2157–2160.
18. Lee, J. G., Moon, S., and Salamatian, K. An approach to model and predict the popularity of online contents with explanatory factors. In IEEE Conference on Web Intelligence (2010).
19. Lehmann, J., Gon¸calves, B., Ramasco, J. J., and Cattuto, C. Dynamical classes of collective attention in twitter. In Proc. of WWW, ACM (2012), 251–260.
20. Lerman, K., and Hogg, T. Using a model of social dynamics to predict popularity of news. In Proc. of WWW, ACM (2010), 621–630.
21. Lotan, G. Big data for breaking news: Lessons from #aurora, colorado. Tech. rep., SocialFlow, Aug. 2012.
22. Lotan, G., Gaffney, D., and Meyer, C. Audience analysis of major news accounts on twitter. Tech. rep., SocialFlow, Aug. 2011.
23. Myers, S. A., Zhu, C., and Leskovec, J. Information diffusion and external influence in networks. In Proc. of KDD, ACM (2012), 33–41.
24. Pinto, H., Almeida, J. M., and Gon¸calves, M. A. Using early view patterns to predict the popularity of YouTube videos. In Proc. of WSDM, ACM (2013), 365–374.
25. Romero, D. M., Meeder, B., and Kleinberg, J. Differences in the mechanics of information diffusion across topics: Idioms, political hashtags, and ComplexContagion on twitter. In Proc. of WWW (2011).
26. Ruan, Y., Purohit, H., Fuhry, D., Parthasarathy, S., and Sheth, A. Prediction of topic volume on twitter. In WebSci (short papers) (2012). 27. Szabo, G., and Huberman, B. A. Predicting the
popularity of online content. Communications of the ACM 53, 8 (Aug. 2010), 80–88.
28. Tatar, A., Leguay, J., Antoniadis, P., Limbourg, A., de Amorim, M. D., and Fdida, S. Predicting the popularity of online articles based on user comments. In Proc. of WIMS, ACM (2011). 29. Wu, F., and Huberman, B. A. Novelty and
collective attention. PNAS 104, 45 (Nov. 2007), 17599–17601.
30. Yang, J., and Leskovec, J. Patterns of temporal variation in online media. In Proc. of WSDM, ACM (2011), 177–186.
31. Yin, P., Luo, P., Wang, M., and Lee, W. C. A straw shows which way the wind blows: ranking potentially popular items from early votes. In Proc. of WSDM, ACM (2012), 623–632.
32. Yu, B., Chen, M., and Kwok, L. Toward predicting popularity of social marketing messages. In Social Computing, Behavioral-Cultural Modeling and Prediction, J. Salerno, S. J. Yang, D. Nau, and S. K. Chai, Eds., vol. 6589 of LNCS, Springer (2011), 317–324.
APPENDIX
A. EXAMPLE ARTICLES
List of articles in the non-majority classes described in the qualitative assessment of Section 4.2. The data sam-ple is available for research purposes upon request. Delayed decreasing:
Hurricane Sandy moves up US Atlantic coast - Americas Skydiver lands safely after record jump - Americas Third-party candidates spar in US debate - Americas Arrests by French police foiled ’bomb plot’ - Europe Scotland’s independence referendum signed - Europe Rival protesters clash in Egypt’s capital - Middle East Syria opposition ’captures’ Assad soldiers - Middle East
Steady:
Bomb attack hits northern Nigerian church - Africa Libya assembly elects new prime minister - Africa Police admit ’overreacting’ at Marikana - Africa Marking the Cuban missile crisis - Americas Obama and Romney face off in final debate - Americas Obama and Romney meet in combative debate - Americas Poll finds fresh increase in US racism - Americas US exports to Iran soar despite sanctions - Americas Asad Hashim: Ask Me Anything on Malala - Central & South Asia Clerics declare Malala shooting ’un-Islamic’ - Central & South Asia India suspends Kingfisher licence - Central & South Asia
Pakistani schoolgirl Malala arrives to UK - Central & South Asia Profile: Malala Yousafzai - Central & South Asia
Teenage rights activist shot in Pakistan - Central & South Asia Italian seismologists could face jail term - Europe
Karadzic to begin Srebrenica defence at Hague - Europe Russia says fighters killed in North Caucasus - Europe Scientists found guilty in Italy quake trial - Europe Bomb blast hits Damascus’ Old City - Middle East Fatah claims victory in West Bank poll - Middle East Fighting dims hopes for Syria Eid truce - Middle East Hariri calls on Lebanese to attend funeral - Middle East Israel strikes Gaza after Hamas retaliation - Middle East Marginalisation of disabled people in Egypt - Middle East Palestinians vote in municipal elections - Middle East Rights group says Syria used cluster bombs - Middle East Syrian children killed in Idlib air raids - Middle East US and EU urge political stability in Lebanon - Middle East
Increasing:
Colombia and FARC rebels launch negotiations - Americas Immigrant family in pursuit of American Dream - Americas Living the modern ’American Dream’ - Americas
Man charged over attempted US bank bomb plot - Americas Minors flee Central American violence - Americas Anti-austerity protests erupt in Athens - Europe Lithuanians vote out austerity government - Europe Scientists await verdict in Italy quake trial - Europe Assault on Yemen base blamed on al-Qaeda - Middle East Qatari emir in historic Gaza visit - Middle East
Rebounding:
African and EU leaders to hold Mali summit - Africa Evidence of mass murder after Gaddafi’s death - Africa Nigerian soldiers kill dozens of civilians - Africa State-linked Libyan militias shell Bani Walid - Africa Tunisia clash leaves opposition official dead - Africa UN urges military action plan for Mali - Africa Wounded Mauritania president flown to Paris - Africa Argentine crew to vacate ship seized in Ghana - Americas Armstrong ’unaffected’ by doping report - Americas Biden and Ryan set for crucial VP debate - Americas Brazil forces set for raid on Rio slums - Americas Candidates spar in US vice president debate - Americas Cuba’s Castro appears in public - Americas
First planet with four suns discovered - Americas Forecasters predict ’serious’ Hurricane Sandy - Americas Hurricane Sandy approaches eastern US - Americas Tsunami warning for Hawaii lifted - Americas
US deficit tops $1 trillion for fourth year - Americas US East Coast prepares for Hurricane Sandy - Americas
Dozens dead in Afghanistan Eid suicide blast - Central & South Asia Pakistan court probes bartering of girls - Central & South Asia Pakistan teen activist in critical condition - Central & South Asia Berlusconi vows to remain in political arena - Europe
Boxer a big hit as Ukraine readies for vote - Europe EU leaders agree on banking supervisor - Europe Germany’s Merkel reassures Greece - Europe
Merkel arrives in Greece amid tight security - Europe Russia demands Turkey explain intercepted jet - Europe Russian opposition aide arrested - Europe
Baghdad area hit by more deadly Eid attacks - Middle East Eid truce awaits Syrian government response - Middle East Kuwait police fire tear gas at protesters - Middle East Syrian forces continue to shell Aleppo - Middle East