Ministry of Higher Education and Scientific Research Ahmed Draia University - ADRAR
Faculty of Science and Technology
Department of Mathematics and Computer Science.
Master Thesis in Computer Science
Specialty:
Intelligent Systems
Topic:
Prepared by
TABBI Amina & SABOU Imane
Academic year: 2019/2020
Jury Member composed of :
President :
Examiner:
Supervisor:
DEMRI Mohammed
RABHI Sedik
Mr. Djilali CHOGUEUR
i
The electricity demand increases by the increasing of population which causes
several problem in the grid .and the use of conventional resource became a danger
on the environment and the humans.
In this case, the use of renewable energy will be very beneficial by integrated
in the smart grid.
In this project, we made a simulation to test the performance of the AODV
as reactive protocol and DSDV as proactive protocol.
Key words : renewable energy ;smart grid ; energy ; routing protocols,AODV,
DSDV .
صخلم
ي
مادختسا نأ امك ، ةكبشلا يف لكاشم ةدع ببسي امم ناكسلا ددع ةدايز عم ءابرهكلا ىلع بلطلا دادز
ةيديلقتلا رداصملا
ناسنلاا و ةعيبطلا ىلع ارطخ لكشي حبصأ
.
نوكيس ةلاحلا هذه يف
اًدج اًديفم ةددجتملا ةقاطلا مادختسا
.ةيكذلا ةكبشلا عم اهجمد للاخ نم
لوكوتوربلا نم لك ءادأ ةبرجتل ةاكاحمب انمق عورشملا اذه يف
لعفلا در لوكوتورب AODV و
يقابتسا لوكوتورب DSDV
تاملكلا
ةيحاتفملا
:
, ةددجتملا ةقاطلا
هيجوتلا تلاوكوتورب , ةقاطلا , ةيكذلا ةكبشلا
: . AODV , DSDVii
Acknowledgement
In
the name of ALLAH the most Merciful
gracious ; all praise belongs to him for the
continuous belessing upon the thought our
life.
Our faith in him kept us strong even when we
face a lot of circumstances .thank you Allah.
We would like to thank our supervisor Mr.
CHOGEUR.Abdeldjalil for his guidance and
encouragement. Special thanks to Mr.Demri
mohammed for his support .to Kheirallah
Meriem for her precious help .
Special thank for our parents and our family
who have continuously encouraged us
through all our way of studies.
iii
Dedication
To my parent
My sisters ‘’Sara , Fatima ‘’
My brothers ‘’Saif, Noreddine ,
mohammed ‘’
My lovely friends
‘’ YOUCFI Fatiha & her twins ‘’
‘’ HATTASSA Mebarka ’’
To the best colleague “TABBI Amina “
iv
Dedication
to my loving mother
to my sister and my brothers”Soumia,Khalil,Haider
and Mokhtar”
to my cuties brother's daughters ”Rinad and Maria”
to my best friends “ Fatiha ,Souaad and Ichrak “
To the best colleague “Sabou Iman “
Amina
v Abstract ... i Acknowledgments………..…… ii Dedication ... iii Dedication ... iv Table of Contents ... v
List of Figures ... viii
List of Tables. ... x
Glossary ... xi
General Introduction ... 1
CHAPTER 1:
R
ENEWABLEE
NEGY 1.1 Introduction…. ... 41.2 Renewable energy definition ... 4
1.2.1 Energy definition ... 4
1.2.2 What is renewable energy ... 4
1.3 Renewable energy types ... 5
1.3.1 Hydropower ... 5
1.3.2 Biomass ... 6
1.3.3 Geothermal ... 7
1.3.4 Solar Energy ... 8
1.3.5 Wind Power ... 9
1.4 Comparative statistic of renewable energy use throughout the world ... 10
1.5 Why use renewable energy ... 11
1.5.1 Fossil Fuels Are Limited ... 11
1.5.2 Carbon Emissions & Climate Change ... 10
1.5.3 Energy Security ... 12
1.5.4 Economic Stability ... 13
1.5.5 Environment Damage ... 14
1.5.6 Environment Damage ... 14
1.6 the world's most used renewable power sources ... 14
1.6.1 Advantages of Hydropower ... 15
1.7 Potentiel and obstacles for renewable energy technologies ... 16
1.8 conclusion ... 17
CHAPTER 2:SMART GRID 2.1 Introduction ... 91
2.2 understanding the grid ... 91
2.3 smart grid definition ... 91
vi
2.4.3 Accommodates all generation and storage options ... 22
2.4.4 Enables new products, services and markets ... 22
2.4.5 Optimizes asset utilization and operating efficiency ...….... 22.
2.4.6 Provides resiliency to disturbances, attacks and natural disasters……..23
2.4.7 Scalability of the system and devices ………... 22
2.4.8 Upgrades to the grid may be delayed or avoided ………..………...….22
2.5 Home energy management system………22
2.6 Components of Smart Grid……… 22.
2.6.1 smart appliances ………...22
2.6.2 smart meters ……….22
2.6.3 smart substaions ………...27
2.6.4 synchro phasors……….………...22
2.7 advantages of smart grid ……….21
2.7.1 intelligent ... 21 2.7.2 Efficient ... 21 2.7.3 Accommodationg ... 21 2.7.4 Motivating………..………21 2.7.5 Opportunistic ... 23 2.7.6 Quality-focused ... 23 2.7.7 Resilient ... 23 2.7.8 Green ……….………23
2.8 Security in smart grid ... 23
2.9 Conclusion……… 22..
CHAPTER 3:IMPLEMENTATION AND RESULT 3.1 Introduction ... 22
3.2 Classification of ad hoc routing protocols ……….……….…22
3.2.1 On-demand Routing Protocols ... 22
3.2.2 Tbale driven routing prortocols ... 22
3.3 the characterestic of AODV routing protocol ... 22
3.4 Smart grid communication network hierarchy ... 27
3.4.1 Home Area Network (HAN) ... 27
3.4.2 Neighbourhood Area Network (NAN) ... 27
3.4.3 Wide Area Network (WAN)………...38
3.5NS2 simulator presentation ... 28
3.5.1 NS definition ... 28
3.5.2 Basic architecture of NS2 ... 39
3.5.3 Why does NS2 use two languages………..………..………..39
3.5.5 Results visualization……….40
3.6 scenario of smart homes simulation ... 42
3.7 Routing across network ... 44
3.8 Simulation analyzes and discussion ... 45
vii
3.8.2.1 Energy Consumed ... 47
3.8.2.2 Packet Delivery Ratio ... 47
3.8.2.3 Throughput …..………..………..………47
3.8.3 Results and Analyzes ... 47
3.9 Conclusion ... 50
General Conclusion ... 52
viii
List of figures
Chapter 1
Figure 1.1: Construction of Hydropower Project………..5
Figure 1.2: Biomass energy………...6
Figure 1.3 Renewable Geothermal Energy………..7
Figure 1.4: Solar energy available in the United States………...8
Figure 1.5 Combining wind & water for energy production & storage………..9
Figure 1.6: Global renewable energy consumption 1965 to 2017………...15
Figure 1.7: Renewable share of primary energy supply in 2009……….16
Chapter 2
Figure 2.1: The overall smart grid concept……….20Figure 2.2: Transition from the present grid to a smart grid………21
Figure 2.3: A general model of the smart grid………25
Figure 2.4: Smart grid components………..25
Figure 2.5: Smart home appliances………..26
Figure 2.6: Smart meters………..27
Figure 2.7: Direct monitoring and control of smart grids for several substations………...28
ix
Figure 3.1: The diagram of AODV routing protocol………36
Figure 3.2: Smart grid communication network consisting of HAN, NAN and WAN……38
Figure 3.3: NS2 Architecture………39
Figure 3.4: Trace File Format………..…..40
Figure 3.5: Nam interface………..……41
Figure 3.6: XGraph plot……….42
Figure 3.7: scenario of delivering messages through AMI to smart homes in smart grid…..43
Figure 3.8: simulation model of the energy control network in smart homes………...44
Figure 3.9: sequence organigram of data transmission………..44
Figure 3.10: deployment model……….……..45
Figure 3.11: wireless communication by several hops between nodes……….……..46
Figure 3.12: Comparison between energy consumption of AODV vs DSDV…….…...….48
Figure 3.13: Comparison of packet delivery ratio between AODV and DSDV…………...49
x
List of Tables
Chapter 1
Table 1.1: Totale capacity of renewable energy………11 Table 1.2
Totale production of renewable energy………11
Chapter 2
Table 2.1: Comparaison of traditional grid and smart grid ………..22
Chapter 3
xi
AMI : Advanced Metering Infrastructure.
AODV : Ad-hoc On Demande Distance Vector.
DSDV: Destination Sequenced Distance Vector.
DG : Distributed Energy.
DER: Distributed Energy Resource.
EPRI : Electric Power Research Institute.
EMS: Energy Management System.
FM: Frequency Modulation.
HAN: Home Area Network.
IEC : International Electro technical Commission.
IRENA : International Renewable Energy Agency
.IEA : International Energy Agency.
A
E
D
I
F
H
M
xii
NAN: Neighbourhood Area Network.
PV : PhotoVoltaic.
PMU: Phasor Measurement Unit.
RBDS: Radio Broadcasting Data System.
RES : Renewable Energy Systems
SG : Smart Grid.
SCADA: Supervisory Control and Data Aquisition.
TW : TeraWatt.
UK: United Kingdom.
US :
United States .
WAN: Wide Area Network.
P
R
S
N
T
U
W
1
General introduction
The electric power grid is one of the largest and most complex infrastructures ever built by mankind. Modern civilization depends on it for industry production, human mobility, and comfortable living. However, many critical technologies such as the 60 Hz transformers were developed at the beginning of the 20th century and have changed very little since then.
The traditional unidirectional power from the generation to the customer through the transmission-distribution grid has also changed nominally, but it no longer meets the need of the 21st century market energy customers. A move towards a true digital grid is needed. Such a digital smart grid requires a tight integration of the physical layer (energy and power) with digital and cyber information to allow an open and real time market akin to the world of e-commerce. Another major factor that is pushing for this radical transformation are the rapidly changing patterns in energy resources ownership and load flow.
Smart grid (SG) is combination of power resources and communication and information technologies into the electricity grid. Main components of smart grid are sensors, smart meters, monitoring system and data management systems which controlled the flow of information between the different stakeholders. Smart grid represents a huge network of computers, routers, switches, smart meter, house application, wireless sensor, renewable energy resources, and electrical vehicles. Smart grid applications need to communication between heterogeneous environments so they need to use routing protocols to accomplish their work. Ad hoc on demand Distance Vector (AODV) developed initially for Mobile Ad Hoc Networks (MANETs) and after the improvements it used for smart grid applications by selecting the best path between smart grid sensors to exchange reliable data. In MANETs, communication between mobile nodes always requires routing over multi-hop paths. Since the node mobility may cause frequent link failure, we proposed the nodes are fixed (the smart homes ) . in order to Perform a Comparison of AODV, DSDV Routing Protocols.
We start by giving generalities on renewable energy (solar ,wind, thermal) in the first chapter then we introduce the technology of smart grid and it’s characteristic ; different component; The security in smart grid.
2
finally in the third chapter we talked about the implementation and the result that we obtained from the comparison of AODV and DSDV protocol .
Chapter I
4
1.1 Introduction :
this chapter aims to provide an overview of renewable energy systems (RESs) and the underlying issues related to the RES theme such as the energy definition . the deferent types of
renewable energy systems are briefly discussed focusing on their characteristics and giving an examples of the most known power plants in the world. This followed by the answer of why do we need the renewable energy by the most important aspects such as environmental damage and public health . This chapter also discusses the world’s most used renewable power sources and its advantages .
1.2 Renewable energy definition
1.2.1 Energy definition
duo to oxforddictionaries energy can be defined as: ‘‘The strength and vitality required for sustainedphysical or mental activity.’’ Or: ‘‘Power derived from the utilization of physical orchemical resources, especially to provide light and heat or to work machines.’’. From that point we continue the definition of energy by stating its types: it exists two types of energy that have common points such that they are both natural resources but the first is limited, and we name that one Non-renewable energy. The second is the opposite unlimited resource, we name it renewable energy. [1]
1.2.2 What is renewable energy :
Renewable energies (or renewables) are ways to generate energy from (theoretically) unlimited natural resources. These resources are either available with no time limit or replenish more quickly than the rate at which they are consumed.
Renewable energies are also often referred to as “green energies” or “clean energies”. Still, this doesn’t mean that these energies aren’t harmful to the environment and have zero impact. Nonetheless, they have a low environmental impact compared to fossil fuels. That’s why they’re increasingly becoming important elements in companies’ CSR strategies in termsof sustainable development.
There are several types of renewable energies that are produced by different sources such as the sun, wind or water. In fact, these renewables’ power consumption has been growing over the last year. They have provided 8% of the world’s electricity in 2017 and they now cover 1/3 of
5
the power mix in Europe. At the same time, the energy grid gets 1/4 of the total energy in China and 1/6 in the United States, India, and Japan. Let’s learn more about them below . [2]
1.3 Renewable energy types :
1.3.1 Hydropower:
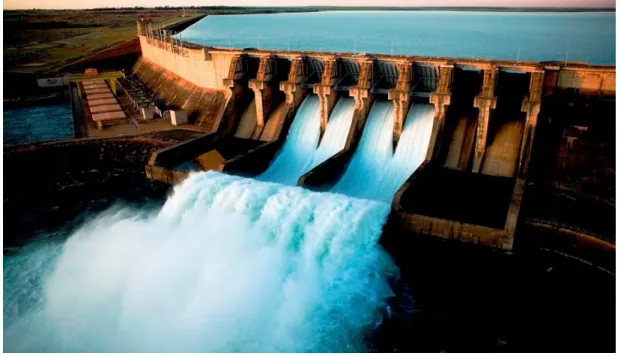
Hydropower represents one of the oldest and largest renewable power sources and accounts for close to 10% of our nation’s electricity. Existing hydropower capacity is about 80,000 megawatts (MW – one million watts or one thousand kilowatts). Hydropower plants convert the energy of flowing water into electricity Figure1. This is primarily done by damming rivers to create large reservoirs and then releasing water through turbines to produce electricity. Hydropower results in no emissions into the atmosphere but the process of damming a river can create significant ecological problems for water quality and for fish and wildlife habitat. [3]
Figure 1.1: Construction of Hydropower Project Examples of hydro-electric power in the world :
The Sihwa Lake Tidal Power Station in South Korea. This is the world’s biggest tidal power installation and it has a capacity of 254 MW;
The Rance Tidal Power Station in Brittany, France, has a 240 MW capacity;
The Three Gorges Dam in China is the world’s largest power station in terms of installed capacity (22,500 MW). [2]
6
1.3.2 Biomass :
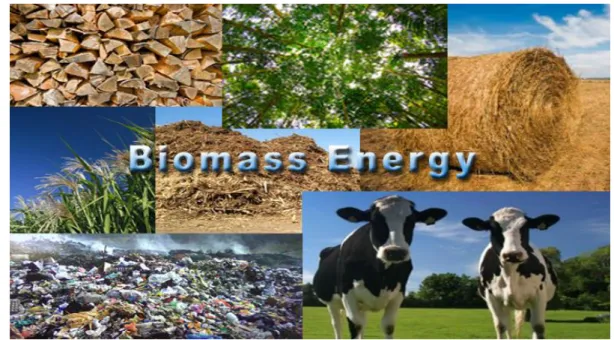
Biomass is second to hydropower as a leader in renewable energy production. Biomass has an existing capacity of over 7,000 MW. Biomass as a fuel consists of organic matter such as industrial waste, agricultural waste, wood, and bark. Biomass can be burned directly in specially designed power plants, or used to replace up to15% of coal as a fuel in ordinary power plants. Biomass burns cleaner than coal because it has less sulfur, which means less sulfur dioxide will be emitted into the atmosphere. Biomass can also be used indirectly, since it produces methane gas as it decays or through a modern process called gasification. Methane can produce power by burning in a boiler to create steam to drive steam turbines or through internal combustion in gas turbines and reciprocating engines. The largest use of biomass energy in Virginia is the forest products industry. Furniture plants, sawmills, and paper mills usually burn their wood waste to produce heat and electricity. Many homeowners use firewood or pellets for winter heat. [3]
Figure 1.2 : biomass energy Examples of biomass energy in the world
Some of the most known biomass power plants in the world are:
The Iron Bridge power station in the UK, with a capacity of 740MW. It uses wood pellets as the main fuel;
The Alholmenskaft power station in Finland. It has a 260MW energy generation capacity;
The Polaniec power plant in Poland that uses mainly agricultural by-products and wood residues. It has a 205MW capacity. [2]
7
1.3.3 Geothermal
Geothermal power plants use high temperatures deep underground to produce steam, which then powers turbines that produce electricity. Geothermal power plants can draw from underground reservoirs of hot water or can heat water by pumping it into hot, dry rock. High underground high temperatures are accessed by drilling wells, sometimes more than a mile deep. In one sense, this geothermal energy is not renewable, since sometime in the future the core of the earth will cool. That time is so far off (hundreds of millions of years) that that we think of it as renewable. Most geothermal power plants are located in the western United States, but some costal regions of Virginia (near Wallops Island) have geothermal power potential. Geothermal heat pumps use compressors to pump heat out of the earth (for winter heating) or into the earth (when running as air conditioners in summer). The energy they pump into and out of the earth is renewable, since it is replaced by the cycle of the seasons. The energy that runs the compressor can either be renewable or conventional. [3]
Figure 1.3 : Renewable Geothermal Energy Examples of geothermal energy in the world
The Darajat Power Station in Indonesia has 3 plants with a total capacity of 259MW;
The Malitbog Geothermal Power Station in the Philippines has a capacity of 232MW;
The Hellisheidi Geothermal Power Station in Iceland has a capacity of 400MW of thermal energy;
8
1.3.4 Solar Energy
Solar energy comes directly from the power of the sun and is used to produce electricity, to produce heat, and for light. Solar-electric power can be produced either by power plants using the sun’s heat or by photovoltaic (PV) technology, which converts sunlight directly to electricity using solar cells. PV technology is more practical for residential use.
Systems to use the heat of the sun directly can be either active or passive. In active systems, air or liquid circulate through solar collectors and bring heat to where it is used. In passive systems, buildings are built with windows and heat-absorbing surfaces set up to maximize solar heating in winter. Either technology is suitable for residential use. [3]
9
Examples of solar energy in the world
It’s estimated that in 2017 1,6% of the worldwide generated energy came from solar sources. At the same time, solar power also contributed to 20% of the total energy growth in this same year. Some of the most known sources of solar energy are:
The Kurnool Ultra Solar Park in India. It has a total generation capacity of 1000MW and over 4 million solar panels installed;
The Longyangxia Solar Park in China that has a total capacity of 850MW and covers around 25sq km.
The Kamuthi Solar Facility in India: it has a total capacity of 648MV and covers 10sq km [2]
1.3.5 Wind Power
The wind power is another renewable energy. Here, the wind’s kinetic energy makes turbines spin and creates a mechanical movement. Afterward, a generator transforms this mechanical energy into electricity. There are several types of wind renewable energies: onshore wind turbines, off-shore wind turbines and even floating wind turbines. B ut the operating principles are basically the same for all these types of wind-generated energy. [2]
10
Examples of wind power in the world
Wind power continues has also been growing, In fact, it provided 4.4% of global power generation in 2017. The highest installed wind capacity belongs to China (164GW). At the same time, in the EU, wind power provides 15% or more of the energy generated in several countries such as Germany, Portugal or Lithuania. Some of the most known sources of wind power energy are:
The Gansu Wind Farm in China. It is still under construction and it will be able to produce 20,000MV of power by 2020;
The onshore Muppandal Wind Farm in India with a capacity of 1,500MW and over 3000 turbines;
The Alta Wind Energy Center in the U.S. with a total capacity of 1,548MW that’s expected to reach 3,000MW by 2040;
The Walney Extension in the UK. It has a total capacity of 659MW and it’s the world’s largest offshore farm. [2]
1.4 Comparative statistic of renewable energy use throughout
the world:
This part of the study provides a brief statistic published by The International Renewable Energy Agency (IRENA) on the comparison of renewable energy use in Africa, produces comprehensive, reliable data sets on renewable energy capacity and use worldwide. Renewable Energy Statistics 2020 provides data sets on power-generation capacity for 2010-2019, actual power generation for 2010-2018
The renewable power capacity data shown in these tables represents the maximum net generating capacity of power plants and other installations that use renewable energy sources to produce electricity. For most countries and technologies, the data reflects the capacity installed and connected at the end of the calendar year. Pumped storage is included in total capacity but excluded from total generation. The capacity data are presented in megawatts (MW) and the generation data are presented in gigawatt-hours (GW/h). [6]
11 Capacity (MW) 2010 2011 2012 2013 2014 2015 2016 2017 2018 2019 Africa 27 330 27 760 28 748 30 945 32 965 35 287 35 287 42 729 46 466 48 446 Asia 387 287 433 478 478 468 551 810 628 524 716 985 808 944 915 183 1 023860 1 119 265 Europe 264 700 302 632 335 520 358 504 378 444 401 941 423 334 445 800 467 710 497 267 Middle-east 12 133 12 556 13 218 14 092 15 595 6 929 17 773 18 803 20 373 23 137 North America 232 124 242 939 262 768 271 985 285 786 307 701 331 179 348 558 368 956 391 241 South America 146 538 150 982 154 95 160 133 169 268 178 783 193 325 202 301 212 666 220 986
Table 1.1 Totale capacity of renewable energy
Production (GW/H) 2010 2011 2012 2013 2014 2015 2016 2017 2018 Africa 116 683 117 605 120 912 128 329 137 194 141 190 143 010 152 394 160 236 Asia 1 272 708 1 320 815 1 564 260 1 687 988 1 914 705 2 043 364 2 227 197 2 424 481 2 643 589 Europe 899 180 885 307 1 004 14 1 094 101 1 135 631 1 173 180 1 194 346 1 208 734 1 297 883 Middle-east 18 294 21 194 22 268 24 532 21 233 20 899 26 683 26 340 26 605 North America 857 471 971 050 958 087 1 002 811 1 033 620 1 040 559 1 119 942 1 202 235 1 226 317 South America 711 340 758 335 749 796 735 286 736 330 732 966 780 189 783 711 794 164
Table 1.2 Totale production of renewable energy
1.5 Why use renewable energy:
1.5.1 Fossil Fuels Are Limited
The first and main reason for why governments and businesses are keen to move to renewable energies as soon as possible is that fossil fuels are a finite resource. We may or may not have reached peak oil - the point at which demand outstrips supply -and by current figures, many experts seem to agree we did so around 2008 with only external factors creating
12
fluctuations in demand making it difficult to predict precisely when it will run out. That is another debate entirely that our politicians and economists have argued for decades, and will continue to argue for many years to come. Whichever way we look at it, fossil fuels will run out eventually and it will take some 10,000,000 years to replenish what we have used in around 150 years.
As the human population increases, our rate of consumption of these fossil fuels also increases. Geologists and others whose job it is to locate and access these pockets of crude oil are finding it increasingly difficult to locate and extract new sources. Whether we have 1 year or 100 years left of oil, many argue that what is left should remain in the ground because it is not sustainable - it will run out eventually and so we should prepare for a post-fossil fuel world now.
1.5.2 Carbon Emissions & Climate Change
The most immediate problem, particularly in light of the COP21 agreement of 2016, and the changes we have seen to the climate in the last 150 years, is climate change and the carbon emissions that are forcing it . In the last few years especially, no part of the world has been untouched by freak weather conditions. Most continents have recorded record high temperatures in summer, record lows in winter and increased frequency of typhoons and hurricanes, record dry spells, drought and flooding. There is no doubt that these freak weather conditions are affecting every country .
Most renewable energy sources, and the technology used to harness them, are low carbon emission. In most cases, once installed they have minimal or no carbon output and can still provide our energy needs. We can never go fully carbon neutral as it takes resources to make a solar panel, build a dam and so on, but it is a critical and significant reduction of our carbon output. What we do need to do, is to take the steps we can to reduce our carbon footprint for international regulations, to help those in the developing world, and to protect ourselves against the freak weather. We also know that the ice caps are melting and the sea levels are rising which creates food shortages and national instability as well as being an expensive situation for our insurance.
1.5.3 Energy Security
Energy security is a relative newcomer to public perception when we consider the greater need for renewable energy . The beginning of this decade has seen instability in the Middle
13
East. The Arab Spring swept across Algeria, Tunisia, Libya, Egypt and Syria leading to pro-democracy demonstrations. There are ongoing problems in Syria with the rise and spread of ISIS. Why have these political issues in other parts of the world encouraged the rest of the world to think about its energy plan?
The Middle East is one of the biggest suppliers of oil to the world. South America also produced oil, North America and South America supplies coal and the UK, Russia and other European Atlantic powers mine for gas. New tension between Russia and the west, firstly over Ukraine and secondly over Syria, has led to increased distrust between world powers. Being dependent on other countries for our energy supply is problematic in itself, but when international relations between supplier and supplied sour, increased wholesale prices threatening to destabilize the economy is the least that could happen . If a supply is cut off, then disaster could strike. For this reason alone, we need spare capacity and multiple avenues of energy acquisition.
Energy security will become a much greater factor as fossil fuels begin to dwindle. More than ever before, demands on energy supply often outstrip supply of conventional production forcing prices up . It is expected that increased tension over acquisition and protection of resources could lead to global conflict. Some are already arguing that the crisis in Syria is less about campaign for democracy reform in a major Middle Eastern power, and more a result of ongoing regional climate crisis. Former farmers who have fled to Europe and beyond have cited drought as the major catalyst for the civil war in the country .
The price of oil has fluctuated greatly in the last 10-15 years - from an all-time high in 2012 to 2013 to record lows in 2015 to 2016. Oil prices have a knock on effect for the economy when they are at the extreme and lead to protests .We must remember that oil is a commodity and when prices are erratic, it affects jobs all over the world.
1.5.4 Economic Stability
Related to some of the issues mentioned above, where renewable energy offers a constant and sustained supply (such as hydroelectric, wave power, solar and biofuels), energy prices are likely to remain stable and in turn, keep the economy stable .In many cases, energy produced from renewable sources is already cheaper than that produced by non-renewable means. Mentioned above, Idaho produces a large amount of energy from geothermal sources. Another example is Texas where energy produced from wind power is noticeably cheaper for the state's citizens.
14
1.5.5 Environmental Damage
As fossil fuel supply gets harder to acquire, and prospectors search for new pockets of oil and have to drill longer and deeper to acquire it, there has been conflict between environmental groups and industry and between governments and both groups when local wildlife and environmentally sensitive areas are threatened. Here in the US, public consciousness and the need to protect our wildlife and natural landscapes means that many new developments are protested with concerns of environmental damage. Ongoing protests against fracking and new drilling in Europe and North America and recent examples. Though some renewables will have an environmental impact, many do not and when built, have no further impact - unlike ongoing drilling.
1.5.6 Public Health
Oil, gas and coal drilling and mining have high levels of pollution that are pumped into local environments and the wider atmosphere, so while protestors attempt to prevent the building of pipelines or new prospecting in virgin areas and wilderness, it is as much about public health as it is about conservation. We have known for decades about the knock on effect of industrial processes for public health . Few renewables are entirely emission-free, but their output is much lower than conventional fossil fuel acquisition and processing. [4]
1.6 The world’s most used renewable power sources:
Renewable technologies with exception to traditional biomass are often termed ‘modern renewables’. These include hydropower, solar, wind, geothermal and modern biofuel production (including modern forms of waste-to-biomass conversion).
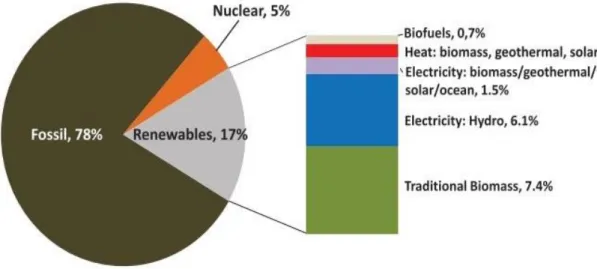
The change & mix of modern renewable consumption over the last 50 years is shown in the chart (figure 6) . This is measured in terawatt-hours per year and can be viewed across a range of countries and regions.
Globally, the world produced approximately 5.9 TWh of modern renewable energy in 2016. This represents a 5 to 6-fold increase since the 1960s. Here we see that hydropower remains the dominant form of modern renewables consumption, accounting for almost 70 percent. Despite absolute growth in production, hydropower’s share is, however, declining as other renewable technologies grow.[5]
15
Figure 1.6: Global renewable energy consumption 1965 to 2017
1.6.1 Advantages of Hydropower:
Hydropower is fueled by water, so it's a clean fuel source, meaning it won't pollute the air like power plants that burn fossil fuels, such as coal or natural gas.
Hydroelectric power is a domestic source of energy, allowing each state to produce their own energy without being reliant on international fuel sources.
The energy generated through hydropower relies on the water cycle, which is driven by the sun, making it a renewable power source, making it a more reliable and affordable source than fossil fuels that are rapidly being depleted.
Impoundment hydropower creates reservoirs that offer a variety of recreational opportunities, notably fishing, swimming, and boating. Most water power installations are required to provide some public access to the reservoir to allow the public to take advantage of these opportunities.
Some hydropower facilities can quickly go from zero power to maximum output. Because hydropower plants can generate power to the grid immediately, they provide essential back-up power during major electricity outages or disruptions.
In addition to a sustainable fuel source, hydropower efforts produce a number of benefits, such as flood control, irrigation, and water supply.
16
1.7 Potential and obstacles for renewable energy technologies :
The potential of renewables to provide all the energy services needed is huge as describe in the Special Report on Renewable Energy Sources and Climate Change Mitigation of the Intergovernmental Panel on Climate Change, published in 2011 (IPCC, 2011 ). Further developing and exploiting renewable energy sources using modern conversion technologies would enhance the world’s energy security, reduce the long-term price of fuels from conventional sources, and conserve reserves of fossil fuels, saving them for other applications and for future generations. It would also reduce pollution and avoid safety risks from conventional sources, while offering an opportunity to reduce greenhouse gas emissions to levels that will stabilize greenhouse gases in the atmosphere, as agreed upon globally. It could also reduce dependence on imported fuels, minimize confl icts related to the mining .
Figure 1.7 Renewable share of primary energy supply in 2009
and use of limited available natural resources, and spur economic development, creating new jobs and regional employment.
But using energy from renewable sources also faces a number of challenges because of their often low spatial energy intensity (J/m²) or energy density (J/m 3 ) compared with most fossil fuel and nuclear energy sources, their generally capital intensive installation costs, their sometimes higher-than-desirable operational costs, and a variety of environmental and social concerns related to their development. An additional important issue is the intermittent character of wind, solar, and several ocean energy, requiring backup system investments or other innovations to secure a reliable energy supply.[7]
17
1.8 Conclusion:
It is clear that there is a strong need to integrate more renewable energy sources into the grid of the future. These kind of energy sources, when coupled with energy storage, can greatly benefit the grid by offering a variety of ancilliary services and daily peak load reductions. Storage technologies will vary according to different renewable energy sources and a greater variety of sources will lead to more grid stability.
All of these things rely on building new and more energy storage systems for renewable energy sources to allow them to be integrated with the grid in many different ways. With the current amount of storage on the grid, renewable energy sources still face a very hard road to full integration with the grid. But it is also worth noting that renewable energy may play a much bigger role in decentralized or distributed power systems (microgrids) than in the gigantic centralized power system we have today.
Chapter II
Smart Grid
19
2.1 Introduction:
The electric industry is poised to make the transformation from a centralized, producer controlled network to one that is less centralized and more consumer-interactive. Is an electrical grid that uses information and communications technology to gather and act on information, such as information about the behaviors of suppliers and consumers, in an automated fashion to improve the efficiency, reliability, economics, and sustainability of the production and distribution of electricity. In this chapter, we presented what is a smart grid and it’s characteristic. Then we talked about the component of a smart grid. We discuss also about the advantages of the smart grid.
2.2 Understanding the “Grid”:
The term grid itself is a bit confusing in that it typically conjures an image of a linear pattern, like the streets of Manhattan or a page of graphing paper. In fact, when people talk about the power grid, what they are actually referring to is a network. This network is made up of generation plants, transmission lines, and transformers -- which convert and distribute high-voltage power into homes.
It is also problematic because "grid" doesn’t really describe scale in any specific way. It can, of course, mean a single chain that goes from a power plant into an individual’s home. It can also mean an entire country -- or continent’s -- power system.
The reality is that the single chain rarely exists anymore. In most places, power from a number of generation plants is carried via a series of transmission lines and transformers and adjusted -- often manually -- to deal with fluctuations in demand and capacity.
Managing this network in a more responsive and efficient way is the goal of the smart grid. [8]
2.3 Smart grid definition:
There are yet no unanimous agreement on the standard definition of a Smart Grid, for it is a concept, which is still under development. The definition of smart grid varies from experts to experts.
For example, The European Union has defined a smart grid as “an electricity network that can cost efficiently integrate the behavior and actions of all users connected to it generators, consumers and those that do both in order to ensure economically efficient, sustainable power system with low losses and high levels of quality and security of supply and safety”. Electric Power Research Institute (EPRI) website offers the following definition “A SG is one that incorporates information
20 and communications technology into every aspect of electricity generation, delivery and consumption in order to minimize environmental impact, enhance markets, improve reliability and service, and reduce costs and improve efficiency”.
The International Electro-Technical Commission (IEC) definition states, “The SG is integrating the electrical and information technologies in between any point of generation and any point of consumption”.
International Energy Agency (IEA) defines “A SG is an electricity network that uses digital and other advanced technologies to monitor and manage the transport of electricity from all generation sources to meet the varying electricity demands of end-users. Smart grids co-ordinate the needs and capabilities of all generators, grid operators, end-users and electricity market stakeholders to operate all parts of the system as efficiently as possible, minimizing costs and environmental impacts while maximizing system reliability, resilience and stability” . [9]
21
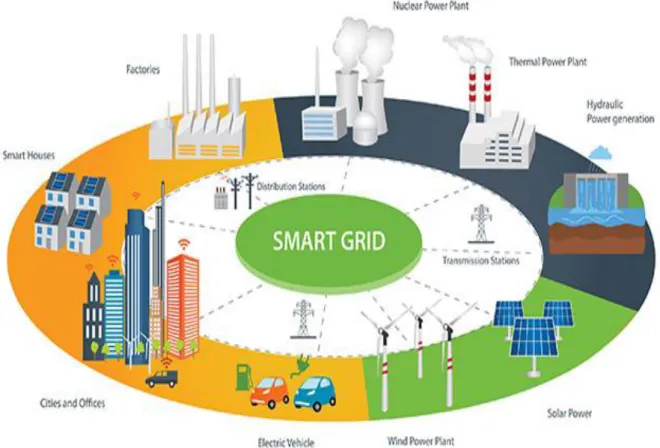
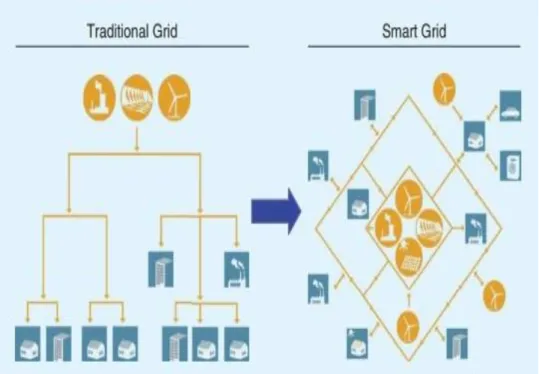
The scope of the smart grid extends over all the interconnected electric power systems, from centralized bulk generation to distributed generation (DG), from high-voltage transmission systems to low-voltage distribution systems, from utility control centers to end-user home-area networks, from bulk power markets to demand response service providers, and from traditional energy resources to distributed and renewable generation and storage, as shown in Figure 2.1 [2].
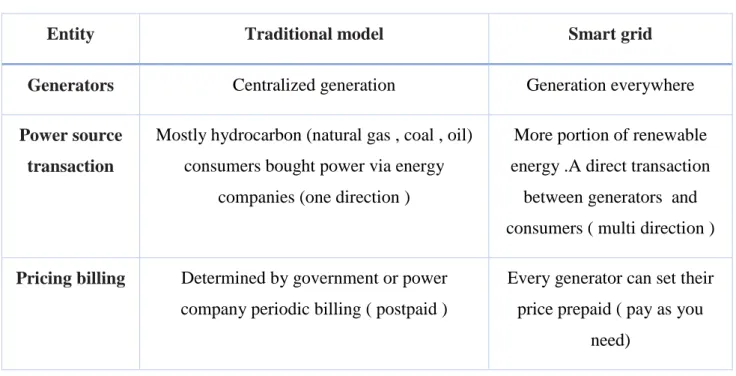
Figure 2.2 and Table 2.1 can illustrate the transition from the present grid to a smart grid and the key differences between the two. One can see there is a fundamental shift in the design and operational paradigm of the grid: from central to distributed resources, from predictable power flow directions to unpredictable directions, from a passive grid to an active grid. In short, the grid will be more dynamic in its configuration and its operational condition, which will present many opportunities for optimization but also many new technical challenges [10].
22
Entity Traditional model Smart grid
Generators Centralized generation Generation everywhere
Power source transaction
Mostly hydrocarbon (natural gas , coal , oil) consumers bought power via energy
companies (one direction )
More portion of renewable energy .A direct transaction
between generators and consumers ( multi direction )
Pricing billing Determined by government or power company periodic billing ( postpaid )
Every generator can set their price prepaid ( pay as you
need)
Table 2.1: comparison of traditional grid and smart grid
2.4 Smart Grid Characteristics:
A Smart Grid employs innovative products and services together with intelligent monitoring, control, communication, and self-healing technologies toward:
2.4.1 Provides the power quality for the range of needs:
Not all commercial enterprises, and certainly not all residential customers, need the same quality of power. A smart grid supplies varying grades (and prices) of power. The cost of premium power-quality features can be included in the electrical service contract. Advanced control methods monitor essential components, enabling rapid diagnosis and solutions to events that affect power quality, such as lightning, switching surges, line faults and harmonic sources.
2.4.2 Enables informed participation by customers :
Consumers help balance supply and demand, and ensure reliability by modifying the way they use and purchase electricity. These modifications come because of consumers having choices that motivate different purchasing patterns and behavior. These choices involve new technologies, new information about their electricity use, and new forms of electricity pricing and incentives.
23
2.4.3 Accommodates all generation and storage options:
A smart grid accommodates not only large, centralized power plants, but also the growing array of customer-sited distributed energy resources. Integration of these resources including renewables, small-scale combined heat and power, and energy storage – will increase rapidly all along the value chain, from suppliers to marketers to customers.
2.4.4
Enables new products, services and markets:
Correctly, designed and operated markets efficiently create an opportunity for consumers to choose among competing services. Some of the independent grid variables that must be explicitly managed are energy, capacity, location, time, rate of change and quality. Markets can play a major role in the management of these variables. Regulators, owners/operators and consumers need the flexibility to modify the rules of business to suit operating and market conditions.
2.4.5 Optimizes asset utilization and operating efficiency:
A smart grid applies the latest technologies to optimize the use of its assets. For example, optimized capacity can be attainable with dynamic ratings, which allow assets to be used at greater loads by continuously sensing and rating their capacities. Maintenance efficiency can be optimized with condition-based maintenance, which signals the need for equipment maintenance at precisely the right time. System-control devices can be adjusted to reduce losses and eliminate congestion. Operating efficiency increases when selecting the least-cost energy-delivery system available through these types of system-control devices.
2.4.6 Provides resiliency to disturbances, attacks and natural disasters:
Resiliency refers to the ability of a system to react to unexpected events by isolating problematic elements while the rest of the system is restored to normal operation. These self-healing actions result in reduced interruption of service to consumers and help service providers had better manage the delivery infrastructure.2.4.7 Scalability of the system and devices :
Using open standards for devices and systems to facilitate data exchange and interoperability, ensuring compatibility for wider deployment across the network management systems.
24
2.4.8
Upgrades to the grid may be delayed or avoided
There are fast and cheap solutions for new connections and provide continuing grid to meet the highest standards of safety and reliability [11].
2.5 Home energy management system :
In a smart grid system, three major parts generation, distribution, and consumption (Figure2.3) have different functionalities, as follows:
a. Power generation:
Generation is composed of different types of power generators (e.g., coalfired, gas, wind-powered turbines, and solar power plants). A generator measures the cost, power demand, and power prices offered by other generators to competitively or cooperatively adapt the power generation strategy (e.g., price and amount of supplied power in a certain time period) to achieve the maximum profit while meeting constraints on demand, capacity, and reliability.
b. Power distribution:
Electrical power is delivered from generators and distributed to consumers through transmission lines and distribution stations. Power distribution has to be optimized such that the loss and cost of transmission are minimized given constraints on the amount of transmitted power and transmission line capacity. The distribution can be adaptive on the power generator and consumer sides.
c.
Power consumption:
Consumption is composed of different types of power consumers (e.g., home, industry, and government consumers). The power demand of consumers has to be determined so that the allocation of power supply and distribution can be performed optimally. To achieve such a goal, the smart meters are deployed to quickly and accurately collect the power consumption data. This data can be used to estimate the power demand. The HEMS focuses on the power consumer side in a smart grid in which home appliances (e.g., air conditioner, dishwasher, dryer, refrigerator, kitchen stove, and washing machine) with smart meters can be monitored and controlled by a control center to optimize the power supply and consumption [20].
25 Figure 2.3: A general model of the smart grid
2.6 Components of Smart Grid
The components of a smart grid are a combination of intelligent appliances and heavy
equipment that play an important role in the production of electricity as mentioned below. These appliances work in a predefined manner, they are smart enough to understand the incoming power supply and how to utilize it.
26
2.6.1 Smart appliances
These appliances are set to consumer’s predefined preference level and they have an idea on
when to consume energy on what level. These tech appliances have an important impact on the grid generators since they help in understanding the power position and reduce the peak load factors.
Figure 2.5: Smart home appliances
2.6.2 Smart meters
The smart meters are a two-way communicator that help create a bridge between the power
providers and the end consumer. It automates the billing data collection on the very convenient manner, detects system failures and sends repairing teams much faster than before because as soon as a system or a unit fails, the service providers are notified immediately, they look much like the electric meters that are in your home now, but their technology is far more advanced.
27 Figure 2.6: smart meters
Smart meters are safe and secure:
Smart meters have been thoroughly tested for safety and reliability. They have undergone extensive tests by utilities in USA. Smart meters operate at a level that is much lower (1.4%) than the maximum permissible exposure limits for radio frequency
2.6.3 Smart substations
Substations are located in every region as s sub-branch for their main station. They monitor the performance of the station and control any critical and non-critical data that could be the status of the power, power performance, circuit breakers, security and the operationalization of the transformers.
These are also used to transform voltage at several stations and operational regions and to split the path of electricity into several routes.
Smart grid’s substations require heavy equipment and manpower to be operationalized thoroughly. This equipment may include transformers, switches, capacitor banks, circuit breakers and a network protected relay.
28 Figure 2.7: Direct monitoring and control of smart grids for several substations.
2.6.4 Synchro Phasors
Recent advancement in synchro phasor technology or Phasor measurement unit (PMU) has played a key role in the supervisory control and data acquisition (SCADA) and energy
management systems (EMS). The most common advantages of phasor measurement technology include:
Dynamic monitoring of the whole interconnected system Post-event analysis
Oscillation detection Island detection
Synchro phasors gather data from various locations of the grid to get a coherent picture of whole network using GPS and transmit for analysis to central locations [12] .
29 Figure 2.8 : synchro phasor infrastructure
2.7 Advantages of smart grid:
2.7.1 Intelligent
Capable of sensing system overloads and rerouting power to prevent or minimize a potential outage; of working autonomously when conditions require resolution faster than humans can respond…and cooperatively in aligning the goals of utilities, consumers and regulators
2.7.2 Efficient
Capable of meeting increased consumer demand without adding infrastructure.
2.7.3 Accommodating
Accepting energy from virtually any fuel source including solar and wind as easily and transparently as coal and natural gas; capable of integrating any and all better ideas and technologies energy storage technologies, for example – as they are market-proven and ready to come online .
2.7.4 Motivating
Enabling real-time communication between the consumer and utility so consumers can tailor their energy consumption based on individual preferences, like price and/or environmental concerns.
30
2.7.5 Opportunistic
Creating new opportunities and markets by means of its ability to capitalize on plug-and-play innovation wherever and whenever appropriate
2.7.6 Quality-focused
capable of delivering the power quality necessary – free of sags, spikes, disturbances and interruptions – to power our increasingly digital economy and the data centers, computers and electronics necessary to make it run
2.7.7 Resilient
Increasingly resistant to attack and natural disasters as it becomes more decentralized and reinforced with Smart Grid security protocols
2.7.8 Green
Slowing the advance of global climate change and offering a genuine path toward significant environmental improvement [13].
2.8 Security in Smart Grid
and the contexts where smart grids are deployed. Deploying a smart grid without strong and diligent security measures can allow advanced cyberattacks to remain undetected, which can eventually compromise the entire system . Inadequate security measures can also compromise the stability of the grid by exposing it to, for example, utility fraud, loss of confidential user information and energy-consumption data The cyber security objectives can be classified into the following three categories :
31 (i) Integrity: Protecting against the unauthorized modification or destruction of information. Unauthorized information access opens the door for mishandling of information, leading to mismanagement or misuse of power.
(ii) Confidentiality : Protecting privacy and proprietary information by authorized restrictions on information access and disclosure.
(iii) Availability : Ensuring timely and reliable access to information and services. Availability can be compromised by disruption of access to information which undermines the power delivery. Availability and integrity are the most important security objectives in the smart grid from the perspective of system reliability. However, due to the systems interactions with customers, the importance of confidentiality is also growing in this two-way data communication system that interconnects the whole system including meters, collectors, communications network, and utility data centers .
As mentioned earlier, smart grid has introduced new concepts in energy sector such as real-time pricing, load shedding, demand management, and integration of distributed, renewable power sources. It is based on numerous control systems, which can be targeted by the attacker. Furthermore, smart grid has created many more access points and with commands emanating from interfaces in homes and businesses in HAN ; any of these access points can be manipulated by the attackers to penetrate a network, gain access to control software, and alter load conditions to destabilize the grid in unpredictable ways . It is important to note that attack at any point can affect the entire smart grid as it is mostly based on mesh network, and any malignant attack can propagate to the entire grid, as all components in a smart grid can communicate with each other. One particular point of concern in this regard is from a customer meter to the data collector, which can use wireless communication. This can provide an opportunity to the attacker, if security mechanism is not adequate . Smart grid security mechanism should be enforced at several layers including physical and logical layers. Physically, smart grid systems and component must be secured from harm, tempering, theft, vandalism, and sabotage. Examples of physical layer security include installation of fence, video surveillance, and alert system .
Security in the logical layer deals with protecting the digital data. In a detailed discussion on logical layer security mechanisms has been presented; a few of these are highlighted below.
a. Encryption : Data encryption in smart grid, from meter to utility center, is a useful tool to prevent snooping, hence preserving the confidentiality of data. Strong but efficient
32 algorithms can be used; however, all smart grid devices, for example, meters, collectors, processors, and routers, must be enabled with encryption processing capabilities .
b. Authentication : It is the process of determining that a user or entity is, indeed, the same as been claimed. Smart grid applications must have strong authentication capabilities, to detect and reject unauthorized connections between its components, for example, meter and the utility interfaces .
c. Application Security Controls : Smart meter applications should be designed and coded appropriately so that cybercriminals cannot access a meter to mount buffer overflow attacks or to embed a malware. Data validation is an example of techniques that can be used .
d. Security Patches: It can protect an application from known threats; therefore, codes should be kept up to date with latest security patches.
e. Malware Removal: Use of antivirus and antispyware software throughout the smart grid applications can help to detect and to remove malwares from the system [9].
2.9 Conclusion:
The smart grid is the latest development for the electric power system. Although the term “smart grid” does not have a precise, uniformly accepted definition, it is commonly regarded as a digital upgrade of the existing power system. It promotes clean energy, controls energy consumption pattern and brings security to the grid. The future smart grid should enhance the security and reliability of the power system. The implementation of smart grid will be a long continuous process because it involves technological and financial investment. It also involves international effort. The government of each nation will need to develop a policy for implementing smart grid.
Chapter
III
Implementation and
Result
34
3.1 Introduction :
In this chapter we will present an a overview about routing protocols and communication hierarchy in smart grid, in order to understand the idea of our application. We choose the network simulator (NS2) as an environment to implement a comparison between AODV and DSDV routing protocols, regarding performance metrics which includes various comparison factors like packet delivery fraction, and energy consumption ; throughput as parameters . The simulation flow shown using NAM (Network Animator) and the results in graphs.
3.2 Classification of ad hoc routing protocols :
Whenever a packet is to be sent from a source node to a destination node by intermediate nodes, routing protocols are responsible for finding paths from source node to destination node. These routing protocols are categorized as follows:
3.2.1 On-demand Routing Protocols :
In this category the routes are established upon necessity. The source node begins a route discovery process whenever it needs to send data towards destination node. When a route or routes are found, the discovery process is considered as complete. When routes are created, the procedure of route maintenance is followed, which maintains valid routes and eliminates invalid routes. Different on-demand routing protocols consist of AODV, Dynamic Source Routing (DSR) etc.
AODV is an on-demand routing protocol. The discovery process is OFF until a route is required. Upon demand, the source node which needs the route, broadcasts a request packet to its neighbors. When an intermediate node receives a request packet and it has an entry corresponding to the destination node address in its routing table, it returns a reply packet through the reverse path to the source node; otherwise, rebroadcasts the request packet to its neighbors. This procedure will continue until an intermediate node can return a reply packet through the reverse path to the source node or the request packet reaches the destination node and destination node returns a reply packet through the reverse path. Next, the source node recognizes a new path and transmits its data through this path to the destination node.
3.2.2 Table-Driven Routing Protocols
This category of protocols holds the routing information from each node to every other nodes in the network, regardless of whether these routes are needed or not. Every node in the network holds a table, known as routing table, where routing information is maintained and assists nodes
35 to get the route information and establish a path. Different table-driven routing protocols consist of Destination Sequenced Distance Vector (DSDV), Optimized Link State Routing (OLSR), etc [15].
3.3 The characteristic of AODV routing protocol :
AODV combines some properties of both DSR (Dynamic Source Routing) and DSDV (Destination Sequence Distance Vector). It uses route discovery process to cope with routes on-demand basis. The protocol is hence seen as a reactive one. However, it adopts DSDV like hop-by-hop routing tables for maintaining routing information. Hence, AODV is a reactive protocol, it doesn’t need to maintain routes to nodes that are not communicating. AODV handles route discovery with Route Request (RREQ) messages. RREQ message is broadcasted to neighbor nodes. The message floods through the network until wanted destination or a node knowing fresh route is reached. Sequence numbers are used to guarantee loop freedom (Sec 2.2) RREQ messages cause bypassed nodes to allocate route table entries for reverse route. The destination node unicasts a Route Reply (RREP) back to the source node. Nodes transmitting a RREP message creates routing table entries for forward route.
For route maintenance nodes periodically send HELLO messages to neighbor nodes. If a node fails to receive three consecutive HELLO messages from a neighbor, it concludes that link to that specific node is down. A node that detects a broken link sends a Route Error (RERR) message to any upstream node. When a node receives a RERR message it will initiate a new source discovery process.[12]
36
Start
If the rout is available in the current table
If the transmission succsful
Receiving node roads table Route maintenance
Transfert a message to the destination node
Transmission begind
Activate local route againe Broadcat message
update running table ( reconnecting between nodes )
If the node ready ?
If this the destination node End If an activate rout available in neigbering nodes
Activate local route againe
YES YES No YES No N o No YES YES No
37
3.4 Smart grid communication network hierarchy :
Hierarchically, smart grid communication network can be divided into three area networks :
3.4.1 Home Area Network (HAN):
The Home Area Network belongs to the customer domain and comprises of home appliances and sensors. These devices report their power usage information to central home controller or smart meter which in turn forwards it to the central grid. Smart meters also receive electricity instructions from the grid and can turn the appliances on and off depending upon the grid‟s load. The Home Area Networks spans for area of thousands of square feet and has small data rate requirements in the order of 1 -10 Kbps.
For this particular network, ZigBee is the most preferred communication standard being utilized today. ZigBee is an energy efficient small range wireless standard dedicated for wireless sensor networks. Small nodes density and inter-node distances are characteristics of this network. However, indoor communication is severely degraded from shadowing effects and wall penetrations. Another candidate is WiFi which can also be utilized for inter-communication of home appliances and sensors. These days low power WiFi SoCs are being manufactured which can be utilized for implementing Home Area Networks. Co-existence of ZigBee and WiFi poses problems which need to be addressed.
3.4.2 Neighbourhood Area Network (NAN) :
The main role of Neighborhood Area Network is to make possible the communications of smart meters with backend control center. The NANs are deployed in outdoor environment and may consist of hundreds to thousands of smart meters. NANs connect the smart meters with gateways (collector) to relay the metering data. The coverage area of NANs is in order of 1-10 square miles and has relatively higher bandwidth requirements of around 10 - 1000 Kbps. High node density, large inter-node distances and outdoor communication are characteristics of this network. IEEE 802.11 with multi hop mesh topology is a promising candidate for implementing Neighborhood Area Networks. Electricity meters are powered by main power lines, however, water and gas smart meters are battery operated. Energy efficiency should also be considered when choosing wireless standard for this network. WiFi Mesh network, primarily installed for smart metering, can also be utilized for providing internet access in the whole city.
38 Figure 3.1 : Smart grid communication network consisting of HAN, NAN and
WAN.
3.4.3 Wide Area Network (WAN) :
The Wide Area Network connects several NANs with the backhaul network. Gateways or Collection points are located on poles to collect Data from metering nodes of NANs and forward them to the grid control center. The coverage area is much higher in terms of thousands of square miles. Likewise, date rate requirements are in the order of 10-100 Mbps. For this network, optical fibers, WiMAX and Cellular (3G/4G) are competitive technologies due to high bandwidth requirements [16].
3.5 NS2 simulator presentation :
3.5.1 NS definition :
Network Simulators (NS) are a series of open source discrete event network simulators. Most popular among them is NS-2. The latest version is NS-2.36. The core of NS-2 is in C++, with Object-Tcl (OTcl) based scripting. Linux is the most compatible operating system for NS-2. Windows with the Cygwin package supports NS-2. Back-end modeling in NS- 2 is very complex and time consuming because of the continuous changes in the code base. Moreover, some protocols have unacceptable bugs. Even though the installation of NS-2 itself