HAL Id: hal-01266201
https://hal-centralesupelec.archives-ouvertes.fr/hal-01266201
Submitted on 11 Dec 2016
HAL is a multi-disciplinary open access
archive for the deposit and dissemination of sci-entific research documents, whether they are pub-lished or not. The documents may come from teaching and research institutions in France or
L’archive ouverte pluridisciplinaire HAL, est destinée au dépôt et à la diffusion de documents scientifiques de niveau recherche, publiés ou non, émanant des établissements d’enseignement et de recherche français ou étrangers, des laboratoires
Application of Hierarchical and Distributed Cognitive
Architecture Management for the Smart Grid
Jacques Palicot, Christophe Moy, Benoît Résimont, Rémi Bonnefoi
To cite this version:
Jacques Palicot, Christophe Moy, Benoît Résimont, Rémi Bonnefoi. Application of Hierarchical and Distributed Cognitive Architecture Management for the Smart Grid. Ad Hoc Networks, Elsevier, 2016, 41, pp.86-98. �10.1016/j.adhoc.2015.12.002�. �hal-01266201�
Application of Hierarchical and Distributed Cognitive
Architecture Management for the Smart Grid.
Jacques Palicot∗,a, Christophe Moya, Benoit R´esimonta, R´emi Bonnefoia
aCentraleSup´elec/IETR, Avenue de la Boulaie, 35576 Cesson S´evign´e Cedex, France
t´el. +33 [0]2 99 84 45 00 - fax. +33 [0]2 99 84 45 99
Abstract
Moving from the current power grid to the Smart Grid (SG) requires
decen-tralizing management. This should be done by distributing intelligence over the entire grid, thereby, the intermittent production of renewable energy,
customer consumption and electricity storage in electrical vehicles (EVs) could be managed in real time. In this paper, the Hierarchical and
Dis-tributed Cognitive Radio Architecture Management (HDCRAM), initially proposed to manage Cognitive Radio systems, is proposed for the
manage-ment of the SG. This architecture can both be applied to the whole SG and to any sub-part (distribution network, production network, microgrid). In
this paper we focus on the distribution network and the hierarchical posi-tion of each element is identified. As an example, HDCRAM is used for
smart home management and multi-agent based modeling shows benefits of such an architecture. In the simulated scenario, without any management
the peak power consumption is 5500W and the hierarchical and distributed management allows to reduce it to 900 W. This diminution allows to reduce the pressure on the grid and can decrease the risk of failure.
∗
Corresponding author
Key words: Smart Grid (SG), Smart home management, Hierarchical and Distributed Cognitive Radio Architecture Management (HDCRAM),
multi-agent systems, JADE.
1. Introduction
The European Technology Platform (ETP) Smart Grids was set up in 2005 to create a joint vision of European networks for 2020 and onwards [1].
According to the European Commission, the definition of the Smart Grid is a follows [2].
Definition 1. A Smart Grid is an electricity network that can cost effi-ciently integrate the behavior and actions of all users connected to it -
gen-erators, consumers and those that do both - in order to ensure economically efficient, sustainable power system with low losses and high levels of quality
and security of supply and safety.
A more explicit definition is given by the Energy Independence and
Se-curity Act of 2007 [3].
Definition 2. The term ”Smart Grid” refers to a modernization of the elec-tricity delivery system so that it monitors, protects, and automatically
op-timizes the operation of its interconnected elements, from the central and distributed generator through the high-voltage transmission network and the
distribution system, to industrial users and building automation systems, to energy storage installations, and to end-use consumers and their
This latter definition (def. 2) incorporates the distribution and trans-mission networks that are major agents in the Smart Grid. Moreover, it
includes many different actors that will participate in the Smart Grid such as electric vehicles, thermostats, etc. Six categories of communications have
been identified by the Department of Energy (DOE) : Advanced Metering Infrastructure (AMI), Demand Response or Demand Side Management (DR
or DSM), Wide Area Situational Awareness (WASA), Distributed Energy Resources and Storage (DERS), Electric Transportation or Electric Vehicles
(ET or EV) and Distribution Grid Management (DGM) [4]. Management of such a complex network is of great importance and this is the purpose
of this paper. The electrical grid will become a smart system. Introducing smartness is all about increasing communications between local entities in
order to coordinate all the elements of the global system.
Indeed, it is mandatory to refer to communications when we talk about the Smart Grid. The data volume exchanged by the different actors is such
that it would be impossible to transport the data without a reliable and dis-tributed communication system. Cognitive radio [5][6] could be an efficient
way to transport the data without overloading the frequency spectrum [7]. It has been envisaged to use different frequency bands for cognitive com-munications for the Smart grid [8], for example, free TV bands [9][10], in
[11], authors consider the use of cognitive communications over unlicensed band for home communications and over licensed band for communications
over longer distances. In [12] the smart grid is viewed as a huge Wireless Sensors Network (WSN) in which all the elements of the smart grid
com-municate using cognitive radio. These papers are applying Cognitive Radio to the Smart Grid from the SG communication point of view. In this paper,
the application of CR is done through the application of a Cognitive Radio Manager to the Smart Grid. The Smart Grid management architecture
af-fects the complexity of the management of cognitive radio equipments, as a consequence, the design of the architecture must take into account the
communication system.
In order to fulfil the communication requirements of the SG, we pro-pose to use a Cognitive Radio Management Architecture that was initially
proposed during the first CROWNCOM conference in 2006 [13]. This archi-tecture, named HDCRAM for Hierarchical and Distributed Cognitive Radio
Architecture Management, was successfully demonstrated in several Cogni-tive Radio (CR) scenarios such as the Dynamic Spectrum Access (DSA) [14]
[15]1.
We believe that the current centralized management of power system, is not suitable anymore for several reasons such as the increasing consumption,
the introduction of distributed renewable energy (distributed geographically and in time), the customers involvement, the huge amount of data to
han-dle, etc. We believe that, in the case of the management of such a big and complex system as the SG, the management should be distributed among all actors of this system and HDCRAM could be a management solution.
This is what we would like to highlight in this paper.
Some hierarchical and distributed architectures have already been pro-posed for the Smart Grid. In [16], coordinators receive information from
1
consumer or from the lower level coordinators and broadcast to all agent the same data which are used to make decisions. In [17], the architecture
has three levels and decision can be done at the microgid level, at the feeder level or at the substation level. In these articles hierarchical architectures
are only used for demand-side management and for management pricing. In [18], a detailed hierarchical and distributed architecture is proposed for
mi-crogrid management but this architecture hasn’t been applied over a larger part of the grid as we do in this paper.
In summary, in this paper :
• A hierarchical architecture (coming from Cognitive Radio domain) is
proposed for the distribution network and is used to manage consump-tion, intermittent producconsump-tion, storage and grid monitoring;
• The hierarchical position of each element of the grid (e.g. Smart
Me-ters, Phasor Measurement Units (PMUs) or EV aggregator) is clearly
identified in this paper.
• This architecture is finally implemented for Smart Home management
.
This architecture can also be mapped on any of the sub parts of the SG.
Moreover, HDCRAM is composed by two independent paths, one for the cognitive management and the other for the (re)configuration management,
that differentiates it from existing solutions.
This paper is organized as follows: Section 2 describes the basics of HDCRAM, while Section 3 proposes the deployment of HDCRAM for the
SG (illustrated by two clear schemes). In this section, the metrics used for both the cognitive information and the reconfiguration orders are also
described for some elements of the networks. Section 4 gives a concrete example and its simulation through an agent-oriented implementation using
JADE (Java Agent DEvelopment Framework). Conclusions are drawn in Section 5.
2. Hierarchical and Distributed Cognitive Radio Architecture Man-agement (HDCRAM)
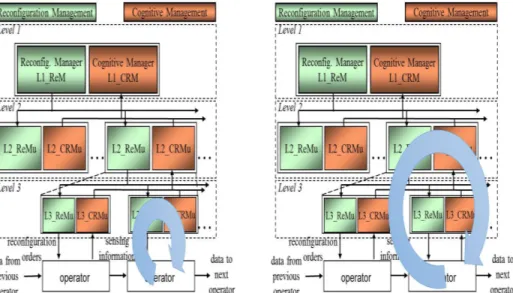
This section presents an architecture designed at first for Cognitive Ra-dio purposes[19]. Its name is Hierarchical and Distributed Cognitive RaRa-dio
Architecture Management, in short: HDCRAM. The HDCRAM architec-ture is depicted in Figure 1. The cognitive cycle (see Figure 2) shows that
a Cognitive Radio equipment or system has three main activities: a sensing activity, an intelligent activity (decision making) and a reconfiguration
ac-tivity (adaptation). In HDCRAM, those activities are distinguished. The two other characteristics that are also well separated in HDCRAM, are the
management architecture (level 1, 2 and 3) and the radio transceiver chain (at operator’s level). Hence HDCRAM is all that has to be added to
trans-form a non-intelligent legacy system to a smart system, whatever the system is: radio, grid, city, car, etc.
As it can be seen in Figure 1, this architecture comprises two managing
sub-parts [20]:
• A cognitive part featuring Cognitive Radio Management Units (CRMu):
Figure 1: Hierarchical and Distributed Cognitive Radio Architecture Management [20] over a processing chain made of reconfigurable operators. The processing chain targeted
by HDCRAM was initially made of radio processing elements and we propose in this paper to target the elements of the grid.
Figure 2: Simplified cognitive cycle
only. This entity has intelligent capabilities, and can make decisions and alert the upper-level CRMu;
• A reconfiguration part featuring Reconfiguration Management Units
(ReMu): a ReMu exchanges information from the upper to the lower level only. This entity receives reconfiguration orders from the upper
level and transmits them to the lower level ReMu.
Communication can also exist from a CRMu to a ReMu at the same level. Figure 1 shows also a three-levels architecture:
• Level 1 (L1): is composed of the couple L1 CRM/L1 ReM and is the
general manager of the system and is unique;
• Level 2 (L2). Level 2 is composed of several couples (L2 CRMu/L2 ReMu).
They provide L1 with an abstraction of the lower level L3 by not
send-ing to L1 all the information they receive from L3 but only the nec-essary information. Then L2 acts as a compression level in order to
decrease the amount of data to be handled in the management archi-tecture;
• Level 3 (L3). Level 3 is composed of several couples (L3 CRMu/L3 ReMu).
Each of these couples is associated to an operator. L3 ReMu is the
en-tity that is able to reconfigure its associated operator, and L3 CRMu is used to process the data that come from the operator.
• Operators: an operator is a modifiable component of the managed
system (for example a filter or a signal to noise ratio sensor in the
radio context).
The intelligence is distributed because the real-time constraints would be difficult to handle if all the decisions were made in a centralized way.
This hierarchical and distributed architecture allows to make decisions at different level [20]. A local and simple decision is made at level L3
(lit-tle cycle in Figure 3). If the decision is more complex or involves other operators, the decision is made at level L2 (Figure 4 ). Lastly, if many
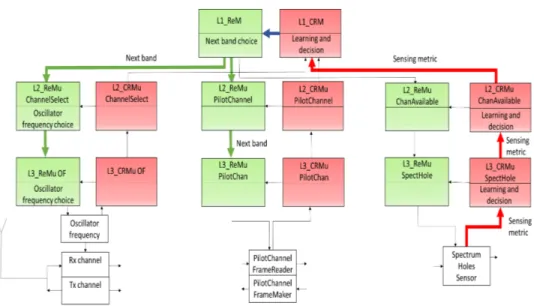
operators are involved, the decision is made at level L1 (Figure 5). For example, Figure 6 zooms on the sub-part of a smart radio transceiver that
could change the modulation when the Signal to Noise Ratio is below a given threshold [21]. In this context, when L3 CRMu management unit of SNR
sensor detects that the threshold is crossed, L3 CRMu of the SNR sensor can not directly affect the configuration of the mapping operator through its L3 ReMu. As a consequence, L3 CRMu of the SNR sensor has to refer
to L2 CRMu of L2 Modulation management that can reache Mapping man-agement L3 ReMu to manage the reconfiguration of the operator (medium
decision cycle is used).
In order to help the reader really understand this HDCRAM architec-ture, Figure 7 provides an example of the OSA (Opportunistic Spectrum
Figure 3: A little cycle (includes one level L3)
Figure 4: A medium cycle (includes two levels L2 and L3)
Figure 5: A big cycle (includes all three levels)
Figure 6: Example of utilization of HDCRAM, the decision to change the modulation is made in the L2 ReMu and only the elements involved in the decision process are
illustrated in this scheme
Access) challenge. OSA is a futuristic spectrum access scheme aiming to
mitigate radio-frequency spectrum congestion. With OSA, future radio de-vices will be more agile in frequency and then should be able to change their
transmitting frequency dynamically. It consists at giving new rights to so called Secondary Users (SUs) that could use the spectrum let vacant from
time to time by licensed users, e.g. Primary Users (PUs). This scenario is only acceptable if SUs never interfere with PUs. A SU runs a spectrum holes
sensor that senses its radio environment and sends an information about the presence or absence of a PU communicating in the targeted channel to its
corresponding L3 CRMu. If a channel is free, e.g. not used by a PU, there is a hole in the spectrum and a SU can use it. If a PU uses the channel, the
SU cannot use this channel and should seek for other channel opportunities and consequently should reconfigure its radio parameters such as carrier
fre-quency. Here is the detail of the reconfiguration process that occurs inside the cognitive equipment from the sensor to the reconfiguration action. In
this scenario, The L3 CRMu in charge of the sensor can’t make the deci-sion but should send a piece of information to its corresponding L2 CRMu.
Finally, this last entity concludes that the channel is no longer available. In this scenario, L1 CRM has been designed to provoke a changing of the
carrier frequency in order to explore another radio channel, thus L2 and L3 in charge of spectrum sensing can’t make the decision. Consequently, the
sensing result of “Spectrum Holes Sensor” is transmitted through L3 CRMu and then L2 CRMu to inform L1 CRM, which then sends a reconfiguration
order to L1 ReM. L1 ReM sends a reconfiguration order to the L2 ReMu in charge of channel selection and to the L2 ReMu in charge of Common
Pilot Channel (CPC) necessary to coordinate SUs that are communicating together, so that they can exchange their frequency parameters. Finally, the
SU can check if the new band is free.
In order to have a high-level specification of this architecture, HDCRAM was modeled by using the Unified Modeling Language (UML) language. The
use of an executable programming language, such as C, C++, Java, etc., in combination with UML and a metamodel2, simulates the architectures that are modelled [20].
The HDCRAM has some particularities that make it interesting for Smart Grid management, the main ones are :
• Two totally independent paths for the cognitive management and for
the (re)configuration management.
• HDCRAM is a model of an architecture independent of the
Figure 7: Example of HDCRAM deployment for OSA purpose
ing which are performed in the connected”boxes”.”HDCRAM model”
provides a skeleton of a management architecture.
• ”HDCRAM model” is implemented in a specific ”HDCRAM
imple-mentation” for a given smart scenario.
• Three levels of possible decisions, which corresponds to three different
cognitive cycles in the architecture.
• HDCRAM model could be applied to any complex systems. The rules
and the connections between the ”boxes” of the architecture help the designer of the smart system to deploy smart scenarios and to specify
the different elements necessary to implement this scenario. There-fore it could be applied to the entire SG comprising energy production
(monitoring renewable energy,etc.) and not limited to home environ-ment.
• An “HDCRAM implementation” could be emulated, simulated in
or-der to predict the behavior of a system following a given smart
sce-nario.
• An “HDCRAM implementation” could embed any decision making
algorithms.
3. Application of Hierarchical and Distributed Cognitive
Archi-tecture for the Smart Grid
HDCRAM has been proposed within the framework of Cognitive Radio
but it could be applied to any big and complex system with self-adaptation requirements, such as the Smart Grid. In brief, HDCRAM is a management
tool used at first to represent a Cognitive Radio system but can be general-ized to represent and manage complex and heterogeneous self-adaptive
sys-tems. HDCRAM could be an interesting solution to manage efficiently the grid. Hierarchical and distributed architectures already exist for the power
system, but it is often related to the transmission part of the grid. With this HDCRAM approach, these hierarchical and distributed architectures can be
generalized to the entire grid or to any sub part. The distribution part of the grid is the one whose management needs will increase the most in the
coming years, that’s why we maps the HDCRAM on this sub part. This gives moreover the opportunity to merge a lot of the Smart Grid aspects
into a unique coherent system.
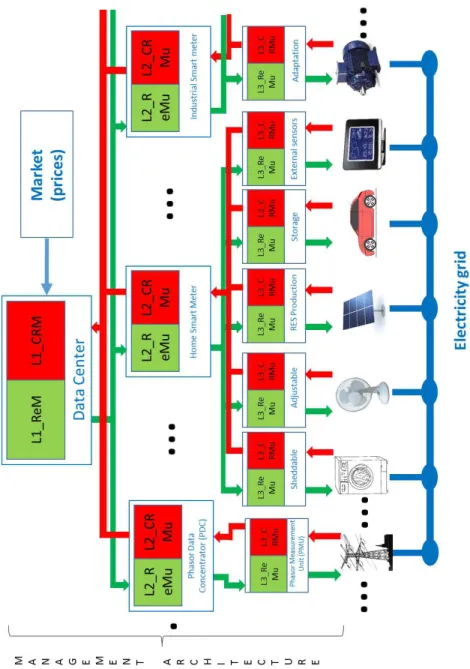
3.1. Mapping on the distribution network
Figure 8 and 9shows two sides of the same representation, cut for clar-ity purposes, of HDCRAM deployment for the Smart Grid. For many
re-searchers and industrial stakeholders of the Smart Grid community, such as [22],improvements must be performed in the distribution network to enable
the Smart Grid. Indeed, a lot of topics currently studied are related to the distribution network: demand side management programs that are enabled
by distribution companies, the integration of renewable energy and storage facilities. This is, most of the time, located at the distribution level, and
dealt with distribution networks monitored by PMUs, etc. This is the rea-son why the distribution data center is the level one (L1) in Figure 8.
Level two (L2) divides the distribution management into its three main
challenges:
• The network monitoring, being represented by phasor data
concentra-tor (fig. 8) (PDC);
• The consumers Participation (DSM vision), being represented by the
home smart meter and the industrial smart meter (fig. 8).
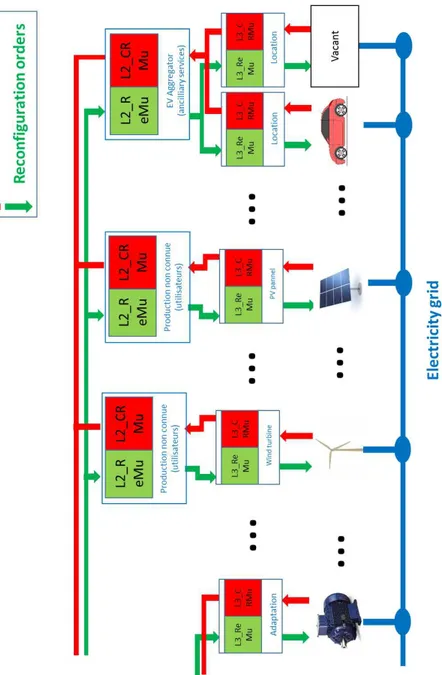
• The integration of renewable energy and storage facilities, which is
represented by the wind farms’ monitoring, the PV farms’ monitoring and the EV aggregator (fig. 9).
It is important to notice that, in those Figures, the energy grid and the
management architecture are well separated.
With this proposed architecture, distribution companies are relieved from a part of the management. Indeed, local problems are solved locally
thanks to the distributed management. If, for instance, the energy con-sumption of customers, in a certain area, is too large and there is therefore
a pressure on the grid (information received from a PDC), smart meters will first try to solve the problem by adapting or shifting some loads or propose
customers to do so by offering them a lower electricity price (Real Time Pricing program). If the engendered load modification is not sufficient, the
PDC still sends information about critical states for some lines, the distri-bution data center will send reconfiguration orders to EV aggregators and
to renewable energy sources in order to increase electricity generation. For instance, if some wind turbines/PV panels are switched off in a wind/PV
farm and there is a lot of wind/sunshine, a switching ON order will be sent. EV aggregators would also propose interesting prices in order to encourage
people to discharge their car batteries into the grid.
3.2. Description of level 2
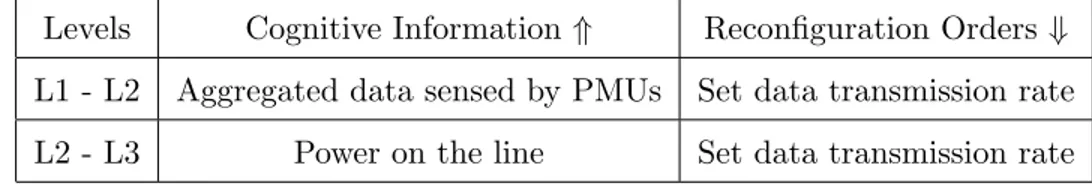
3.2.1. Network monitoring (L2 PDC of figure 8)
A phasor data concentrator (PDC) is used to collect the data that come
from all the PMUs [23]. A Level three (L3) related to a PDC is necessary for a PMU to be set up on a line. In runtime operations, a PMU measures
voltage, current, etc. of its dedicated line and sends information to the cor-responding PDC. In order not to overflow the distribution data center and
provide it with level three abstraction, the PDC can only send information to it when an issue occurs or when the situation is critical. The
reconfigu-ration orders from level one to level two and from level two to level three are the data transmission rates of a PDC and that of a PMU respectively.
Table 1 lists examples of the upward (cognitive information) and
Levels Cognitive Information ⇑ Reconfiguration Orders ⇓
L1 - L2 Aggregated data sensed by PMUs Set data transmission rate
L2 - L3 Power on the line Set data transmission rate
Table 1: Interaction between the distribution data center and a PMU
3.2.2. Integration of renewable energy and storage facilities
This section describes the L2 of Wind farm monitoring, PV farm moni-toring and EV aggregator of figure 9. Renewable energy sources are difficult to handle because of the intermittent generation. The energy produced by
a wind farm or a PV farm does not necessary coincide with the energy de-mand. The production of these renewable energy sources at time t is
some-times much larger than the consumption at this same time, which can cause a large pressure on the grid. This is why a local control of a wind farm or a
PV farm is required. Indeed, if a wind/PV farm exceeds a specific produc-tion threshold (sent by the distribuproduc-tion data center), a monitoring system of
the wind/PV farm (L2) can send orders to one or several wind turbines/PV panels (L3) to switch OFF in order to reduce the total electricity generation.
Table 2 lists examples of cognitive information and reconfiguration
or-ders sent in this context.
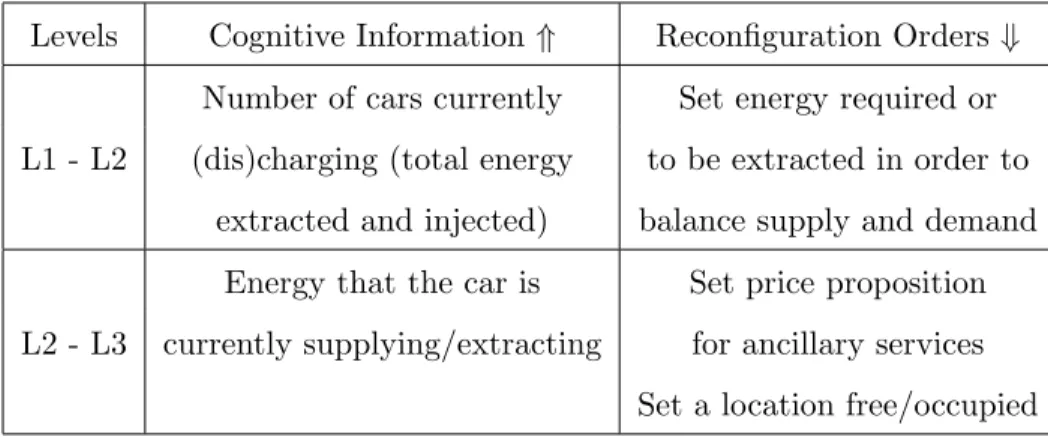
Electric vehicles (EV) can offer an efficient way of electricity storage. The possibility of offering ancillary services by using EV has already been
proposed by means of using cars’ batteries [7]. An aggregator such as a telecommunication operator (L2) receives information about the energy
re-Levels Cognitive Information ⇑ Reconfiguration Orders ⇓
L1 - L2 Total production of Set a production
wind/PV farm threshold
L2 - L3 Production of one wind Switch OFF/ON turbine/PV panel the wind turbine/PV panel
Table 2: Interaction from the distribution data center to a wind turbine/PV panel
quired to balance demand and production from the distribution data center. This aggregator then proposes, via a cellular network (cars are equipped with
cellular antennas), to cars around, to sell their electricity at a certain price per minute/hour. The aggregator receives benefits from having distributed
information and thus having contributed to ancillary services. It is impor-tant to notice that ancillary services are not in unique direction, i.e. cars
can also extract energy if an overproduction is detected. This energy ex-traction is at lower price, so as to attract people to charge up their vehicles.
Moreover, this EV aggregator entity acts as a charging station, i.e. it has the same role as a fuel pump.
Table 3 lists examples of cognitive information and reconfiguration
or-ders sent in the EV aggregator context.
3.2.3. Consumers participation (L2 Home Smart Meter of figure 8)
The smart meter is essential to enable demand side management pro-grams. In the coming years, a typical home will be equipped with about
Levels Cognitive Information ⇑ Reconfiguration Orders ⇓
Number of cars currently Set energy required or
L1 - L2 (dis)charging (total energy to be extracted in order to extracted and injected) balance supply and demand
Energy that the car is Set price proposition
L2 - L3 currently supplying/extracting for ancillary services Set a location free/occupied
Table 3: Interaction from the distribution data center to cars batteries
meter. In addition to measuring consumption the smart meter will be able to operate devices. A centralized way to process the data and control the
devices, i.e. all the data from all the devices sent to the distribution data center and processed by itself, seems difficult to imagine and implement
practically, whereas a distributed vision would relieve the distribution data center. Since the smart meter is the link between a home and the
distribu-tion data center, this device is at level two in the HDCRAM deployment. In this distributed vision, the smart meter has the role of home energy
man-ager, i.e. it has to manage all the smart electrical devices (level three) that consume, produce or store electricity and sensors that sense the environment.
Between level one and level two, reconfiguration orders can be load
cur-tailments, in such cases where a customer has subscribed for a DLC (Direct Load Control) program or set electricity prices in the smart meter. In such
instances, the customer may want to curtail its load or not. The cognitive information is the total energy consumption of the home.
Level three is divided into five categories: the sheddable load, the ad-justable load, devices that produce electricity, Devices that can store the
electricity, sensors (of any kind).
Table 4 lists examples of cognitive information and reconfiguration or-ders between the level two smart meter and all the levels three related to
this level two, as described above.
Level 2-3 Cognitive Information ⇑ Reconfiguration Orders ⇓
Electricity consumption Shift consumption to time Sheddable Time at which the device t (switch OFF until time t)
will start consuming Switch ON/OFF the device
Electricity consumption Switch the device Adjustable Min power allowed at time t consumption to its minimum/
Max power allowed at time t maximum consumption
Batteries level of the car Change the batteries state: Storage Batteries state: charge, charge, unplug from grid, etc.
discharged, etc. Discharge in the grid.
Renewable Production level Switch OFF/ON
energy of the PV panels the PV panels
External Send sensing data: Not really any
Sensors wind velocity, sunshine, reconfiguration orders temperature, etc. but switch OFF/ON a sensor
In the case where the customer is an industrial company, DSM can also be applied [25]. For example, the industrial Smart Meter can reduce power
consumption of non-essential devices or switch on diesel generator during peak load hours. Thus, smart industrial management can be done in the
same manner as smart home management.
More details on level 3 of consumer participation are given in the follow-ing section.
3.3. Level 3 of consumer participation
3.3.1. The sheddable load
The sheddable load can be reprogrammed at another time, i.e. can have its consumption shifted to off-peak hours. For instance, a washing machine
can have its consumption shifted to night hours, where prices are lower.
3.3.2. The adjustable load
The adjustable load that cannot have its consumption totally shifted to
later hours but can adapt its power level in order to decrease a bit the total electricity consumption of the house. An air-conditioner can decrease its
electricity consumption by not decreasing too much the ambient tempera-ture for example.
Paper [26] even proposes to divide the load into three categories which are sheddable, adjustable and load sensitive. The sensitive load refers to
the load that cannot have its consumption shifted or adapted (or just very little adapted). But this category can be merged with the adjustable load
by keeping in mind that there exists devices that have zero power level adaptation.
3.3.3. Electricity production
The electricity generation produced by photovoltaic panels (PV) is pro-vided in an intermittent way and depends on the environment. A local
way to control those panels is desirable, i.e. switching ON/OFF the panels depending on the user requirements or distribution lines’ states.
3.3.4. Storage facilities
With the advent of electric vehicles (EV), the possibility of storing energy at home has emerged. If the generation of the home PV panels is too large
compared to the power consumption of all the other devices, the excessive energy will be injected into the grid, which is sometimes not desirable for the
sake of the distribution network’s performance. This energy could instead be stored in the user car’s batteries in order to either use the car or use this
stored energy when electricity prices are high.
3.3.5. Sensors
Sensors can be used to anticipate power consumption and production. They can be of many types irradiance sensors, wind sensors, temperature
sensors, etc. For example, temperature sensors can inform the smart meter of the outside temperature. The smart meter will then decide at what time
radiators must be switched ON/OFF, depending on the electricity price, grid pressure, thermal inertia of the building, etc. Wind sensors can also
be useful: sensors sense the velocity of the wind, send this information to the smart meter which can decide to send it to the distribution data center
and the latter can predict the electricity generation of a wind farm close to a specific location.
All the devices listed above will have to communicate with the smart meter. Wireless communications is preferred as it is less intrusive and can
be installed without any alteration work. But, if the number of devices is large and if some devices produce too many electromagnetic waves (such
as a microwave), some frequency bands could be congested. A proposed solution is to use devices equipped with radio reconfigurable abilities and
a decision making process such as OSA, so as to select the right band and channel that can be used by each device.
4. A Multi-Agent Based Implementation of a Home Energy Man-ager
This section presents a multi-agent based implementation of a home en-ergy manager, which can be useful to simulate the behavior of a house with
respect to electricity price changes. This implementation is based on the level two smart meter and the corresponding level three parts of the
archi-tecture presented in section 3 : L3 manager of PV panels, washing machines, air conditioning, etc. The proposed implementation is restricted on these
parts here, in order to have a quick simulation on a concrete case. The purpose of this simulation aims to show that the application of HDCRAM
architecture provides benefits compared to the case where this architecture is not applied (without management).
4.1. Java Agent DEvelopment Framework (JADE)
In order to implement a home energy manager that includes indepen-dent entities that can communicate with each other, while maintaining a
the JADE platform was used [27].
JADE belongs to the agent-oriented programming (AOP) class, which is used to simulate artificial distributed systems. AOP is used to model an
application as a set of autonomic, active and communicating entities called agents [28]. With these abilities, agents can independently make decisions
and send any relevant information that they computed to other agents. Since JADE is used in the distributed system, agents can be easily added without
any changes in the already implemented agents (they act independently).
4.2. Simulations scenario
A multi-agent based home energy manager is implemented. The
con-cerned sub part of figure 8 and 9 in this scenario, is the level two home smart meter and the level three entities and operators below it. The thirteen electrical appliances considered in the scenario simulated can be classified
in the four categories already mentionned :
• Sheddable load : dish washer, vacuum cleaner, oven, iron, washing
machine and air dryer;
• Electricity production : PV agent
• Storage facilities : two electrical vehicle;
• Adjustable load : fridge, air conditioner, ventilator and radiator;
A simplified scheme of the architecture applied to the simulation scenario is
The aim of this simulation is to compare the instantaneous power con-sumed with and without the hierarchical manager. The implementation is
time-dependent and models a whole day divided in 24 periods (time step = one hour, this could be changed depending on the required precision without
loss of generality). At each hour h, in order to reduce the pressure on the power grid, the aim of the manager is to minimize the magnitude of the
total power consumption |Ptot(h)|.
The expression of the total power consumption Ptot(h) may be
decom-posed into the sum of the power consumption of each device.
For each hour, the total power consumption can be written:
Ptot(h) = Pcons(h) − Pprod(h). (1)
The expression of the total power consumed at hour h, Pcons(h), is :
Pcons(h) = Na X i=1 Padji (h) + Ns X i Pshedi (h) + Pst(h), (2)
where Naand Nsdenote respectively the number of adjustable and
shed-dable devices, Padji (h) the power consumption of one of the adjustable de-vices during hour h, Pshei (h) the power consumption of one of the sheddable devices during hour h and Pst(h) is the power stored into the batteries of
the two electrical vehicles.This power is produced by PV panels and stored because it isn’t instantaneously consumed.
The total power produced Pprod(h) :
where PP V(h) is the power produced by PV panels and Pdel(h) is the
power delivered by the batteries of the two electrical vehicles where PV
cur-rent is stored when it is not consumed.
Finally, if we denote ∆S(h) = Pst(h) − Pdel(h) the power variation
in-duced by the batteries, the total power consumption becomes :
Ptot(h) = Na X i=1 Padji (h) + Ns X i=1 Pshedi (h) − PP V(h) + ∆S(h). (4)
It is important to note that, each of the four terms of this sum relates to one level 3 unit of the architecture.
In our scenario, each of the two electrical vehicles can store 15 kWh and
the power delivered or stored by each of them is between −3000 and 3000 W.
The power produced by PV panels depends on the weather, for simula-tion we consider that at each hour the power produced PP V(h) is uniformly
distributed between 0 W and a maximum value which depends on the time, PP V(h) ∼ U (0, MP V(h)) . The values of MP V(h) are referenced in Table 5.
Hours of the day [h] maximum Power generated [W]
h ∈ [21; 4] 30
h ∈ [5; 7] ∪ [18; 20] 4000
h ∈ [8; 17] 12000
Each of the Na = 4 adjustable devices are listed in Table 6. When the
total power consumption is high, the power consumed by those devices is
reduced from their nominal power consumption to their minimal power con-sumption.The six sheddable devices are listed in Table 7, they must be used
for an hour between their earliest and latest time of consumption during the day.
Agent’s name Minimum power level Nominal power level
[W] [W]
AirConditioner 2000 3000
Radiator 500 1000
Fridge 100 300
Ventilator 30 50
Table 6: Adjustable devices agents used for the simulation
Each hour, all L3 CRMu in charge of power production, storage and adjustable devices send cognitive information to the L2 CRMu (respectively
the power produced, state of batteries and adjustable load requirements). This entity computes the power consumption of the hour and then sends configuration order (adjustable devices to start, power level of sheddable
devices and power to deliver or store for batteries) to the L2 ReMu which transmits it to the corresponding L3 ReMus. Configuration orders must take
into account the constraint of the devices pre-set in the manager. Figure 11 shows communication paths between the L2 manager and the L3 units
empoyed for simulations.
Agent’s name Consumption Earliest time of Latest time of when ON [W] consumption [h] consumption [h]
WashingMachine 1690 0 23 Dryer 2400 0 9 Oven 3105 17 20 VacuumCleaner 1874 9 12 Iron 1960 10 14 DishWasher 1060 21 23 HairDryer 1733 17 22
Table 7: Sheddable devices agents used for the simulation
no role in the scenario, either because they have no capability to sense and to be swithed remotely, or just because they have not been considered in the
scenario. HDCRAM infrastructure is deployed where it is only necessary, depending on the use cases that should be supported by the management
system.
4.3. Simulations results
Figure 12 shows the comparison between a classical utilization of the
operators and the result of the HDCRAM implementation presented above for a period of 24 hours.
(a) Classical (b) HDCRAM
Figure 12: Simulation results of the power consumption in W in function of time, as described in section 4.3 (a) when a classical utilization of the electrical devices is done
and (b) when HDCRAM is used as a management facility of the home power consumption
In a classical utilization of the same electrical devices (manual mode),
in Figure 12 a), there is no consideration to the current load, and storage facilities are not considered. The adjustable devices operate at one power
level during the day (between 6 AM and 7 PM) and at another during the night (a customer does not often change the power level of its devices to
reduce the consumption). The sheddable devices consume electricity at a random hour in their hour bounds (hour constraints).
Thanks to the proposed power management, the power consumption is
zero (Ptot(h) = 0) for 17 of the 24 hours of the day and the peak consumption
is strongly reduced (figure 12. This gain is due to the management of storage
facilities, sheddable and adjustable load:
• Batteries allow a better distribution of the produced energy, power
provided by solar panels is stored during the day and used at night.
This part of the management doesn’t reduce the quality of service but is limited by the batteries size.
• The use of sheddable devices is better distributed over the day, this
reduces significantly the peak production. Moreover, the constraint
on hours of use (earliest and latest hour) limits inconvenience for the consumer.
• Reducing power consumption of adjustable devices reduces the
qual-ity of service. Consequently, the manager should use this possibilqual-ity wisely. At each hour, the impact of power reduction is limited by the
total adjustable load (1720 W in the scenario simulated).
Table 8 compares the results obtained in automatic and manual mode. It is clear that the variability and the maximum/minimum power levels in
Peak Peak
Mode consumption generation
[W ] [W ]
HDCRAM 850 800
Classical 5500 7000
Table 8: Comparison between HDCRAM and a classical utilization
Therefore, with the HDCRAM implementation, the customer will have
a lower electricity bill (much less energy drawn from the grid) and the distri-bution network will have less pressure on its grid (much less energy injected
to the grid and much less variation).
5. Conclusion
HDCRAM is proposed as an efficient tool to model and represent the
communication interactions in the Smart Grid. Moreover, this tool could be used to distribute the tasks amongst the components of the SG, and
HDCRAM will link all of them together. HDCRAM can help specifying the entire management system and its framework can help with generating
the simulation code first, then the implementation code. The simulation results are very promising. In future work, retailers will be include in the
architecture and communication access and protocol will be studied.
6. Acknowledgment
Part of this work is supported by the project SOGREEN (Smart pOwer Grid for Energy Efficient small cell Networks), which is funded by the French
national research agency, under the grant agreement coded: N ANR-14-CE28-0025-02 and by R´egion Bretagne, France.
References
[1] E. Commission, “European Technology Platform SmartGrids Vision and Strategy for Europes Electricity Networks of the Future,” 2006.
[2] E. C. T. F. for Smart Grids, “Expert Group 1: Functionalities of Smart Grids and Smart Meters: Final Deliverable,” December 2010.
[3] 110th United States Congress, “Energy Independence and Security Act
of 2007,” January 2007.
[4] D. of Energy of USA, “Communications Requirements of Smart Grid Technologies,” tech. rep., October 2010.
[5] J. Mitola and J. Maguire, G.Q., “Cognitive radio: making software
radios more personal,” Personal Communications, IEEE, vol. 6, pp. 13– 18, Aug 1999.
[6] S. Haykin, “Cognitive radio: brain-empowered wireless
communica-tions,” Selected Areas in Communications, IEEE Journal on, vol. 23, pp. 201–220, Feb 2005.
[7] E. Hossain, Z. Han, and H. Poor, Smart Grid Communications and
Networking. Smart Grid Communications and Networking, Cambridge University Press, 2012.
[8] A. Khan, M. Rehmani, and M. Reisslein, “Cognitive radio for smart grids: Survey of architectures, spectrum sensing mechanisms, and
net-working protocols,” Communications Surveys Tutorials, IEEE, vol. PP, no. 99, pp. 1–1, 2015.
[9] R. Qiu, Z. Hu, Z. Chen, N. Guo, R. Ranganathan, S. Hou, and
G. Zheng, “Cognitive radio network for the smart grid: Experimen-tal system architecture, control algorithms, security, and microgrid
testbed,” Smart Grid, IEEE Transactions on, vol. 2, pp. 724–740, Dec 2011.
[10] Y. Zhang, R. Yu, M. Nekovee, Y. Liu, S. Xie, and S. Gjessing,
“Cog-nitive machine-to-machine communications: visions and potentials for the smart grid,” Network, IEEE, vol. 26, pp. 6–13, May 2012.
[11] R. Yu, Y. Zhang, S. Gjessing, C. Yuen, S. Xie, and M. Guizani, “Cog-nitive radio based hierarchical communications infrastructure for smart
grid,” Network, IEEE, vol. 25, pp. 6–14, September 2011.
[12] G. Shah, V. Gungor, and O. Akan, “A cross-layer qos-aware commu-nication framework in cognitive radio sensor networks for smart grid
applications,” Industrial Informatics, IEEE Transactions on, vol. 9, pp. 1477–1485, Aug 2013.
[13] L. Godard, C. Moy, and J. Palicot, “From a configuration management
to a cognitive radio management of sdr systems,” in Cognitive Radio Oriented Wireless Networks and Communications, 2006. 1st
Interna-tional Conference on, pp. 1–5, June 2006.
[14] O. Lazrak, S. Bourbia, C. Moy, D. L. Guennec, P. Leray, K. Grati, and A. Gazel, “Management architecture for green cognitive radio
equip-ments,” Transactions on Emerging Telecommunications Technologies, vol. 24, no. 7-8, pp. 683–691, 2013.
[15] O. Lazrak, C. Moy, and P. Leray, “Modeling Cognitive Radio
Equip-ments for Opportunistic Spectrum Access,” in Wireless Innovation Fo-rum European Conference on Communications Technologies and
Soft-ware Defined Radio 2013, (Munich, Germany), June 2013.
[16] R. Verschae, H. Kawashima, T. Kato, and T. Matsuyama, “A dis-tributed hierarchical architecture for community-based power
balanc-ing,” in Smart Grid Communications (SmartGridComm), 2014 IEEE International Conference on, pp. 163–169, Nov 2014.
[17] D. Li and S. Jayaweera, “Distributed smart-home decision-making in a hierarchical interactive smart grid architecture,” Parallel and
Dis-tributed Systems, IEEE Transactions on, vol. 26, pp. 75–84, Jan 2015.
[18] C. xia Dou and B. Liu, “Multi-agent based hierarchical hybrid con-trol for smart microgrid,” Smart Grid, IEEE Transactions on, vol. 4,
pp. 771–778, June 2013.
[19] L. Godard, C. Moy, and J. Palicot, “An executable meta-model of a hierarchical and distributed architecture management for
cogni-tive radio equipments,” annals of telecommunications - annales des t´el´ecommunications, vol. 64, no. 7-8, pp. 463–482, 2009.
[20] C. Moy, “High-level design approach for the specification of cognitive
radio equipments management apis,” Journal of Network and Systems Management, vol. 18, no. 1, pp. 64–96, 2010.
[21] J. Palicot, Radio Engineering: From Software Radio to Cognitive Radio. Wiley-ISTE, Aug. 2011.
[22] K. Moslehi and R. Kumar, “A reliability perspective of the smart grid,”
Smart Grid, IEEE Transactions on, vol. 1, pp. 57–64, June 2010.
[23] D. Tholomier, H. Kang, and B. Cvorovic, “Phasor measurement units: Functionality and applications,” in Power Systems Conference, 2009.
PSC ’09., pp. 1–12, March 2009.
[24] Z. Fan, G. Kalogridis, C. Efthymiou, M. Sooriyabandara, M. Ser-izawa, and J. McGeehan, “The new frontier of communications re-search: Smart grid and smart metering,” in Proceedings of the 1st
In-ternational Conference on Energy-Efficient Computing and Networking, e-Energy ’10, (New York, NY, USA), pp. 115–118, ACM, 2010.
[25] E. Hamid, P. Nallagownden, N. Mohd Nor, and M. Muthuvalu,
“In-telligent demand side management technique for industrial consumer,” in Intelligent and Advanced Systems (ICIAS), 2014 5th International
Conference on, pp. 1–6, June 2014.
[26] R. H. Khan and J. Y. Khan, “Review article: A comprehensive review of the application characteristics and traffic requirements of a smart
grid communications network,” Comput. Netw., vol. 57, pp. 825–845, Feb. 2013.
[27] A. Garcia, J. Oliver, and D. Gosch, “An intelligent agent-based
dis-tributed architecture for smart-grid integrated network management,” in Local Computer Networks (LCN), 2010 IEEE 35th Conference on,
[28] F. Bellifemine, G. Caire, and D. Greenwood, Developing Multi-Agent Systems with JADE. Wiley Series in Agent Technology, Wiley, 2007.
![Figure 1: Hierarchical and Distributed Cognitive Radio Architecture Management [20]](https://thumb-eu.123doks.com/thumbv2/123doknet/8184754.274799/8.918.207.766.185.900/figure-hierarchical-distributed-cognitive-radio-architecture-management.webp)