A FRAMEWORK FOR THE PERFORMANCE ANALYSIS AND SIMULATION OF RF-MESH ADVANCED METERING INFRASTRUCTURES FOR SMART GRID
APPLICATIONS
FILIPPO MALANDRA
DÉPARTEMENT DE GÉNIE ÉLECTRIQUE ÉCOLE POLYTECHNIQUE DE MONTRÉAL
THÈSE PRÉSENTÉE EN VUE DE L’OBTENTION DU DIPLÔME DE PHILOSOPHIÆ DOCTOR
(GÉNIE ÉLECTRIQUE) DECEMBER 2016
c
ÉCOLE POLYTECHNIQUE DE MONTRÉAL
Cette thèse intitulée:
A FRAMEWORK FOR THE PERFORMANCE ANALYSIS AND SIMULATION OF RF-MESH ADVANCED METERING INFRASTRUCTURES FOR SMART GRID
APPLICATIONS
présentée par: MALANDRA Filippo
en vue de l’obtention du diplôme de: Philosophiæ Doctor a été dûment acceptée par le jury d’examen constitué de:
M. GIRARD André, Ph. D., président
Mme SANSÒ Brunilde, Ph. D., membre et directrice de recherche M. SIROIS Frédéric, Ph. D., membre
DEDICATION
To my father, may he be proud of me as much as I am proud of him. Ciao Papì. . .
ACKNOWLEDGEMENTS
First of all, I would like to thank my research advisor Professor Sansò, who wanted me to come back from Italy after my previous experience in 2010 : it’s mainly thanks to her that I moved to Montreal and I do not regret at all my decision. Then, I would like to thank the SmartDESC project and all the involved students and professors from whom I learned a lot : a particular mention to Michel Sauvé for his passion, his inspiring life stories, and for the motivation he was able to transfer to me in a particularly delicate moment of my life, when I was in Italy and I thought I would never be able to come back and pursue my Ph.D. program. Then, I would like to thank the members of my jury for accepting to review my thesis and to play a very important role in this last stop of my Ph.D. journey.
I would also like to thank all the wonderful travelmates, with whom I shared this intense 4-year trip. My first thought is for my father, who unfortunately witnessed only the beginning of it : he is my life-mentor and what I learned from him will certainly accompany me for the rest of my life, along with all the wonderful memories permanently stored in my heart. I want to thank my whole family for the strength they are able to give me, for their unconditional love and their immense trust on my capabilities : my mum Luciana, who taught me the value of sacrifice for the people you love (as well as the art of cooking); my sister Mariassunta, who has always been a model for me with her energy and joy; my brother Andrea, who taught me the importance of being rational and balanced in every situation, even the most difficult ones; my cousin Nicola, who taught me the importance of the smile against life adversities and bad people as well as introducing me to the wonderful world of A.C. Milan; my sister-in-law Fabiana and my brother-in-law Francesco who built two wonderful and happy families with my brother and sister; and all other uncles, aunts, and cousins, who are active part of my big family. I would like to especially thank my marvelous nieces Lulu and Cici, and my awesome nephew Lollo (not to mention the forthcoming Ceciotto) : they are the light in my eyes. My love for them did not fade of a single dB in the thousands of kilometers that currently separate us. The same applies to my lifelong friends Paolo, Armando and Andrea : may our friendship never end.
A special thank goes to my football team Saskatchewan and to all the amazing teammates : Luca, Davide, Charles, Alessandro, Matteo, Alejandro, Alexandre, Ken and Agustin just to cite some of them, with whom I played, won, lost, and (most importantly) had a lot of fun. Moreover, I got in contact with a wonderful community of young Italian “emigrants” like me (Luca, Matteo, Giovanni, Eleonora, Margherita, Franco, Lidia, Alessandro, Alice,
Davide, Valentina, Carmelo, Francesco, and many many others) : with them I shared the wanderlust, the homesickness, the passion for football and for good food, some amazing trips to explore the wonderful country that hosts us, and many cups of coffee (good short Italian coffee, of course). Anyways, I did not only get along with Italian folks, but I also made new friends from all over the world : from Argentina to Netherland, from France to Spain, from Swiss to Greece, from Albania to Colombia, from Brazil to Egypt, from Tunisia to Morocco, from Syria to China, from Turkey to Iran, from Lebanon to Venezuela, from Mexico to Canada, and many others. I am infinitely grateful to them all for giving me the stability and happiness I needed to cope with the absence of family and the nostalgia. A special thank goes to Ecole Polytechnique de Montreal and GERAD, two amazing entities who provided me with everything I could need in this trip. At Polytechnique, I would like to especially thank Nathalie, for helping me to go through the jungle of the bureaucracy I crossed on my way, and Rachel, to whom I am very grateful for the precious help and for the kindness and courtesy she showed me in every occasion. I would also like to thank all the personnel at GERAD, and in particular Marie, Edoh and Pierre : they are very competent and have always been ready to help me in every kind of problems I encountered during my research. The GERAD is a very positive and powerful environment to study and work, thanks to the many students from many countries around the world : I am grateful for being a part of this multicultural research community.
At last but not least comes Loli, my girlfriend, life partner and best friend. I cannot express with words my gratitude for all she did for me (I should probably write another thesis about that...) but I want to thank her for being there with me in this experience far from our families, for deciding to leave everything behind and follow me in this adventure. I want to close with just one italian word that comes out of my heart, GRAZIE!
RÉSUMÉ
L’Infrastructure de Mesurage Avancée (IMA), conçue à l’origine pour lire à distance des compteurs intelligents, est actuellement considérée comme une composante essentielle dans le domaine des Smart Grid. Le but principal des IMAs est de connecter le grand nom-bre de compteurs intelligents installés chez les clients au le centre de contrôle de données de l’entreprise d’électricité et viceversa. Cette communication bidirectionnelle est une caractéris-tique recherchée par un grand nombre d’applications, qui visent à utiliser ces infrastructures comme support à la transmission de leurs données dans le réseau électrique, comme par ex-emple la gestion de la charge et la demande-réponse. Un grand nombre de technologies et de protocoles de communication sont actuellement utilisés dans les IMAs : parmi les solu-tions disponibles, le RF-Mesh est une des plus populaires, surtout grâce au bas coût pour l’installation et les équipements. Toutefois, le débit nominal des communications RF-Mesh est très bas, de l’ordre des dizaines de kbps, et la littérature qui traite leur performance est très limitée. Ceci pourrait en limiter l’utilisation pour des applications autres que la lecture à distance des compteurs intelligents.
Ce travail de thèse vise à développer un système de modèles et outils pour évaluer la performance des réseaux RF-Mesh et encourager leur utilisation pour un grand nombre d’applications dans le domaine des Smart Grid. Le système d’évaluation de performance proposé est constitué (i) de modèles analytiques, pour calculer la probabilité de collision en-tre les paquets transmis, (ii) d’un simulateur de réseau, pour recréer le fonctionnement des réseaux RF-Mesh dans un environnement virtuel, (iii) d’un générateur de topologie, pour créer des cas réalistes en se basant sur des données géographiques et (iv) des méthodes pour l’analyse de la performance.
Trois différents modèles analytiques ont été implémentés. Dans les deux premiers, une nou-velle formule analytique a été utilisée pour calculer la probabilité de collision entre paquets. La probabilité de collision est ensuite utilisée pour estimer le délai moyen de/vers chaque compteur intelligent dans l’IMA analysée. Par la suite, des indices de performance, basés sur le délai moyen, sont utilisés pour faire des analyses de performance : études de faisabilité pour les applications de Smart Grid, l’identification de nœuds critiques et d’éventuels goulots d’étranglement. Dans le troisième modèle analytique, la théorie de Markov-Modulated Sys-tem est utilisée pour prendre en considération d’importants détails d’implémentation, comme la probabilité de retransmission et la taille des mémoires tampons des nœuds, qui n’avaient pas été inclus dans la modélisations précédente. Ce dernier modèle fournit aussi un mode
de calcul plus précis de la probabilité de collision en raison de la plus grande complexité de modélisation, par rapport aux deux modèles analytiques précédents. Un trafic distribué selon la loi de Poisson est utilisé pour représenter le trafic généré par plusieurs types d’applications Smart Grid.
Le cadre dévaluation de la performance proposé inclut aussi un simulateur de réseau, qui a été implémenté à partir de zéro en utilisant Java et Python. L’outil de simulation permet de modéliser des parties du système, comme le routage dynamique ou des différentes distri-butions de trafic, qui sont difficiles à reproduire par un modèle mathématique. Des résultats numériques sont ainsi présentés pour montrer les différents types d’analyse qui peuvent être réalisées avec les outils proposés. Les résultats obtenus par le modèle analytique et par le simulateur de réseau ont été comparés pour montrer la cohérence entre les deux approches poursuivies dans cette thèse. En plus, le système pour l’analyse de performance, qui est objet de cette thèse, a été utilisé dans le cadre du projet Smart Distributed Storage Energy Controller (SmartDESC), un projet multidisciplinaire de gestion de la charge électrique. Les détails théoriques de l’intégration de l’outil de simulation ont été présentés, ainsi que de résultats numériques, pour montrer une des possibles applications pratiques du contenu de cette thèse.
ABSTRACT
Advanced Metering Infrastructure (AMI), originally conceived to replace the old Automated Meter Reading (AMR) infrastructures, have now become a key element in the Smart Grid context and might be used for applications other than remote meter reading. The main driver to their widespread installation is that they provide power utilities with a bidirectional connectivity with the smart meters. A wide variety of communication networks are currently proposed to support the implementation of AMIs, and, among them, the RF-Mesh technology seems to be very popular. The main reasons for its adoption are the proprietary infrastructure and the modest cost for the installation and the equipment. However, RF-Mesh systems are characterized by poor achievable data-rates in the order of 10 kbps, and their performance is not well studied in the literature. The lack of tools and methods for the performance evaluation might be a roadblock to their widespread adoption. This thesis aims at filling this gap and increase the knowledge of large-scale RF-Mesh systems to foster their use for a wide variety of applications.
We propose a comprehensive framework for the performance evaluation of large-scale AMIs adopting the RF-Mesh technology. The framework includes (i) a geo-based topology gener-ator that uses geographic data to produce realistic AMI cases, (ii) analytic models for the computation of packet collision probability and delay, (iii) a network simulator to recreate the behavior of large-scale RF-Mesh systems, and (iv) methods to evaluate the performance. Three different analytic models are included in the framework. The first two provide a novel analytic formulation of the packet collision probability in a mesh network with time-slotted ALOHA and the Frequency Hopping Spread Spectrum (FHSS) protocol : the collision probability is then used to estimate the average delay in the network, and to define and eval-uate performance indexes (e.g., critical nodes and survival function). In the third model, a complex Markov-Modulated System (MMS) is used to take into consideration important implementation details, such as the retransmission probability and the buffer size, that were not considered in the two previous models. This model also provides a more accurate com-putation of the packet collision probability. A Poisson distribution is used to represent the traffic coming from potential Smart Grid applications. The framework also includes an RF-Mesh network simulator, written in Java and Python. The tool provides additional enhanced features with respect to the analytic models, such as a dynamic routing protocol or different traffic distributions.
Numerical results are provided to show the type of performance evaluations that is possi-ble using the proposed framework. A comparison between simulation and analytic results is also proposed, showing consistency between the two models. Finally, the performance evaluation framework was applied in the context of Smart Distributed Storage Energy Con-troller (SmartDESC), a multi disciplinary load-management project. Details about the the-oretical aspect of the integration of the implemented network simulator and the SmartDESC simulator are proposed along with numerical results.
TABLE OF CONTENTS DEDICATION . . . iii ACKNOWLEDGEMENTS . . . iv RÉSUMÉ . . . vi ABSTRACT . . . viii TABLE OF CONTENTS . . . x
LIST OF TABLES . . . xiv
LIST OF FIGURES . . . xv
LIST OF SYMBOLS AND ABBREVIATIONS . . . xviii
LIST OF APPENDICES . . . xx
CHAPTER 1 INTRODUCTION . . . 1
1.1 Context and motivations . . . 1
1.2 General Objectives and Original Contribution . . . 3
CHAPTER 2 ORGANIZATION OF THE RESEARCH WORK . . . 8
CHAPTER 3 LITERATURE REVIEW . . . 11
3.1 Smart Grid and telecommunications . . . 11
3.2 AMI architectures and technologies . . . 11
3.3 Performance studies for AMIs . . . 13
3.3.1 Security . . . 13
3.3.2 Resilience . . . 13
3.3.3 Physical layer . . . 14
3.3.4 Routing and network layer . . . 14
3.4 Different approaches to the performance evaluation for Advanced Metering Infrastructures (AMIs) . . . 16
CHAPTER 4 ARTICLE 1 : ANALYTICAL PERFORMANCE ANALYSIS OF A LARGE-SCALE RF-MESH SMART METER COMMUNICATION SYSTEM . . . 18
4.1 Introduction . . . 18
4.2 State of the art . . . 19
4.3 RF mesh communication system modelling . . . 20
4.3.1 Main features . . . 20 4.3.2 Topology definition . . . 21 4.3.3 Shortest paths . . . 21 4.3.4 Traffic characterization . . . 21 4.3.5 Probability of collision . . . 23 4.3.6 Delay . . . 25 4.4 Results . . . 26 4.4.1 Collision probability . . . 26 4.4.2 Delay profile . . . 27
4.4.3 Survival function : application feasibility . . . 27
4.5 Conclusions . . . 28
CHAPTER 5 ARTICLE 2: PERF-MESH : A PERFORMANCE ANALYSIS TOOL FOR LARGE SCALE RF-MESH-BASED SMART METER NETWORKS WITH FHSS . . . 31
5.1 Introduction . . . 31
5.2 State of the Art . . . 33
5.3 RF-mesh system architecture and main features . . . 34
5.3.1 Interference and probability of collision . . . 36
5.4 PeRF-mesh . . . 37 5.4.1 Inputs . . . 37 5.4.2 Mathematical modeling . . . 39 5.4.3 Delay . . . 40 5.4.4 Other outputs . . . 40 5.5 Numerical results . . . 41 5.5.1 Collision probability . . . 41 5.5.2 Impact of FHSS . . . 42 5.5.3 Delay . . . 43
5.6 Conclusions and future steps . . . 43
CHAPTER 6 ARTICLE 3 : A SIMULATION FRAMEWORK FOR NETWORK PER-FORMANCE EVALUATION OF LARGE-SCALE RF-MESH AMIs . . . 46
6.1 Introduction . . . 46
6.2.1 Architecture . . . 49 6.2.2 Main features . . . 50 6.3 Simulation framework . . . 53 6.3.1 General structure . . . 53 6.3.2 Initialization phase . . . 53 6.3.3 Simulation phase . . . 57
6.3.4 Randomness in the simulator . . . 61
6.4 Numerical results . . . 61
6.4.1 Confidence interval analysis and results reliability . . . 63
6.4.2 Collision probability . . . 63
6.4.3 Delay analysis . . . 64
6.4.4 Activity time percentage . . . 68
6.4.5 Computational time . . . 69
6.4.6 Scalability analysis . . . 70
6.5 Conclusion . . . 70
CHAPTER 7 ARTICLE 4 : A MARKOV-MODULATED END-TO-END DELAY ANAL-YSIS OF LARGE-SCALE RF-MESH NETWORKS WITH TIME-SLOTTED ALOHA AND FHSS . . . 72
7.1 Introduction . . . 72
7.2 State of the art . . . 74
7.3 Description of the system . . . 76
7.3.1 Architecture . . . 76
7.3.2 The physical layer . . . 76
7.3.3 The MAC layer . . . 76
7.3.4 Routing . . . 77
7.3.5 Traffic characterization . . . 78
7.3.6 Example of system . . . 78
7.4 Markov-modulated System . . . 79
7.4.1 Beginning of the time-slot . . . 79
7.4.2 Transmission phase . . . 80
7.4.3 End of the time-slot . . . 83
7.4.4 Time evolution . . . 84
7.4.5 Stationary probabilities . . . 85
7.4.6 Network Delay . . . 85
7.5.1 Feasibility assessment . . . 89
7.5.2 Impact of the buffer size . . . 92
7.5.3 Visual bottleneck identification . . . 94
7.5.4 Scalability analysis . . . 94
7.5.5 Results validation . . . 96
7.6 Conclusions and future work . . . 99
CHAPTER 8 GEO-BASED TOPOLOGY GENERATOR . . . 100
8.1 Introduction . . . 100
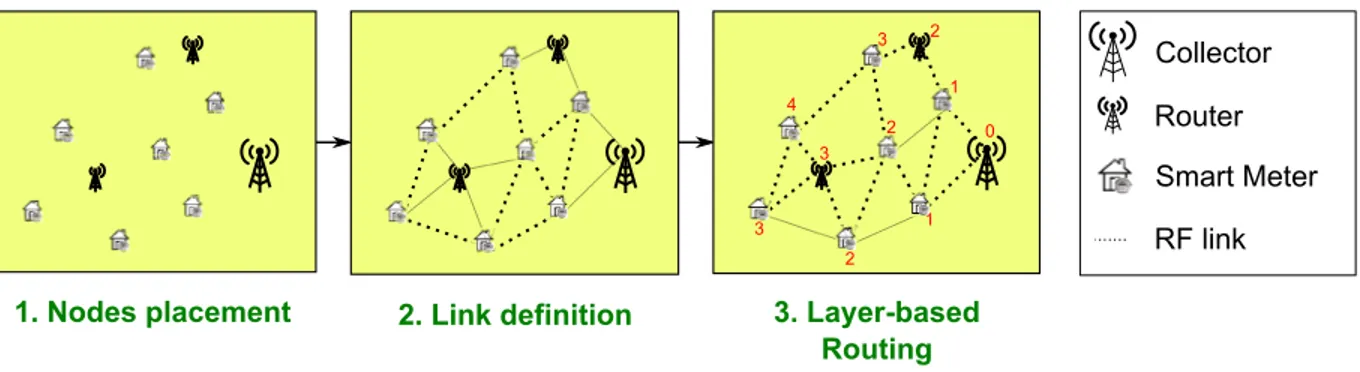
8.2 Nodes placement . . . 100
8.3 Link definition . . . 101
CHAPTER 9 SMART GRID CASE STUDY : THE SmartDESC PROJECT . . . . 105
CHAPTER 10 GENERAL DISCUSSION . . . 112
10.1 Synthesis of the work . . . 112
CHAPTER 11 CONCLUSION AND RECOMMENDATIONS . . . 114
LIST OF TABLES
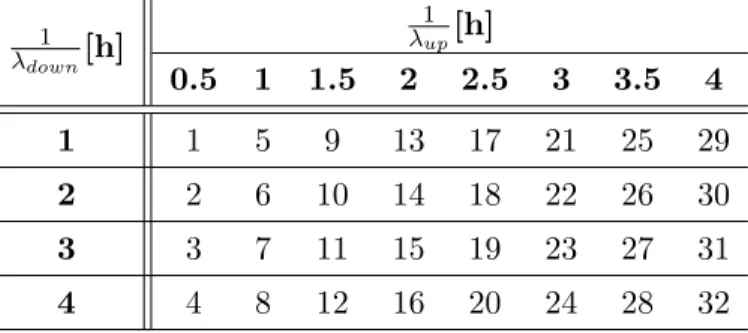
Table 4.1 Traffic scenario ID according to the values of λup (columns) and λdown (rows). . . 26 Table 5.1 Traffic scenario ID according to λup and λdown, taken from Malandra
and Sansò (2015). . . 42 Table 6.1 95% confidence intervals of the average collision probability (π)
accord-ing to different levels of 1/λu (rows) and 1/λd (columns). . . 64 Table 6.2 95% confidence intervals of the average delay (expressed in seconds)
for the different types of traffic. . . 66 Table 6.3 Average activity time percentages for smart meters (χm), routers (χr)
and data collectors (χc) for the different type of traffic according to different levels of 1/λu (rows) and 1/λd (columns) without broadcast style traffic. . . 69 Table 7.1 Average and maximum values for the number of packets in the buffer
according to different values of the buffer size Z, obtained with pr = 0.5, 1/λu = 0.125 h, and 1/λd= 0.5 h. . . . 92 Table 9.1 Table with numerical results for the telecommunications in SmartDESC
simulations, with 400 SD-controlled nodes in a network of 3300 nodes, and with one broadcast transmission and 4 uplink transmissions on average per day. . . 111
LIST OF FIGURES
Figure 1.1 Trend of the total number of installed meters for AMR and AMI in U.S. from 2007 to 2014. Data extracted from : http://www.eia.gov/
electricity/annual/html/epa_10_10.html. . . 2
Figure 1.2 Simplified architecture of the proposed performance evaluation frame-work. . . 4
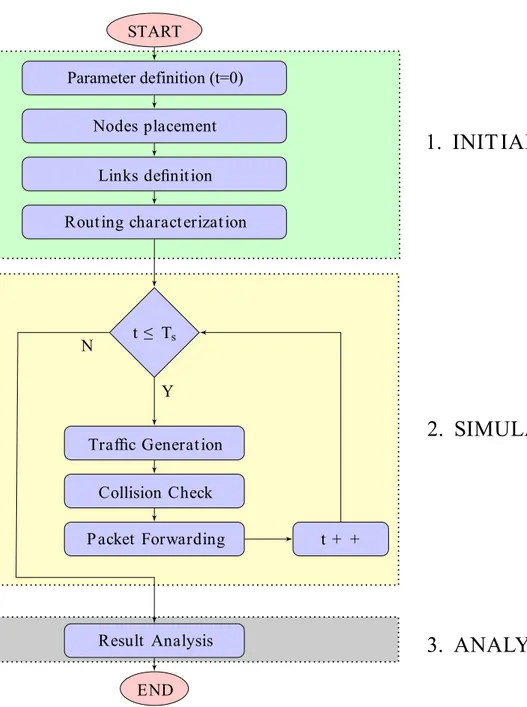
Figure 1.3 Workflow of the performance analysis engine. . . 7
Figure 4.1 Topology definition. . . 22
Figure 4.2 Scheme of the n-hop path from node i to node j. . . . 25
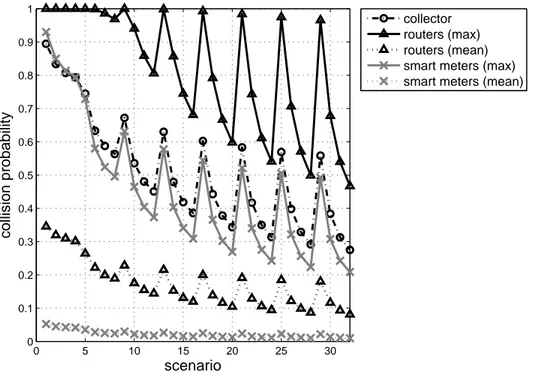
Figure 4.3 Statistics of the probability of collision of different devices in different scenarios. . . 27
Figure 4.4 Survival function of uplink delay in scenario 16. . . 29
Figure 5.1 Architecture of the whole communication system. . . 35
Figure 5.2 Example of frequency hopping sequence. . . 35
Figure 5.3 Block diagram of PeRF-mesh analytic tool. . . 38
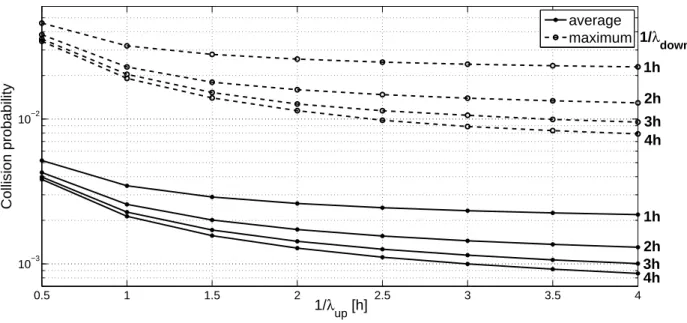
Figure 5.4 Analysis of the collision probability according to λup with fixed values of λdown. . . 42
Figure 5.5 Comparison of collision probabilities with and without FHSS. . . 44
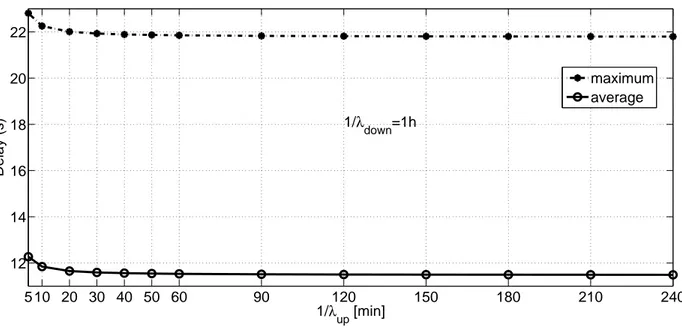
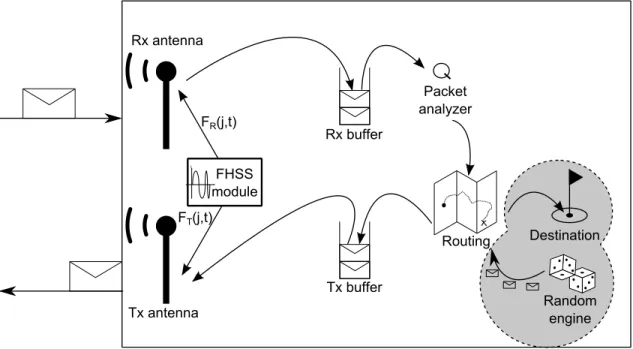
Figure 5.6 Variation of the delay according to λup with a fixed value of λdown = 1h. 44 Figure 6.1 Architecture of the RF-mesh AMI. . . 49
Figure 6.2 Example of operation of Frequency Hopping Spread Spectrum (FHSS) protocol. . . 52
Figure 6.3 Simplified architecture of the simulator. . . 54
Figure 6.4 A scheme of the initialization phase with a simple topology with 10 nodes. . . 55
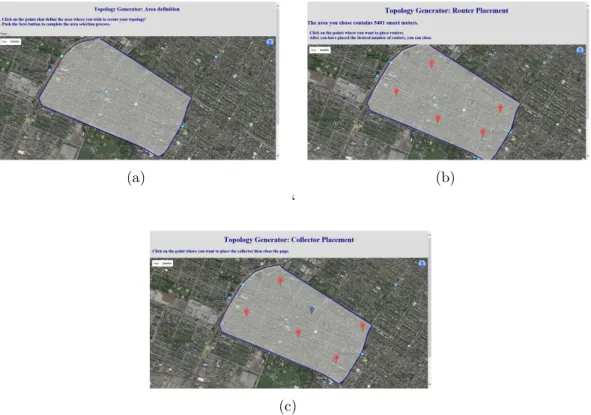
Figure 6.5 Illustration of the topology creation with the definition of a new area (Figure 8.1(a)), the choice of routers (Figure 8.1(b)), and collectors (Figure 8.1(c)). 56 Figure 6.6 Logical structure of the different types of nodes in the simulator. . . . 59
Figure 6.7 Mask used to set up initial parameters to launch a simulation. The different traffic generation parameters are circled and labeled with the corresponding letter, defined in Section 6.3.3. . . 60
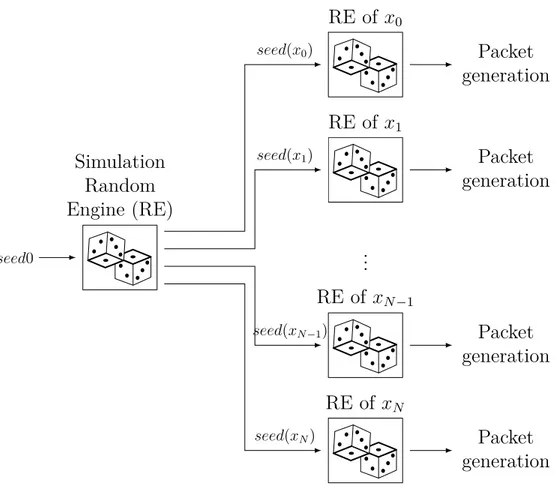
Figure 6.8 Illustration of the seed initialization and of the random packet gener-ation in the simulator. . . 62
Figure 6.9 Heat-map of the collision probability in the scenario with 1/λd= 0.5 h, and 1/λu = 0.125 h. . . . 65 Figure 6.10 Confidence intervals for Dα and Dβ traffic without broadcast traffic. . 66 Figure 6.11 Heat-map of the delay in the scenario with one broadcast transmission per
day, 1/λd= 0.5 h and 1/λu = 0.25 h. . . . 67 Figure 6.12 Computational time to perform a 7-day simulation using topologies
with a number of nodes ranging between 1718 and 20798. The quadratic regression is reported in red. . . 71 Figure 7.1 A scheme of the architecture of the RF-Mesh AMI under study. . . . 77 Figure 7.2 A toy topology with 3 smart meters (s1, s2 and s3), 2 routers (r1 and
r2) and the data collector c. . . . 80
Figure 7.3 The Markov chain representing the evolution of the states of node i from time-slot t (i.e., SB(i, t), ST(i, t), and SE(i, t)) to time-slot t + 1(i.e., SB(i, t + 1)). . . . 81 Figure 7.4 Block diagram of the performance analysis framework. . . 88 Figure 7.5 Average and maximum of the delay with respect to the mean packet
gen-eration time in downlink (1/λd) with pr = 0.5, Z = 20 packets, and 1/λu = 0.125, 0.25 h. . . . 90 Figure 7.6 Average and maximum of the delay with respect to the mean packet
gener-ation time in uplink (1/λu). . . 91 Figure 7.7 Uplink and downlink delays between smart meter i and its associated
collector c. . . . 91 Figure 7.8 Average and maximum of the delay with respect to the buffer size with
1/λd= 0.5 h. . . . 93 Figure 7.9 Average and maximum of the delay with respect to the buffer size with
1/λd= 2 h. . . 93 Figure 7.10 Heat-map of the delay in uplink and downlink with 1/λu = 450 s,
1/λd = 1800 s, buffer size of 20 packets, retransmission probability of 0.8, and 80 wireless channels. . . . 95 Figure 7.11 Convergence of the norm with respect to the number of iterations. . . 95 Figure 7.12 Computational time according to the number of links (top) and nodes
(bottom) in the topology. . . 97 Figure 7.13 RMSE (%) between the delay computed in this work and the delay
obtained with the simulator presented in Malandra and Sansò (2016) for the Villeray topology with 1/λu = 1 h, 1/λd = 4 h, Z = 20, and pr = 0.5. . . . 98
Figure 8.1 Illustration of the topology creation with the definition of a new area (Figure 8.1(a)), the choice of routers (Figure 8.1(b)), and collectors (Figure 8.1(c)). 102 Figure 8.2 Covering areas of smart meters, routers, and data collectors. . . 104 Figure 8.3 Examples of link definition between a router and a smart meter. . . . 104 Figure 9.1 Simplified architecture of the SmartDESC project with the scheduler S,
4 Electric Water-Heaters (EWHs), and the telecommunications module (TLC-SIM). . . 106 Figure 9.2 Representation of the end-to-end delay between a EWH and the
sched-uler, in the SmartDESC architecture. . . 107 Figure 9.3 Illustration with a simple SmartDESC architecture (top box, with 5
EWH, the scheduler and the TLC simulation module), and the associ-ated architecture of the telecommunications (bottom box, with 5 Smart Distributed Storage Energy Controller (SmartDESC)-controlled smart meters, 2 regular smart meters, 1 data collector, and 1 router). . . 109 Figure 9.4 Flowchart of the network simulator for the SmartDESC application. . 110 Figure A.1 Poisson-distributed traffic characterization of smart meters under the
hypotheses of static routing . . . 131 Figure A.2 Poisson-distributed traffic characterization of routers under the
hy-potheses of static routing . . . 132 Figure A.3 Poisson-distributed traffic characterization of data collectors under the
LIST OF SYMBOLS AND ABBREVIATIONS
AMI Advanced Metering Infrastructure
AMR Automated Meter Reading
AODV Ad-hoc On-demand Distance Vector
DAG Directed Acyclic Graph
DCU Data Collection Unit
DoE Department of Energy
DSR Dynamic Source Routing
FERC Federal Energy Regulatory Commission
EV Electric Vehicle
EWH Electric Water-Heater
FHSS Frequency Hopping Spread Spectrum
GIS Geographic Information System
GUI Graphical User Interface
HAN Home Area Network
ICT Information, Communication, and Technology
IMA Infrastructure de Mesurage Avancée
IoT Internet of Things
ISM Industrial, Scientific, and Medical
LPWAN Low Power Wide Area Network
MAC Media Access Control
MDMS Metering Data Management System
NAN Neighborhood Area Network
NIST National Institute of Standards and Technologies
ORPL Opportunistic RPL
PLC Power Line Communications
RFI Request For Information
RMSE Root Mean Square Error
RPL Routing Protocol for Low-power and lossy networks
SmartDESC Smart Distributed Storage Energy Controller
V2G Vehicle-to-grid
WAN Wide Area Network
WMN Wireless Mesh Network
LIST OF APPENDICES
Appendix A Poisson-distributed traffic characterization . . . 131 Appendix B Additional mathematical proofs for the Markov-modulated model in
CHAPTER 1 INTRODUCTION
1.1 Context and motivations
The traditional power grid, with its old and centralized architecture, is incapable of satisfying the power needs of the modern society, with the global population constantly increasing and a large number of electronic devices available at an affordable price. As a consequence, the last decades have witnessed the rise of the Smart Grid concept, that renews and restructures the energy sector : the main idea is to make the existing power grid smarter and able to keep pace with the technological breakthroughs in other sector.
The introduction of smart meters paved the road for the implementation of smart grids on a large scale. Smart meters were conceived to perform the remote reading of the power consumption at the customer premises. They were only intended to replace the old mechanic power meters, which were not able to communicate and required periodic human reading. The first kind of communication infrastructure among smart meters was the so-called Automated Meter Reading (AMR) network, which was put in place by power utilities to remotely read the reader without sending an operator at all the premises. However, the unidirectional flow of information provided by AMR communication networks soon became insufficient to cope with the smart grid paradigm, for which the two-way communication between the power utility and the endpoints of the grid is fundamental.
AMIs were proposed to go beyond the limits of AMR systems and provide bidirectional connectivity between the smart meters and the power utility Metering Data Management System (MDMS). In Figure 1.1, the total number of installed meters in U.S. is shown for both AMR and AMI. The graph shows how the installation of AMI meters in U.S. has progressively replaced the installation of new AMR meters. The two-way AMI connectivity allows the power utility to send feedback to the customers (e.g., to change the price according to the availability of energy), to control devices at distance (e.g., water-heaters or space heaters), to perform load-management, to enhance the monitoring and awareness of all the elements of the grid (e.g., substations, smart meters). The peculiarities of AMIs are the high number of nodes, the data confidentiality, the large geographic extension of the topology (e.g., in rural areas), and the high concentration of nodes (e.g., in urban areas). Wireless solutions prevail over wired networks because of their flexibility, reduced equipment cost, and ease of installation. A wide variety of wireless technologies and protocols has been proposed so far to support AMI : the most widespread are ZigBee, WiFi, 802.15.4, 6LoWPAN, cellular (2G, 3G, and 4G), satellite, and RF-Mesh.
2007 2008 2009 2010 2011 2012 2013 2014 0 1 2 3 4 5 6x 10 7 Year Nu m b e r of in s t al le d m e t e r s AMR AMI
Figure 1.1 Trend of the total number of installed meters for AMR and AMI in U.S. from 2007 to 2014. Data extracted from : http://www.eia.gov/electricity/annual/html/epa_10_ 10.html.
RF-Mesh, despite the low achievable data-rates, is becoming particularly popular for AMI and is currently being considered by a large number of smart meter manufacturers as a built-in solution built-in their devices. Suffice it to say that Aclara, Itron, and Landys&Gyr — smart meters manufacturers that own 76.5% of the market share in North America, according to Navigant Research (2016) — install RF-Mesh radio in their systems1. RF-Mesh AMI are
cost-effective and use a proprietary infrastructure, which drastically reduces the dependence of power utilities on telecommunication providers : this is why RF-Mesh systems are being currently considered as a valuable AMI solution.
Despite their popularity, the performance of RF-Mesh has not been thoroughly studied in the current literature. One of the main causes is the lack of data : RF-Mesh systems are usually installed as black-boxes and many implementation details are covered by strong confidentiality agreements, which undermine their public dissemination. The lack of a thorough RF-Mesh performance literature considerably restrain their use for purposes other than remote read-ing : the introduction of new applications in a communication system needs a preliminary
1For more information, http://www.greentechmedia.com/articles/read/
performance evaluation of the system, to see if it is capable of meeting thee communication requirements of the applications.
1.2 General Objectives and Original Contribution
As highlighted in Section 1.1, RF-mesh systems are more and more widespread in the context of AMI, and an increasing number of applications could benefit from its use. It is therefore the main objective of this thesis to provide a framework for the performance analysis of RF-Mesh systems. For this, we developed insight on the following issues.
• Large-scale instances
RF-Mesh AMI are composed of several thousands of smart meters. The large number of nodes considerably affect the analysis because it increases the computational burden associated to both simulations and analytic models. It is important to propose methods and models that are computationally efficient and able to work with thousands of nodes. • Wireless environment prone to collision
The free and unlicensed Industrial, Scientific, and Medical (ISM) bandwidth entails high chances of packet collisions. The Colliding packets need to be retransmitted, increasing the delay and degrading the performance. A correct model for the collision probability is key to an accurate representation of the RF-Mesh systems. The collision probability calculation needs to consider the presence of the FHSS protocol.
• Geographical distribution of nodes
A RF-Mesh topology includes smart meters, routers, and collectors, that are far from being randomly distributed in space. In particular, smart meters are installed at resi-dential and commercial premises, which follow peculiar spatial distributions. The use of geographic data to build up the topology permits more realistic instances and produces a more accurate analysis.
• Black-box nature
RF-Mesh implementation details are usually covered by strict confidentiality agree-ments and not available to the public. The difficulty in retrieving valuable data jeop-ardizes the development of performance studies and needs to be addressed by means of what-ifs analyses and reasonable assumptions.
Topology generation Analytic= modelling Network simulation Network simulation
T
T
T
?
?
?
?
Power= utility 1.=Network design 3.=Visual analysisPerformance=Evaluation=Framework
T
==Topology 1.=Network design 2.=Feasibility assessment 3.=Visual analysisFigure 1.2 Simplified architecture of the proposed performance evaluation framework.
The nominal capacity of wireless links is in the order of tenths of kbps, which does not seem to keep up with current and more advanced communication system. The 4G, for instance, can ideally achieve 100 Mbps, roughly ten thousands time faster than RF-Mesh. The low achievable datarates need to be considered in the analysis.
• MAC layer
The access to the communication medium, which is managed according to the slotted ALOHA protocol, plays a key role in the performance evaluation because it largely affects the packet collision probability calculation.
• Network layer
The network layer, and in particular the choice of the routing protocol, are very im-portant in the definition of the network performance. Even though details about the routing protocols are not always available, it is fundamental to include the routing in the performance evaluation framework because it has an impact on the packet delay. • Lack of data Given the scarcity of performance studies in the literature, validation
must be carried out through simulations and analytical studies.
In order to cope with these requirements, a performance evaluation framework was proposed to analyze large-scale RF-Mesh systems. The structure of the proposed framework is
illus-trated in Figure 1.2 showing the following possible usages, from a power utility’s perspective :
1. the design of a new RF-Mesh system;
2. the feasibility assessment of potential applications in a given infrastructure; 3. the visual identification of potential bottlenecks.
The following major original contributions have been produced during the doctoral program :
1.2.1 Performance analysis tools
Three different mathematical models were proposed to find analytic equations to calculate variables representing the state of the system (e.g., collision probability, delay) according to relevant input parameters (e.g., topology, traffic, routing), as shown in the prototype architecture in Figure 1.3.
The first model, described in detail in Chapter 4, proposes an expression for the collision probability and the delay, with a basic interference model not considering the FHSS protocol. The second model, discussed in Chapter 5, introduces and analyzes the impact of FHSS on the collision probability and the delay. In the third model, described in Chapter 7, a more complex Markov-Modulated System (MMS) was used in order to include in the analysis important implementation details, such as the buffer size and the retransmission probability, not included in previous models.
1.2.2 Network simulator
A RF-Mesh network simulator, described in Chapter 6, was developed from scratch using Java and Python to obtain numerical results to be compared to the analytic results. The simulator proved to be computationally efficient allowing the evaluation of several thousand node instances in a reasonable time (few hours at maximum). The simulator yields the delay and other performance indexes, enabling a wide variety of performance analyses, as reported in Section 6.4. Moreover, the user can choose between two types of routing, shortest path and layer-based. Two different types of traffic are implemented : (i) Poisson-distributed (as in the analytic), and (ii) deterministic (e.g., scheduled broadcast transmissions at the collector side). Simulation results were compared to the analytic results, as highlighted in Section 7.5.5, showing consistency between the two different approaches.
1.2.3 Geo-based topology generator
The tool, described in Chapter 8, produces realistic topologies that are used throughout the work. Publicly available datasets were employed to retrieve the position of smart meters, whilst the position of routers and collectors was chosen in a map, according to the data published in Hydro-Québec (2012).
1.2.4 Dedicated simulation module for the SmartDESC project
A modified version of the network simulator was developed to be used in the SmartDESC project, a load-management project whose main purpose was to optimally control several mil-lions of electric water heaters installed in Québec. The telecommunication module, described in Chapter 9, was needed to emulate the behavior of an AMI, to study its performance, and to verify whether it was able to meet the communication requirements (e.g., the delay) of the SmartDESC project.
Routing Traffic ... Critical nodes Delay Survival function Collision probability Topology
Performance
Analysis
Engine
CHAPTER 2 ORGANIZATION OF THE RESEARCH WORK
This thesis is structured by articles and is composed of 4 papers : • Published in peer-reviewed conference proceedings :
1. F. Malandra, B. Sansò. Analytical performance analysis of a large-scale RF-mesh smart meter communication system. Innovative Smart Grid Technologies Confer-ence (ISGT), 2015 IEEE Power & Energy Society, 1-5, Washington, 2015. Pre-sented in Chapter 4.
2. F. Malandra, B. Sansò. PeRF-Mesh : A performance analysis tool for large scale RF-mesh-based smart meter networks with FHSS. 2015 IEEE International Confer-ence on Smart Grid Communications (SmartGridComm), 792–797, Miami, 2015. Presented in Chapter 5.
• Submitted to peer-reviewed journals :
3. F. Malandra et B. Sansò, (2016), A Simulation Framework for Network Perfor-mance Evaluation of Large-Scale RF-mesh AMIs. Simulation Modelling Practice and Theory, pp. 26. Presented in Chapter 6.
4. F. Malandra et B. Sansò, (2016), A Markov-modulated End-to-end Delay Analysis of Large-scale RF-Mesh Networks with Time-slotted ALOHA and FHSS. IEEE transactions on wireless communications, pp. 30. Presented in Chapter 7.
The main contribution of this thesis are :
• three mathematical models, for performance evaluation and feasibility assessment • a network simulator, implemented from scratch, for performance evaluation and result
validation
• a topology generator, that produces large-scale instances based on Geographic Infor-mation System (GIS) data
• a dedicated simulation module for the telecommunications used in SmartDESC, a load-management project partially funded by Natural Resources Canada
• Introduction and literature review
• Modelling theory (analysis and simulation) • Practical implementations and case study • Conclusion and general discussion
• Annexes
The first part is composed of Chapters 1 and 3 : Chapter 1 includes the introduction to the subject, the context, the motivation, the research objectives and the main achievements of this thesis; Chapter 3 contains a critical review of the literature.
The second part is composed of the four papers, each included in a dedicated chapter. The three mathematical models are presented in Chapter 4, 5, and 7. In the first model, a large-scale RF-Mesh system is analyzed. An analytic formulation is proposed to calculate the probability of collision. Based on that, the multi-hop delay is computed and some perfor-mance indexes are defined and used in the perforperfor-mance analysis. The system under study is characterized by a shortest path routing, a Poisson-distributed traffic in the uplink and in the downlink, and a time-slotted ALOHA MAC. However, the FHSS protocol was not included in the modelling. As a consequence, the results proved the necessity of adopting a protocol to mitigate interference, such as FHSS. In the second model, presented in Chap-ter 5, the analyzed system is akin to that considered in ChapChap-ter 4, but the FHSS protocol was included in the collision probability formulation. The results showed the high impact on the performance of the FHSS protocol. Even though the first two analytic models allow valuable performance analyses of RF-Mesh systems, several implementation details were not included in the modelling, such as the retransmission probability and the buffer size. An enhanced analytic model, that aims at filling this gap, is proposed in Chapter 7. A MMS modelling was used to represent the state of each node at each time interval. This permits to have more accuracy in the collision probability calculation. For instance, the state of the system not only accounts for the transmission probability but also considers the destination of the transmission : this considerably affects the collision probability and produces more accurate results, as confirmed in the validation analysis proposed in Section 7.5.5. Finally, a RF-Mesh network simulator was conceived and implemented from scratch, using Java and Python. The simulator, presented in Chapter 6, proposes a completely different approach to the RF-Mesh performance evaluation with respect to the previously mentioned analytic models. In particular, the packet delay is simply calculated as the difference between the arrival time and the generation time of each packets. The network simulator permits to
choose between a shortest path routing, as in the analytic modelling, and the more dynamic layer-based routing.
The third part includes the implemented topology generator and a case study. The topology generator is employed to produce the instances in all the aforementioned papers and is described with detail in Chapter 8. In Chapter 9, a smart grid case study is presented to show the capabilities of the proposed RF-Mesh performance evaluation framework. The fourth part of the thesis is composed of Chapter 10, which contains the concluding remarks and presents the synthesis of the work, and of Chapter 11, which includes the a discussion on the limitation of the proposed solution and some recommendations about future work.
The last part includes two appendices : Appendix A provides some additional detail on the Poisson-distributed traffic characterization, which is used throughout this thesis; Appendix provides additional mathematical proofs concerning the model presented in Chapter 7.
CHAPTER 3 LITERATURE REVIEW
3.1 Smart Grid and telecommunications
The Information, Communication, and Technology (ICT) sector can be considered a funda-mental resource to facilitate the advent of the Smart Grid. The role of ICT in this context is investigated by a large branch of the literature. Recent surveys on this topic can be found in Erol-Kantarci and Mouftah (2015), Khan et al. (2016), El-Hawary (2014), and Farhangi (2014). A complete overview of the recent research developments can be found in Colak et al. (2015), Tuballa and Abundo (2016), and Bayindir et al. (2016). Other interesting surveys, useful to understand the leading objectives envisioned for the next years, are Hassan and Radman (2010), El-Hawary (2014), Farhangi (2014), and Hossain et al. (2016).
A Smart Grid requires the coexistence and integration of several networks and entities, mak-ing a standardization process fundamental. The National Institute of Standards and Tech-nologies (NIST) was one of the first to put effort into this theme, presenting a framework to coordinate the wide range of involved actors in the domain of Smart Grid NIST (2010). Lo and Ansari (2012) carried out a combined analysis of the power grid and the communication infrastructure, discussing the interconnections between the two systems; in particular they re-viewed the main Smart Grid applications, highlighting their communication requirements. In US DoE (2010a), a very interesting report published by the U.S. Department of Energy (DoE) in cooperation with the Federal Energy Regulatory Commission (FERC) and the NIST, six prime Smart Grid functionalities were identified together with their communication needs : (i) AMI, (ii) demand-response, (iii) electric vehicles, (iv) wide-area situational awareness, (v) distributed energy resources and storage, and (vi) distribution grid management. The rest of this chapter focuses on AMIs since it is the object of this thesis.
3.2 AMI architectures and technologies
AMIs are widely employed in Smart Grids, because they provide bidirectional communication between the power utility and the end points of the grid (i.e., the smart meters). An overview of current AMI deployments around the world can be found in Kabalci (2016), Lopez et al. (2015), Abdulla (2015), Chren et al. (2016), and Chakraborty and Shaniia (2016). Details on the recent initiatives and the ongoing projects involving AMIs can be found in Renofio et al. (2016), Garcia-Hernandez (2015), and Foudeh and Mokhtar (2015).
The communication requirements of AMI systems are strictly dependent on the type of ap-plication that is sought and on its communication requirements. In 2010, the US DoE also published US DoE (2010b), a Request For Information (RFI) to gather the communication requirements identified by several actors involved in the Smart Grid and to ease the standard-ization process : power utilities, telecommunication providers, wireless device manufacturers and customers representatives were asked to express their opinion and recommendations. In US DoE (2010a), the replies to the RFI are reported : the interviewed companies published their communication needs (e.g., delay tolerance and service reliability) associated to differ-ent Smart Grid applications (e.g., home energy managemdiffer-ent and demand-response). Gungor et al. (2013) provided additional data about the communication requirements for different applications. According to the authors, many applications (demand-response, load-control, dynamic pricing, billing, Vehicle-to-grid (V2G) and Electric Vehicles (EVs) charging) seemed to be delay-tolerant and potentially suitable for RF-mesh AMIs.
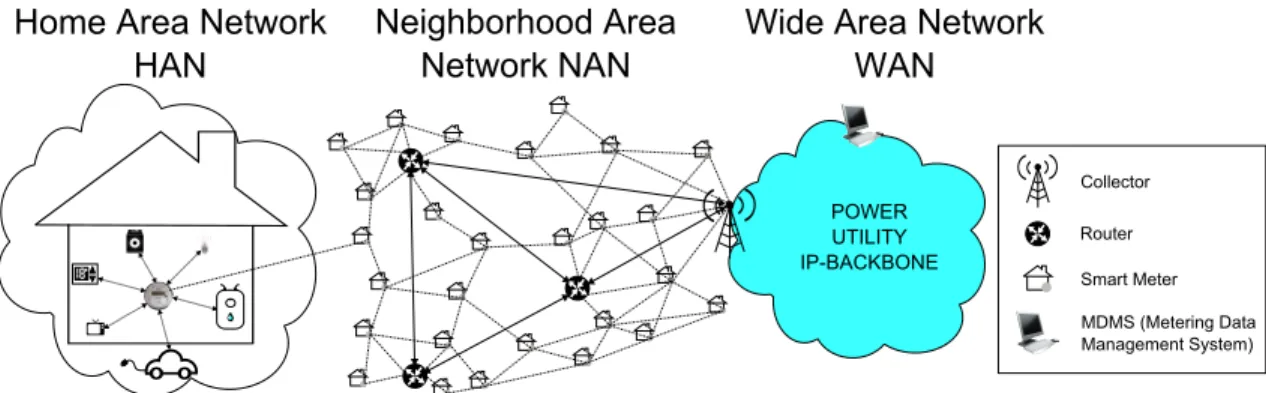
The most common types of AMI have a layered architecture, generally composed of a Home Area Network (HAN), which includes the short-range communications within a house, a Neighborhood Area Network (NAN), which relays data from several houses to a collector, and a Wide Area Network (WAN), an IP-backbone connecting all the data collectors to the MDMS, in charge of analyzing the smart meter data. Several technologies and protocols are adopted in AMIs and can be classified according to the layer of the architecture where they are used : more information about HAN, NAN, and WAN can be found in Noorwali et al. (2015), Ramirez et al. (2015), and Ali et al. (2016) respectively.
Gungor et al. (2011) proposed a critical review of the existing communication technologies used in the Smart Grid, describing their main features, benefits, limitations and range of application. Multiple papers study AMIs adopting wireless technologies that are considered standards, such as WiFi (e.g., in Tonyali et al. (2016), Sousa et al. (2015), Hu et al. (2015), Ramirez et al. (2015), and Michaloliakos et al. (2016)), cellular networks (e.g., GSM in Das and Saikia (2015), 3G in Athanasios and Cottis (2016), and LTE in Carlesso et al. (2015) and Yaacoub and Kadri (2015)), ZigBee (e.g., in Somkaew et al. (2014), Parvez et al. (2016), Chang et al. (2015), Peng and Huang (2016), and Chi et al. (2016)), RF-Mesh (e.g., in Lichtensteiger et al. (2010)), Z-wave (e.g., in Alliance (2011), Zareei et al. (2011), and Amaro et al. (2011)), Bluetooth (e.g., in Bluetooth (2010) and Wang et al. (2013)), and Low Power Wide Area Networks (LPWANs) (e.g., LoRa in Vangelista et al. (2015)).
3.3 Performance studies for AMIs
An increasing percentage of research proposes performance studies for wireless AMIs : recent surveys on this topic can be found in Mohassel et al. (2014), Sharma and Saini (2015), and Namboodiri et al. (2012). The existing body of literature proposes performance studies focusing on several specific aspects of AMIs, such as security, resilience, physical and network layer protocols. The different topics are treated in the rest of this section.
3.3.1 Security
The theme of security is central in many studies (Anzalchi and Sarwat (2015), Bhatia and Bodade (2014), Somkaew et al. (2014), Soykan et al. (2015), and Tonyali et al. (2016)) because AMIs usually deal with confidential data, that need to be protected. Accordingly, smart meter manufacturers have to adopt severe hardware counter-measures to unexpected intrusion in their devices. AMIs are prone to several types of attacks. One of the most common is the so-called eavesdropping, in which the intruder intercepts some traffic, decrypts it, and gains access to confidential data : as highlighted in Grochocki et al. (2012), this type of attack may result in the theft of sensitive customer information and can be blocked by adopting more robust encryption techniques. Another security threat is brought by the so-called distributed denial of service attack, analyzed in Jin et al. (2011) : this type of attack is usually directed to Data Collection Units (DCUs) and consists in tampering the regular operation of the smart meters by installing malware, which is used to flood the DCU with a large number of malicious packets. A good countermeasure to this attack consists in using stronger authentication mechanisms, that prevent unauthorized users from controlling the smart meters. A third possible AMI vulnerability might be the fraudulent use of the connect/disconnect feature : the intruder can take control of a DCU, and unexpectedly disconnect some smart meters from the grid, without being detected by the power utility. Two of the most widespread solutions to the aforementioned issues are advanced data encryption techniques, as discussed in Somkaew et al. (2014); Soykan et al. (2015); Tonyali et al. (2016), and strong authentication mechanisms, as presented in Lee et al. (2014) and Thomas et al. (2012).
3.3.2 Resilience
The resilience of AMI networks can be defined as their capacity to resist to unexpected node or link failures. Some authors decided to focus on the topology design in order to assure network resilience. Hartmann et al. (2014) proposes a generator of random but realistic
topologies, according to some resilience parameters, such as the maximum number of smart meters per concentrator or the maximum number of hops between each smart meter and the concentrators. Another methodology for the topology design was proposed by Renofio et al. (2016), and consists in choosing the location of gateways in a given topology in order to assure a minimum number of independent paths from the gateway to each smart meter. An interesting study of the resilience of AMIs using WiFi is Aruzuaga et al. (2010), where the authors propose the employment of a mixed single-hop multi-hop architecture to enhance the network resilience. In Galli et al. (2011), graph theory is exploited to measure the network resilience and the ability to resist to malicious attacks.
3.3.3 Physical layer
AMIs are characterized by a large number of nodes sharing the same physical resources (e.g., bandwidth, number of channels). Moreover, the use of additional resources is usually very expensive, and the availability of new frequencies is not always guaranteed : this might be a limiting factor to the development of wireless networks in some geographic areas. As a consequence, a large part of the existing literature deals with the performance of the physical layer and investigates new fashions to improve the efficiency of the communication medium. The most widespread solutions to improve the AMI physical layer performance are (i) the adoption of new coding schemes (e.g., in Arias and Rodriguez (2015); Ayala and Rodriguez (2014); Le and Benjapolakul (2016)), (ii) the exploitation of new spectrum opportunities (e.g., in Riascos et al. (2015), Parvez et al. (2016), Khan et al. (2016), and Sousa et al. (2015)), and (iii) the employment of new modulation techniques (e.g., in Oh et al. (2015) and Zeng et al. (2012)).
3.3.4 Routing and network layer
AMIs are conceived to connect the power utility MDMS to all smart meters in its power grid. Managing the routing of packets in such a large and heterogeneous network is not straight-forward. Sabbah et al. (2014) provides an interesting overview of the networking difficulties in the context of Smart Grid. First, it is difficult to design a routing protocol able to work with the heterogeneous traffic produced by the diversity of Smart Grid applications. Then, a wide variety of different technologies coexist in a Smart Grid infrastructure : accordingly, a multitude of different routing protocols — each suitable for a subset of the technologies — have been proposed, leading to a lack of standardization and difficult inter-operability between the various segments of the architecture. In Saputro et al. (2012), a large number of routing protocols are evaluated and subdivided by the layer of AMI architecture in which
they are used, and by the types of applications for which they are well suited. Another limiting factor of routing in AMIs is that smart meters just provide basic communication features, with a limited throughput; therefore, routing protocols have to be simple and not computationally hungry : for instance, smart meters have limited storage capacity and can-not host very large routing tables nor implement complex routing algorithms. The most widespread routing mechanisms adopted in AMIs are Routing Protocol for Low-power and lossy networks (RPL), Ad-hoc On-demand Distance Vector (AODV), geographic-based, and layer-based, as discussed in Ramirez et al. (2015), Elyengui et al. (2015), and Hu et al. (2015). RPL, thoroughly described by Wang et al. (2010) and Tripathi et al. (2010), is a routing mechanism compatible with the IPv6 standard. It is based on the use of Directed Acyclic Graphs (DAGs) to create a topology in which each node has a rank, to represent its position with respect to the others. DAG formation process is started by the collector and the metrics is based on the expected transmission count, computed using the acknowledgements of the Media Access Control (MAC) layer. Opportunistic RPL (ORPL) is an interesting variant of the RPL protocol : it aims at increasing AMI reliability by exploiting the wide variety of paths (i.e., DAGs) which characterizes AMI topologies, as discussed in Gormus et al. (2011). AODV, a reactive protocol proposed in Perkins and Royer (1999), was primarily conceived for mobile ad-hoc networks, but is also used in networks whose topology frequently changes : routes are established and maintained only when necessary. Route discovery is performed with simple control messages, such as route requests, route replies, and route errors. Some variants of AODV use Hello packets to improve local connectivity management. The perfor-mance of the AODV protocol in the Smart Grid context is investigated in Cheng et al. (2013), Farooq and Jung (2013a), Pozveh et al. (2016), Farooq and Jung (2013b), and Kathuria et al. (2013).
Dynamic Source Routing (DSR) is a family of protocols in which the path is fully decided at the source Johnson et al. (2007). Its advantage with respect to AODV is that the complexity is located at the root node; on the other hand, AODV is more resistant to link failures and more reactive to changes in general. The so-called layer-based routing, discussed in Chen et al. (2012), is a DSR protocol and is widely employed in AMIs. The protocol is based on the layer-index, which is assigned to each node in the layer-formation phase and is updated by means of the layer-updates, small packets which are exchanged in case of route changes. According to this protocol, the data collector has index 0, its neighbors have index 1, and so on. The hierarchy is structured so that each node chooses just one neighbor (with lower layer index) and transmits to it all the uplink packets. On the other hand, the routing for the downlink packets is determined by the data collector, which is the source. This routing
protocol is simple and dynamic : it can quickly react to topology changes by using the layer-updates to establish new routes.
Geographical routing is also quite popular in AMIs : this family of protocols relies on GPS coordinates only. Examples can be found in Xiang et al. (2012) and Zahariadis et al. (2009). Zahariadis et al. (2009) presents a model aiming at insuring a reliable routing in very extended Wireless Sensor Networks (WSNs), while Xiang et al. (2012) achieves better performance in terms of packet loss and reliability, with an increased latency of only 2 ms.
Another well-known family of protocols used for AMI routing is tree balancing, similar to RPL, with a topology composed of several trees with the collector on top. Kulkarni et al. (2012a) proposed TREEB, a tree balancing method in which the state of concentrators is included within the information provided to the smart meters; a balanced repartition of flows is obtained by penalizing routes beyond a certain utilization and crowded routers.
3.4 Different approaches to the performance evaluation for AMIs
Besides the choice of different technologies, protocols, and architectures, the existing body of literature addressing the performance evaluation of AMIs can be categorized according to the main followed approaches, which are (i) field trials, (ii) mathematical analysis, and (iii) network simulation.
Field trials are used to analyze the performance of already implemented systems, allowing to catch unexpected properties (e.g., unattended blockages, or failures) which are hard to be detected with simulations or analyses. Nevertheless, the large number of devices (expensive and difficult to procure) and data confidentiality issues hinder the widespread use of field-trials for AMIs. A properly designed network simulator allows to reproduce the standard operation of an AMI in a virtual environment at reduced cost with respect to field trials. This is particularly useful in order to conceive and evaluate new system features (e.g., new techniques to mitigate wireless interference). Unfortunately, the associated computational burden may hamper the applicability of this methodology to very large-scale AMIs. Finally, the analytic approach permits to reduce the computational cost, with respect to simulations. Moreover, the outcome of mathematical analyses can easily be extended to different scenarios and case studies. Nonetheless, in order to reproduce complex system details in a mathemat-ical model, it is necessary to use assumptions that might undermine the model accuracy and fitness to reality.
Additional details on the analytic and field-trials approaches — especially centered on RF-Mesh AMIs — can be found in Sections 4.2 and 5.2; while a thourough analysis of the previous simulations studies of AMIs is reported in 6.1.
CHAPTER 4 ARTICLE 1 : ANALYTICAL PERFORMANCE ANALYSIS OF A LARGE-SCALE RF-MESH SMART METER COMMUNICATION
SYSTEM
F. Malandra et B. Sansò, (2015), “Analytical performance analysis of a large-scale RF-mesh smart meter communication system”, Innovative Smart Grid Technologies Conference (ISGT), 2015 IEEE Power and Energy Society, Washington, DC, 2015, pp. 1-5. http: //ieeexplore.ieee.org/stamp/stamp.jsp?tp=&arnumber=7131840&isnumber=7131775.
Abstract
Advanced meter infrastructures (AMIs) are now widespread and their importance within smart grid systems continues to increase with the advent of new applications. Performance analysis of the infrastructure is key to assess the limits of application deployment. However, due to the large-scale nature of AMI networks that are often composed of tens of thousands of nodes per collector, performance analysis is often carried out in contained experimental trials. To our knowledge, no thorough mathematical performance analysis of real-sized systems has been carried out so far. In this work, we present a model to analyze the performance of a large-scale RF-AMI system and show its application to large-scale real-case scenarios.
4.1 Introduction
AMI systems are increasingly popular and massive worldwide installations of smart meter devices is currently ongoing. Several studies forecast an acceleration of this process in the following years, mainly driven by the large revenues expected from the use of smart meter applications within the smart grid market.
Several technologies can be adopted but the RF-mesh based system seems to be one of the most popular. RF-mesh systems are mainly used for remote reading, advanced metering and for some other applications, such as demand-response or load management, that do not have strong requirements in terms of bandwidth and delay. However, utilities, that have spent millions of dollars installing such a widespread communication infrastructure, may want to exploit it for other types of applications that, in some cases, may require shorter response time.
A fundamental question that arises in this context is how to be able to assess the limits of the installed infrastructure. Two methods can be though of : stochastic simulation and field
trials. The difficulty of stochastic simulation lays on the size of the system, that may contain thousands of nodes, thus requiring specialized codes for parallel implementation and still would need a very large amount of resolution time Lichtensteiger et al. (2010). On the other hand, field trials are limited, because they depend not only on the particular conditions of the households involved in the trial, but also on the time those trials are carried out. In fact, depending on the application, load conditions may influence the amount of communication that can be exchanged and load conditions greatly vary with time of day, month and season, among others. Moreover, the nature of field trials is observation-based, as, most of the time “what ifs" cannot be easily implemented.
There is, therefore, an important need for a flexible analytical model for large scale RF-smart meter performance evaluation that would allow not only to assess the current system, but also do extended “what ifs" studies, study the suitability of the system for future applications as well as help in the assessment of the features most needed in the evolution of the system. The object of this work is precisely to fill this gap by proposing an analytical characterization of large-scale RF-smart meter performance.
The document is structured as follows : section 4.2 is a brief overview on the literature concerning the performance of wireless mesh networks, with a particular attention to smart grid applications; section 4.3 presents the modelling of the system as well as some relevant performance indexes; section 4.4 reports some results; section 4.5 summarizes the conclusions of this work.
4.2 State of the art
An RF-based AMI system is a largely distributed wireless mesh network for which it is extremely difficult to put in place stochastic simulation results given its large scale. Never-theless, some authors have attempted this approach (e.g., AlMajali et al. (2012); Iyer et al. (2011); Lichtensteiger et al. (2010); Patel et al. (2011)). Others have dealt with real-time trial measurements. For instance, Cespedes et al. (2012) reported some results obtained in a real AMI while Kulkarni et al. (2012b) combined the simulation approach with real-time measurements.
Our methodology is totally analytic and, in that respect, it is based on fundamental findings of wireless networks performance.
Interference among the links is a key issue to assess wireless mesh network performance. Jain et al. (2005) defined a connectivity graph and associated to it a conflict graph, using the information on nodes, links and distances. The problem of maximum throughput was
transformed into the search of the maximum independent set (a set of vertices that can transmit simultaneously), which is a NP-hard problem and which does not guarantee a solution. Nandagopal et al. defined a contention graph using flows rather than links to account for interference : the objective of the authors was to provide a fair access to the medium to different commodities. Kodialam and Nandagopal (2003) tackled the problem of performance analysis in a multi-hop wireless network focusing on routing and scheduling. The authors modelled the problem as a graph-coloring one and assumed a simplified interference model in which each node cannot transmit and receive on the same channel at the same time. In our work, we took inspiration from this paper in what concerns the interference analysis, that is one of the steps needed to develop the analytic tool for performance evaluation. The other issue that has a strong impact in the overall network performance is the effect of the MAC layer, that, in the case under study is ALOHA based. Performance of the ALOHA system has been well documented (e.g., Kaynia and Jindal (2008); Médard and Goldsmith). Our system differs from the other in literature because of the large number of nodes (≈ 103)
and of the use of Frequency Hopping Spread Spectrum (FHSS) protocol to tackle interference (see section 4.3 for further details).
Even though there has been some simulation and field studies on AMI performance as well as a rich literature on mesh network performance, to the best of our knowledge this is the first time that a comprehensive analytical model is put in place to assess several performance parameters of a large-scale AMI system. Our analytical framework is particularly useful because it can be adapted to different types of scenarios and network features and it does not present the computational issues of very large scale systems simulation.
4.3 RF mesh communication system modelling
4.3.1 Main features
Many deployed AMI systems present proprietary features that are not easily disseminated to the public. So, in this paper, the case-study was a deployed system for which some data is publicly available. The communication system in object is a multi-hop wireless mesh network made of smart meters, routers and collectors with a current infrastructure of 1.5 million smart meters. The technology to connect the meters to data collectors is RF mesh and routers are used to extend coverage and increase connectivity. The communication channel is the unlicensed ISM band of 902 − 928 MHz. The system uses FHSS, which is a technique particularly efficient against low spectrum interference coming from other devices transmitting on the same free band. The access to the medium is regulated by a synchronous
ALOHA with time slots of duration τ = 0.7 s. Devices are kept synchronized through the Network Time Protocol (NTP). Collectors are the only devices equipped with GPS receivers, routers and smart meters are synchronized to their collector with NTP with an offset in the order of some milliseconds.
4.3.2 Topology definition
The topology definition in a large scale metering system is a challenging task. For this par-ticular case, we used public information to extract the general areas where smart meters were installed, that happened to present the position of routers and collectors. Next, we calculated the GPS coordinates by means of Google Maps and Bing Maps application programming in-terfaces. To locate the smart meters, we assumed one device per home and we developed a script in Bing Maps that inputs public data, such as postal codes or list of municipality streets, and outputs the latitude and longitude of the points. At the end of this process, as shown in Figure 4.1, we obtained the position of the nodes of the network. To define links, two different covering rays were assumed : 0.15 to 0.5 km for smart meters and of up to 2 km for routers and collectors. The variation of the maximum transmission range of smart meters is due to different propagation conditions in urban, rural and suburban areas. Moreover, routers and collectors achieve extended coverage with directive antennas and top-building installation. Routers and collectors have higher capacity links (19.2 kbps) with respect to smart meters (9.6 kbps), as shown in Figure 4.1.
4.3.3 Shortest paths
To start the analysis, a static shortest path routing based on distance as a metric was assumed but later on, other types of routing will be considered. The problem can be seen as a large multi-commodity flow since different streams of communication coexist in the system. There is one commodity from each smart meter to the collector and vice-versa.
4.3.4 Traffic characterization
Let G(V, E) characterize the graph representing the AMI system, where V and E are the sets of nodes and links of the RF network. The set of nodes V is composed by the union of the set of smart meters M , the set of routers R and the set of collectors C.
Let λup be the mean traffic from each smart meter to the collector and λdownthe mean traffic from the collector to a single smart meter. In both cases, Poisson arrivals are assumed so
Collector Router Smart Meter RF link (9.6 kbps)
NAN
RF link (19.2 kbps)Figure 4.1 Topology definition.
that the aggregation of traffic streams at each node is also Poisson with a mean value equal to the sum of all sub-streams mean values.
Let λi be the transmission rate of generic device i. In order to characterize λi,the routing behaviour of each device must be analyzed. Intermediate nodes are in charge of transmitting packets from the origin to the destination of the shortest paths they belong to. For this purpose, we introduce ξj, the number of shortest paths that contain node j as an intermediate node. Then, a given smart meter j transmits its own packets to the collector at a rate λup, packets from ξj smart meters to the collector at a rate ξjλup and finally packets from the collector to the ξj nodes at a rate ξjλdown. Routers do not generate traffic so a given device i is in charge of transmitting packets of ξj different streams in both uplink and downlink directions. On the other hand, collectors transmit to each of the |M | smart meters with a rate λdown.
These considerations can be summarized as follows :
λi =
ξi(λup+ λdown) + λup, if i is a smart meter ξi(λup+ λdown), if i is a router |M |λdown, if i is a collector
(4.1)
The actual transmission rate also depends on the number of packet retransmissions that are caused by collisions. In particular, if Ni represents the average number of retransmissions