UNIVERSITE DU QUEBEC A CHICOUTIMI
MEMOIRE PRESENTE A
L'UNIVERSITÉ DU QUÉBEC À CHICOUTIMI
COMME EXIGENCE PARTIELLE
DE LA MAÎTRISE EN INGÉNIERIE
PAR
Ying Huang
PROTECTION OF METAL AND ALLOY SURFACES USING
CORROSION RESISTANCE NANOSTRUCTURED
SUPERHYDROPHOBIC COATINGS
PROTECTION DES SURFACES METALLIQUES ET
D'ALLIAGES EN UTILISANT UNE RÉSISTANCE À LA
CORROSION DE REVÊTEMENTS NANOSTRUCTURÉS
SUPERHYDROPHOBES
RESUME
Les surfaces superhydrophobes, lesquelles démontrent une forte déperlance de l'eau, sont
récemment devenues un domaine très populaire en raison de leur importance scientifique et
technologique ainsi que leur large gamme d'applications dans divers domaines. La préparation des
surfaces nanostructurées superhydrophobe nécessite à la fois une rugosité optimale et une faible
énergie de surface et, par conséquent, les surfaces superhydrophobe sont classiquement préparées
employant deux étapes: une surface rugueuse et abaissant son énergie de surface.
Dans notre travail actuel, le processus de fabrication de surfaces de cuivre superhydrophobe est
simplifié en une simple étape. L'application d'une tension continue entre deux plaques de cuivre
immergé dans une solution diluée d'acide stéarique éthanolique transforme la surface de l'électrode
de cuivre anodique en superhydrophobe due à la formation de micronano fibres de stéarate de cuivre
à faible énergie de surface, tel que confirmé par rayons X diffraction (XRD) et microscopie
électronique à balayage (MEB). L'augmentation du potentiel de modification, ainsi que la temps de
modification conduit à l'augmentation de la valeur de la faible énergie de surface des
micronanostructures ainsi que l'augmentation de la superhydrophobicité des surfaces telle que
II
Les surfaces nanostructurées superhydrophobes en alliage d'aluminium ont également été
préparées par une procédure semblable comme il a été effectué sur les surfaces en cuivre.
Cependant, les surfaces en alliage d'aluminium modifiées à l'acide stéarique n'ont pas montré les
propriétés superhydrophobes. Par conséquent, les surfaces en aluminium sont d'abord revêtues de
films en cuivre suivi par la modification électrochimique avec une solution d'acide stéarique. Le
cuivre se développe que sur les surfaces des micropointes d'Al d'alliage AA6061. Les densités de
surface des micropoints sont augmentées avec l'accroissement des potentiels négatifs. D'autre part,
leurs tailles ainsi que les distances entre les micropointes sont réduites avec l'augmentation des
potentiels négatifs du dépôt.
L'angle de contact des surfaces, les rugosités du film de cuivre électrodéposé suivi par la
modification électrochimique augmentent à l'augmentation des potentiels négatifs de dépôt de
cuivre. Les films de cuivre modifiés à l'acide stéarique déposés à -0.6 V fournissent une rugosité de
surface de 6.2 fim avec un angle de contact de l'eau de 157 ° offrant des propriétés
superhydrophobes des surfaces en alliage d'aluminium AA6061.
La prévention de la corrosion des surfaces superhydrophobes des alliages de cuivre et
d'aluminium a été ensuite analysée par tests en laboratoire de corrosion ainsi que par les courbes de
polarisation des surfaces avec différentes propriétés superhydrophobes. La diminution de la densité
de courant de corrosion ainsi que l'augmentation de la résistance de polarisation montre que la
surface du cuivre superhydrophobe est plus stable par rapport à la surface de cuivre dans
l'environnement corrosif. Les deux Cu superhydrophobes et les surfaces en alliage Al AA6061
montrent propriétés anticorrosion. Toutefois, les surfaces en cuivre superhydrophobe sont plus
Ill
IV
ABSTRACT
Superhydrophobic surfaces, which demonstrate high water-repellency, have recently become a very popular field because of its scientific and technological importance and wide range of applications in diverse areas. Preparation of nanostructured superhydrophobic surfaces requires both an optimum roughness and low surface energy; therefore, superhydrophobic surfaces are conventionally prepared employing two steps: roughening a surface and lowering its surface energy.
In our present work, the fabrication process of superhydrophobic copper surfaces is simplified as just one-step. The application of a direct voltage between two copper plates immersed in a dilute ethanolic stearic acid solution transforms the surface of the anodic copper electrode to superhydrophobic due to the formation of micro-nanofibors low surface energy follower-like copper stéarate as confirmed by X-ray diffraction (XRD) and scanning electron microscope (SEM), respectively. The increase of the modification potential as well as the modification time leads to the increase of the amount of the low surface energy micro-nanostructures as well as the increase of the superhydrophobicity of the surfaces as measured by water contact angle.
The nanostructured superhydrophobic aluminum alloy surfaces have also been prepared by the similar procedure as it was performed on copper surfaces. However, stearic acid modified aluminum alloy surfaces didn't show the superhydrophobic properties. Therefore, the aluminum surfaces were firstly coated with copper films followed by electrochemical modification with stearic acid solution. The copper grows as microdots on AA6061 Al alloy surfaces. The surface densities of the microdots increase with the increase of the negative deposition potentials. On the other hand
their sizes as well as the distances between the microdots reduce with the increase of the negative deposition potentials. The surface roughness and water contact angle of electrodeposited copper film followed by electrochemical modification in ethanolic stearic acid solution increase with the increase in negative copper deposition potentials. The stearic acid modified copper films deposited at -0.6 V provides a surface roughness of 6.2 /un with a water contact angle of 157 ° providing superhydrophobic properties of AA6061 aluminum alloy surfaces.
The corrosion prevention of the superhydrophobic copper and aluminum alloy surfaces were then analyzed by home-made corrosion tests as well as the polarization curves of surfaces with different superhydrophobic properties. The decrease of the corrosion current density as well as the increase of the polarization resistance shows that the superhydrophobic copper surface is more stable as compared to copper surface in the corrosion environment. Both superhydrophobic Cu and AA6061A1 alloy surfaces show anti-corrosion properties. However, superhydrophobic copper surfaces are more stable than superhydrophobic AA6061 Al alloy surfaces as prepared in our studies.
VII
ACKNOWLEDGMENTS
This work was carried out with financial support of Natural Sciences and Engineering Research Council of Canada - NSERC, Rio Tinto Alcan. I would like to thank these organizations for their financial support of my thesis work.
To start with, I would like to express my sincere and special thanks to my director, Prof. Dilip Sarkar, for his patience, guidance, encouragement and support of my research work. He always has plenty of good ideas to solve problems and I have always gained a lot of knowledge whenever I talked with him. I am so proud and privileged to work with him and learn from his expertise throughout my Masters studies.
I am extremely grateful to my co-director Prof. X.-Grant Chen, for his continuous support during my research work Thanks to his valuable instructions technical discussions and suggestions throughout this project.
Both technical and scientific discussions with Prof. Sarkar and Prof. Grant Chen made me extremely successful in demonstrating my presentation skills in conferences where the fruit of labor of my directors came out in prizes for best poster and best oral presentation winner in national conferences such as REGAL's students day.
I am also grateful to Dr. Danick Gallant as well as Yumei Han, who have offered me their time and help for the corrosion tests. I sincerely appreciate their generosity in sharing their knowledge and expertise to make me feel comfortable with this part of my thesis work.
VIII
I would like to express my sincere appreciation to Prof. Duygu Kocaefe for being present and
providing her valuable comments and during my evaluation seminars as well as for providing
access to measure the water contact angle in her laboratories which has an enormous contribution to
my thesis completion. My sincere thanks to Xianai Huang and Sudeshna Saha, who helped me learn
to use the contact angle goniometer at the early stages of my research.
I would also like to thank all my colleagues, professors and technicians in Cural for their
continuous support and help throughout my Masters study. Those include Dr. Zhan Zhang, Martin
Bouchard, Émélie Brideau, Pascal Vandal, Dany Racine, Emad Elgallad, Ehab Elsharkawy, Jing
Lai, Mehand Tebib, Junfeng Guo, Kun Liu, Gaofeng Li, Pierre-Alexandre Minier, Peng Shen, Jian
Qin, Mohammad Shakiba and Lei Pan.
I would like to specially thank Dr. Zhan Zhang, Dr. Danick Gallant, Prof. Dilip. Sarkar and
Prof. X.-Grant Chen for taking their precious time off to be present in my examination committee in
spite of their busy schedules.
I would also like to thank Dr. A. M. Samuel, who with lot of patience took her time to explain
me things in the course works I took with her. In addition to being my class room Prof., she also
continuously encouraged me in terms of developing English language skills as well as in the subject
throughout my course.
I would like to specially appreciate Dr. N. Saleema who gave me plenty of support throughout
my Masters research. She did so much work on the modification of my seminar reports and
IX
presentations and showed me her experience in the experiment, which helped me feel more comfortable with the new research field that I was into for this Master study.
Also I sincerely appreciate Jean-Denis Brassard for his help in the French learning, during my research period and for correcting the French abstract of my thesis.
I would like to express my warmest and deepest appreciation to my dear parents, my father and my mother for their never-ending support, understanding and patience in all the situations. Whenever I came across any kind of difficulties, they always say "you can do it" to encourage me.
Cangji Shi, my forever love, is a very important contributor to the successful completion of my thesis. Thanks for his suggestion during the research, his encouragement, his affection, and his love. Thanks for everything he did for me.
X
TABLE OF CONTENTS
RÉSUMÉ I ABSTRACT IV ACKNOWLEDGMENTS VII TABLE OF CONTENTS X LIST OF FIGURES XV LIST OF TABLES XXII LIST OF EQUATIONS XXIII CHAPTER 1 INTRODUCTION 1 1.1 INTRODUCTION OF SUPERHYDROPHOBICITY 1 1.2 HYPOTHESIS 3 1.3 MAIN OBJECTIVES 3 1.4 METHODOLOGY 4 CHAPTER 2 LITERATURE REVIEW 62 . 1 WETTABILITY AND SUPERHYDROPHOBICITY 6
2.1.1 Superhydrophobicity phenomena in nature 6
2.1.2 The surface energy 8
2.1.3 Water contact angle and contact angle hysteresis 9
2.1.4 Effect of roughness on the wettability of the surfaces 11
2.1.5 Applications of superhydrophobicity 13
XI 2.2 PREPARATION TECHNIQUES OF suPERHYDROPHOBic SURFACES 18
2.2.1 Electrodeposition technique to achieve superhydrophobicity 19
2.2.2 Chemical etching technique to prepare superhydrophobic surfaces 30
2.2.3 Other techniques to achieve superhydrophobicity 35
2.3 CORROSION PROPERTIES OF SUPERHYDROPHOBIC SURFACES 39
2.3.1 The stability of the superhydrophobic surfaces 40
2.3.2 Electrochemical technique- Potentiodynamicpolarization 44
CHAPTER 3
EXPERIMENTS 47
3.1 MATERIAL SYNTHESIS 47
3.1.1 Surface cleaning 47
3.1.2 Fabrication of superhydrophobic copper surfaces 47
3.1.3 Fabrication of superhydrophobic aluminum alloy surface 48
3.2 SURFACE ANALYSIS 49
3.2.1 Surface microstructures 49
3.2.2 Chemical composition analysis 51
3.2.3 Wettability measurements 52
3.2.4 Corrosion test on the superhydrophob ic copper and aluminum alloy surfaces 53
CHAPTER 4
PREPARATIONS OF NANOSTRUCTURED SUPERHYDROPHOBIC COPPER SURFACES 56
4.1 INTRODUCTION 56
XII
4.2.1 The microstructures of the modified surfaces: Effect of the modification time 56
4.2.2 Mechanism of the formation offlower-like copper stéarate micro-nano particles. 59
4.2.3 The chemical composition of the modification films: Effect of the modification time . . 6 1
4.2.4 The superhydrophobicity of the modified surfaces: Effect of the modification time 62
4.3 EFFECT OF DC POTENTIAL ON THE SUPERHYDROPHOBIC PROPERTIES OF COPPER SURFACES 64
4.3.1 The microstructures of the modified surfaces: Effect of the modification potential 64
4.3.2 The chemical composition of the modified films: Effect of the modification potential. 66
4.3.3 The superhydrophobicity of the modified surfaces: Effect of the modification potential 67
4.3.4 The roughness of the modified surfaces: Effect of the modification potential. 68
4.4 EFFECT OF THE STEARIC ACID CONCENTRATION ON THE SUPERHYDROPHOBIC PROPERTIES OF COPPER SURFACES 7 0
4.4.1 The microstructures of the modified surfaces: Effect of the stearic acid concentration 70
4.4.2 The chemical composition of the modified surfaces: Effect of the stearic acid concentration 73
4.4.3 The superhydrophobicity of the modified surfaces: Effect of the stearic acid concentration 74
CHAPTER 5
PREPARATIONS OF NANOSTRUCTURED SUPERHYDROPHOBIC ALUMINUM ALLOY SURFACES 76
5.1 INTRODUCTION 76
5.2 FABRICATION OF SUPERHYDROPHOBIC ALUMINUM ALLOY SURFACES BY ONE-STEP ELECTROCHEMICAL DEPOSITION 7 6
5.3 FABRICATION OF SUPERHYDROPHOBIC ALUMINUM ALLOY SURFACES BY CHEMICAL ETCHING FOLLOWED BY PASSIVATION 7 7
XIII
5.3.2 Thewettabilityofthe modified surfaces 79
5.4 FABRICATION OF SUPERHYDROPHOBIC ALUMINUM ALLOY SURFACES WITH COPPER DEPOSITION ON ALUMINUM ALLOY FOLLOWED BY ELECTROCHEMICAL MODIFICATION WITH STEARIC ACID MOLECULES . 8 2
5.4.1 Effect of the deposition potential of copper on aluminum alloy surfaces on the properties of superhydrophobic aluminum alloy surfaces 82
5.4.2 Effect of the deposition time of copper on aluminum alloy surfaces on the superhydrophobic properties of aluminum alloy surfaces 89
5.4.3 Effect of the concentration of deposition solution on the properties of superhydrophobic aluminum alloy surfaces 93
CHAPTER 6
CORROSION TESTS ON SUPERHYDROPHOBIC COPPER AND ALUMINUM ALLOY SURFACES 96
6.1 INTRODUCTION 96
6.2 CORROSION TEST ON SUPERHYDROPHOBIC COPPER SURFACES 96
6.2.1 Effect of the immersion time in NaCl solution on the wettability of superhydrophobic copper surfaces 96
6.2.2 Effect of the potential of copper surface modification on the corrosion prevention properties 101
6.3 CORROSION TEST ON SUPERHYDROPHOBIC ALUMINUM ALLOY SURFACES 103
CHAPTER 7
CONCLUSIONS AND FUTURE RECOMMENDATIONS 109
7.1 CONCLUSIONS 109
7.1.1 Preparation of superhydrophobic copper surfaces 109
7.1.2 Preparation of superhydrophobic aluminum alloy surfaces 109
7.1.3 The corrosion protection property of the superhydrophobic copper and aluminum alloy surfaces I l l
XIV PUBLICATIONS 114 REFERENCES 116
XV
LIST OF FIGURES
Figure 2.1 (a) Water drop on a lotus leaf; (b) Microstructure of a lotus leaf; (c) A colorful picture
of a butterfly and (d) the microstructure of a butterfly wing; (e) Water strider on
water surface and (f) the microstructure of a water strider leg showing the special
hierarchical arrangement of large numbers of oriented tiny hairs (microsetae) with
fine nanogrooves coated with waxy materials 7
Figure 2.2 A water drop in equilibrium state on a surface, as presented by Young 10
Figure 2.3 The schematic of contact angle hysteresis 11
Figure 2.4 Surface topography effects on water contact angle by (a) Wenzel Model; (b)
Cassie-Baxter Model 12
Figure 2.5 Image of fallen wood poles due to ice deposited on metal cables 14
Figure 2.6 Water droplets rolling off substrates with a normal hydrophobic surface (left) and a
self-cleaning superhydrophobic surface (right) through dust particles 15
Figure 2.7 The photo of devices under bio fouling in ocean 16
Figure 2.8 The boat where the metal has been corroded badly 17
Figure 2.9 The applications of superhydrophobicity- drag reduction 18
Figure 2.10 Variation of water contact angle and hysteresis with coating time 20
Figure 2.11 SEM images of samples prepared using three different initial Ag
+concentrations of
(a), 13.2 mM, (b) 24.75 mM and (c) 396 mM, respectively; and (d) a magnified
section of (b); In the insets, the states of the droplets are shown 21
Figure 2.12 SEM images with different magnifications of as-deposited silver crystallites prepared
in the 0.01 M AgNC>3 aqueous solution for reaction time of (a) 5 s; (b) 10 s; (c) 20 s;
(d) 5min; (e) 25 min; (f) magnified image corresponding to the area indicated by the
rectangle in panel (d) 23
Figure 2.13 XRD patterns of (a) copper substrate, (b) the silver film deposited on galvanic
exchange reaction on copper substrate in the silver nitrate solution, and (c) the silver
film deposited on galvanic exchange reaction on copper substrate in the silver nitrate
solution with benzoic acid molecules 25
XVI Figure 2.14 EDS spectra of silver films prepared in (a) silver nitrate solution and (b) silver nitrate
solution with benzoic acid molecules. Inset shows the FTIR spectra of silver powder collected from the silver films prepared with the benzoic acid molecules 26 Figure 2.15(a) Change in the applied potential (V) as a function of time (s) in the galvanostatic
mode for copper deposition on a 100-nmthick polypyrrole film. The cross at -0.56 V (versus AgCl/Ag standard potential) marks the peak potential for copper deposition obtained from a cyclic voltammetric scan for polycrystalline copper substrate. Potentials that are higher (e.g., open square at -0.4 V) and lower (e.g., open circle at -0.9 V) than -0.56 V are referred to as under-peak potential and over-peak potential, respectively. Panel b shows the corresponding SEM micrograph for copper deposition obtained galvanostatically as shown in panel a, depicting a variety of structures including nanowires, microrods, fractals, and cubic nanocrystals. Panels c and d show SEM micrographs for copper deposition obtained in potentiostatic mode at (c) under-peak potential (-0.4 V) and (d) overpeak potential (-0.9 V), depicting the changes in the predominant nanostructures from fractals to near-perfect cubic nanocrystals 28 Figure 2.16(a) Relationship between water contact angle on the modified copper films and the
second deposition time, C3 and Cg show different number of chain length; (b) Water contact angle on the modified copper films as a function of chain length of n-alkanoic acids 30 Figure 2.17(a) The variation of thickness of aluminum substrates with etching time; (b) Contact
angle of water on ultrathin rf-sputtered Teflon coated aluminum substrates with etching time, inset shows the shape of water drop on lmin and 2.5 min etch surfaces. 31 Figure 2.18 Influence of etching time on the contact angle of the copper wafer surface 31 Figure 2.19 SEM images of aluminum surfaces (a) as-received (inset shows the water drop image
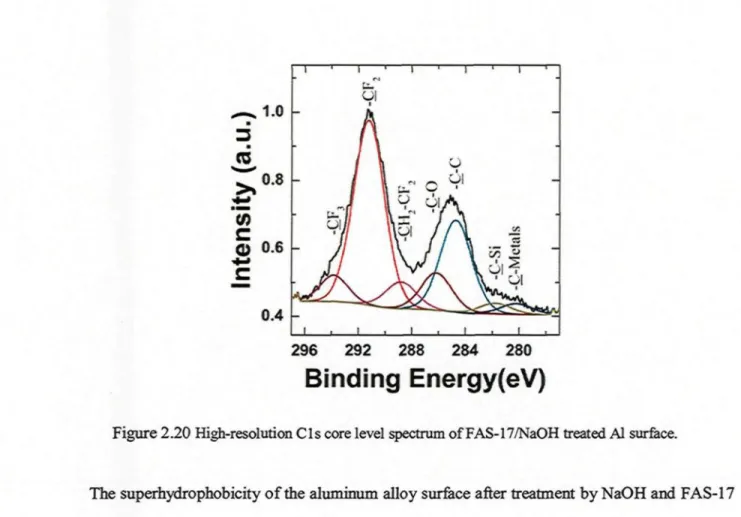
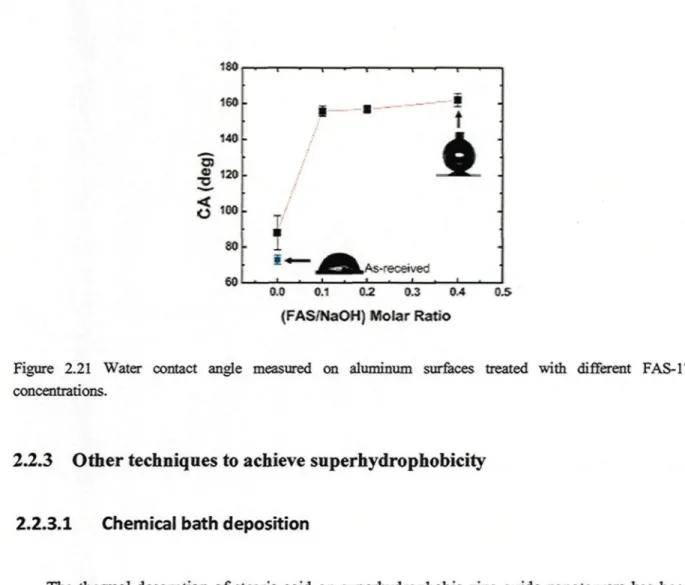
on a) and (b) treated with NaOH and FAS-17 (inset shows a magnified SEM image of b as well as a water drop image onb) 33 Figure 2.20 High-resolution C l s core level spectrum of FAS-17/NaOH treated Al surface 34 Figure 2.21 Water contact angle measured on aluminum surfaces treated with different FAS-17
concentrations 35 Figure 2.22 FESEM images of ZnO nanotowers at (a) low magnification (b) ZnO nanotowers at
high magnification showing the hexagonal morphology; (c) close up view of a single nanotower showing the nanosteps; (d) image of a water drop on the surface of these nanotowers after SA passivation 36
XVII Figure 2.23 FTIR spectra showing -CHn peaks of stearic acid following annealing at various
temperatures 37 Figure 2.24 The variation of the contact angle of superhydrophobic film coated specimen (SS) as
a function of immersion time in NaCl solution 41 Figure 2.25 SEM images of zinc substrates before (a) and after coating with the perfluorosilane
polymer (b). The insets correspond to water contact angles (droplet volume 6 ^L) and zoom-in modified zinc, (c) SEM images of unmodified zinc and (d) zinc coated with a superhydrophobic film (B) after immersion in a 3 % NaCl aqueous solution for 1 and 29 days, respectively. 42 Figure 2.26 Model of the interface between super-hydrophobic surface and sterile seawater 44 Figure 2.27 Potentiodynamic polarization curves of untreated, anodized and superhydrophobic
samples for 24 h in sterile seawater at 2 mVs'1 45
Figure 2.28 (a) Shape of water droplet on the as-prepared surface composed of CeC*2 nanosheets; (b) Water droplet behavior on the CeCh nanosheet surface after FAS coating; (c) Digital photograph image of the shape of water droplets on the superhydrophobic surface 46 Figure 2.29 Potentiodynamic curves of (a) a bare magnesium alloy and (b) a superhydrophobic
surface on a magnesium alloy 46
Figure 3.1 The electrochemical modification device (CURAL, Chicoutimi) for fabricating superhydrophobic copper surfaces 48 Figure 3.2 The scanning electron microscope (SEM/EDS, JEOL JSM 6480 LV, CURAL,
Chicoutimi) 50 Figure 3.3 An optical profilometer (MicroXAM-100 HR 3D surface profilometer, CURAL,
Chicoutimi) 50 Figure 3.4 Optical microscope and image analysis system (Clemex, CURAL, Chicoutimi) 51 Figure 3.5 X-ray diffractometer (XRD) in CURAL, Chicoutimi 52 Figure 3.6 A contact angle goniometer (First Ten Angstrom contact angle goniometer, GRTB,
XVIII
Figure 3.7 Homemade device (CURAL, Chicoutimi) of the corrosion behavior analysis by
immersing the treated samples in the NaCl solution for a range of time 54
Figure 3.8 The electrochemical device for obtaining potentiodynamic polarization curves
(Aluminum Technology Centre (NRC-ATC), Chicoutimi) 55
Figure 4.1 SEM image of the anodic surface of the copper electrode after the application of DC
voltage in ethanolic stearic acid solution. Inset shows the drop of water on the sample
surfaces, (a) 0.5 h; (b) 1 h; (c)1.5 h; (d) 2 h; (e) 3 h; (f) Morphology of the particles
with 3 h. Insets of 4.1(a-e) shows images of a water drop placed on the respective
surfaces 58
Figure 4.2 The different number and size of the formation of flower-like particles 60
Figure 4.3 XRD patterns of copper sample with the application of DC voltage for (a) 3 h; (b) 2 h;
(c) 1.5 h; (d) 1 h; (e)0.5 h; (f) pure copper substrate 61
Figure 4.4(a) Water contact angle and (b) contact angle hysteresis of anodic copper electrode
with the application of 5 V and 30 V DC voltage respectively in an ethanolic stearic
acid solution. The insets show the water drops on the copper surfaces coated in 5 V
and 30 V for 3 h 64
Figure 4.5 SEM images of anodic copper surface coated for 2 h in the application of different
voltage, (a) 5 V. (b) 20 V. (c) 25 V. (d) 30 V. Inset of (d) shows the magnified image
of one of the flower-like particles. The insets also show the water drop images on the
copper surfaces coated with copper stéarate at the respective voltages 65
Figure 4.6 XRD patterns of the anodic surface of the copper electrode after the application of
different voltage application when copper substrate immersed in stearic acid solution
for the same time (2 h, 5-30V) 66
Figure 4.7 The variation of water contact angle of anodic copper electrode as a function of the
application of voltage for 0.5 h, 1.5 h, 2 h and 3 h reaction time, respectively 68
Figure 4.8 The variation of roughness vs. deposition potential, (b) variation of water contact
angle vs. surface roughness on the stearic acid modified copper film deposited on
aluminum surfaces. The inset of (a) shows the 3D images of the rough surfaces and (b)
shows the images of water drops (-0.2 V & -0.8 V) 69
Figure 4.9 SEM images of the anodic surface of the copper electrode after the application of 20 V
XIX M; (b) 0.02 M; (c) 0.05 M; (d) 0.1 M. The insets show the water drops on the coated surface prepared by stearic acid solution of respective concentration 71 Figure 4.10(a) SEM image and (c), (d) EDS spectrum acquired from different morphologies on
copper coating film made by immersing copper substrate in stearic acid solution for 0.5 h in application of 20 V DC voltage; the EDS spectrum of (c) and (d) chose the field shown in (a); (b) shows the molecule of copper stéarate 72 Figure 4.11 XRD patterns of the anodic surface of the copper electrode after the application of 20
V DC voltage in ethanolic stearic acid solutions of different concentration from 0.01 M to 0.1 M 74 Figure 4.12 Water contact angle of different concentration stearic acid used to modify copper
substrates in 20 V for 0.5 h 75
Figure 5.1 Water contact angle of anodic aluminum alloy electrode at 30 V DC voltage for 0.5 h, lh, 1.5 h, 2 h and 3 h, respectively. 77 Figure 5.2(a, c and e) The SEM images in different magnifications of aluminum alloy surface
etched for 4 minutes followed by passivation with stearic acid for 30 minutes, (b, d and f) show the SEM images in different magnifications of aluminum alloy surface etched for 20 minutes followed by passivation with stearic acid for 30 minutes 79 Figure 5.3 The variation of water contact angle as a function of the etching time of the aluminum
alloy surface in NaOH solution followed by passivation with stearic acid solution for 30 minutes 80 Figure 5.4 Variation of the thickness of aluminum alloy substrates with the etching time 81 Figure 5.5 SEM images of copper films coated aluminum alloy substrates for 10 min at (a) -0.2 V,
(c) -0.4 V, (e) -0.6 V and (g) -0.8 V and their surfaces after modified with stearic acid for 30 minutes at 30 V, namely, (b) -0.2 V, (d) -0.4 V, (f) -0.6 V and (h) -0.8 V, respectively. The insets of (b, d, f and h) show the water drop images on the respective surfaces 85 Figure 5.6 The number density of the copper microdots as a function of deposition potential and
(b) The distance between the copper microdots as a function of deposition potential... 86 Figure 5.7(a) High angle XRD patterns of copper films deposited on aluminum alloy substrates
for the duration of 10 min in the application of various voltages (as shown in the figure) followed by electrochemical modification in ethanolic stearic acid solution
XX
and (b) low angle XRD patterns of (a). CuSA is the XRD pattern of copper stéarate
films 88
Figure 5.8(a) The variation of roughness vs. deposition potential, (b) variation of water contact
angle vs. surface roughness on the stearic acid modified copper film deposited on
aluminum alloy surfaces. The inset of (a) shows the 3D images of the rough surfaces
and (b) shows the images of water drops (-0.2 V & -0.8 V) 89
Figure 5.9 SEM images of copper deposited on aluminum alloy for different deposition time in
the application of 0.8 V DC voltage (a) 2 min, (c) 5 min, (e) 10 min, (g) 30 min, (i)
90 min and their surfaces after modified with stearic acid for 30 minutes at 30 V,
namely, (b) 2 min, (d) 5 min, (f) 10 min, (h) 30 min and (j) 90 min, respectively. The
insets of fig. 5.9(b& d& f& h& j) show the water drop images on the respective
surfaces 92
Figure 5.10 Variation of water contact angle on the stearic acid modified copper film deposited
on aluminum alloy surfaces for various deposition time at -0.8 V followed by
electrochemical modification by stearic acid at 30 V for 30 minutes. The insets show
the water drop on the modified surfaces 93
Figure 5.11 SEM images of the copper deposited on aluminum alloy surfaces by immersing in
CUSO4 solution of different concentrations followed by electrochemical modification
with stearic acid molecules at 30 V for 30 minutes, (a) 0.01 M; (b) 0.05 M; (c) 0.1 M;
(d)0.5M 94
Figure 5.12 The variation of water contact angle as a function of the concentration of CUSO4
solution of the copper deposited aluminum alloy surfaces at -0.8 V for 10 minutes
followed by electrochemical modification with stearic acid for 30 V at 30 minutes 95
Figure 6.1 Water contact angle of copper stéarate modified copper surface after immersing in the
3.5 wt. % NaCl corrosive solution in different times 98
Figure 6.2(a) SEM micrographs of superhydrophobic copper surface which is fabricated by
immersing copper substrate in stearic acid for 3h at 30 V DC voltage and (b) the
magnified flower-like particle; (c) SEM micrographs of modified superhydrophobic
copper surface after corrosion in NaCl solution for 120 h and (d) the magnified
particle 99
Figure 6.3(a) EDS observation of superhydrophobic copper surface as shown in point 1 and (b)
XXI
Figure 6.4 Potentiodynamic curves of (1) copper surface, (2) hydrophobic copper surface
(formation of copper stéarate on copper surface in the application of 5 V) and (3)
superhydrophobic copper surface (formation of copper stéarate on copper surface in
the application of 30 V). The insets show the water drops on each surface 103
Figure 6.5 Water contact angle of copper plated superhydrophobic aluminum alloy surface after
corrosion for a range of time 105
Figure 6.6 SEM images of (a) copper deposited on aluminum alloy for 10 min at -0.8 V followed
by electrochemical modification with stearic acid for 30 min at 30 V shown in (b); (c)
shows the surface (b) were immersed in NaCl for 120 h and its magnified image (d). 107
Figure 6.7 EDS observation of superhydrophobic aluminum alloy surface after immersion for
120 h with (a) the particle existed before corrosion and (b) the new particle after
corrosion 107
XXII
LIST OF TABLES
Table 4.1 The variation of water contact angle (°) as a function of the applied DC voltage as well as the time of modification 68 Table 4.2 The chemical composition of EDS result obtained from fig. 4.10 73
Table 5.1 The number density and inter-particle distance for copper film deposited on aluminum alloy substrates at different potentials 84
Table 6.1 The chemical composition of EDS result obtained from figure 6.2 100 Table 6.2 The corrosion current and polarization resistance obtained from fig. 6.4 and the water contact angle for each surface 103 Table 6.3 The chemical composition of point (1) (superhydrophobic aluminum alloy surface) and point (2) (superhydrophobic aluminum alloy surface after immersion for 120 h) as determine from the EDS spectra of Figure 6.7 108
XXIII
LIST OF EQUATIONS
y sv y si.
CAH = e
adv- e
reccosO'= R,., cos 6
cos 0'
=
f
xcos 9
X+
f
2cos 0
2cos 0' = / , (cos 0, + l ) - l
2Ag++Cu— 2Ag+Cu2+
2/cos0
pgR
(Equation 2.1) 10
(Equation 2.2) 11
(Equation 2.3) 11
(Equation 2.4) 13
(Equation 2.5) 13
(Equation 2.6) 19
(Equation 2.7) 43
N=exp (-3.45V+9.99)
(Equation 5.1) 83
Cu
++e"
Cr-^ CuCl
Cuci
2'
4OH"
1
3+A1
3++3OH"-^A1(OH)
3(Equation 6.1) 99
(Equation 6.2) 99
(Equation 6.3) 99
(Equation 6.4) 99
(Equation 6.5) 108
(Equation 6.6) 108
CHAPTER 1
INTRODUCTION
This chapter provides an introduction to the superhydrophobicity on the metal surfaces. The hypothesis and objectives of the research project and the methodologies employed to achieve the objectives will be outlined in the following sections.
1.1 Introduction of Superhydrophobicity
The morphology and chemical composition of the solid surfaces play an important role on the corrosion resistance, and the right combination of surface properties can dramatically lower the ability of water drops to stick [1] and hence the possible enhancement of corrosion resistance. In the review on "Non-sticking drops", by David Quéré [1] details the requirements for a water drop to slide on an inclined surface on the basis of the water contact angle (CA, see section 2.1.3) and the contact angle hysteresis (CAH). The CAH is defined as the difference between the advancing and receding CAs of water obtained on a surface during the motion of a water drop in one direction [1]. Quéré states that a water drop can slide off a surface if CA is greater than 160 ° even when the CAH is higher, due to the lower contact area between the liquid and the solid. He concluded that "non-sticking" drops must therefore be observed on surfaces with CA > 160 ° and such surfaces are termed "superhydrophobic". Superhydrophobicity is observed on certain natural tissues such as lotus leaves. The so-called "Lotus effect" is due to the presence of a rough micro-nanostructure covered with waxy materials which are poorly wetting, resulting in a water contact angle greater than 150 ° [2]. The rough micro-nanostructure allows the entrapment of air beneath the water drop in the pores (troughs) of the rough structure and the waxy coating, which has a low surface energy,
helps to reduce the interaction of the surface with water.
Studies have been carried out in an attempt to understand the role of superhydrophobicity on corrosion prevention [3,4]. Learning from nature, a superhydrophobic surface can be obtained by creating an optimum surface roughness followed by passivation with a low surface energy coating leading to a very low area of contact between the solid surface and the liquid, causing a water drop to roll off the surface. As the contact area of water on a superhydrophobic solid surface is negligible, such surfaces would effectively reduce the contact area of water. Therefore, the superhydrophobic film can resist corrosion and protect the metals.
It is well known that, copper and its alloys have been one of the important materials in industry owing to its high electrical and thermal conductivities, mechanical workability and its relatively noble properties. It is widely used in many applications in electronic industries and communications as a conductor in electrical power lines, pipelines for domestic and industrial water utilities including seawater, heat conductors and heat exchangers [5]. Thus, corrosion of copper and its inhibition in a wide variety of media, particularly when they contain chloride ions, have attracted attention of a number of investigators [6,7,8]. In addition to copper, aluminum and its alloy are also widely used in Aerospace, marine applications, automotive applications and so on for their low density, favorable mechanical properties and relatively good corrosion resistance. Aluminum and its alloy have a natural corrosion protection from its oxide layer, but if exposed to aggressive environments it may corrode [9].
alloy surfaces and studied their morphological, chemical as well as their corrosion prevention properties.
The detailed background study with an expanded literature review will be provided in Chapter 2.
1.2 Hypothesis
Based on the background and literature (see chapter 2), it is well known that superhydrophobic surfaces are traditionally prepared via a two-step process: (i) creation of surface roughness (ii) passivation of the rough surfaces. However, if the creation of surface roughness and surface passivation can be accomplished simultaneously in one-step, it could simplify the complexity of using two different procedures as used in the conventional two-step method in making surfaces superhydrophobic. In this research project, one-step process was used to prepare superhydrophobic copper surfaces and two-step processes comprising electrochemical deposition and electrochemical modification were used to prepare superhydrophobic aluminum surfaces.
Corrosion behavior on surfaces caused mainly by their contact with wet environments can be effectively reduced or even eliminated completely by making the surfaces superhydrophobic where water wouldn't stick, thereby repelling wet corrosive substances.
1.3 Main objectives
Based on the background, the superhydrophobic copper and aluminum surfaces will be fabricated and the feasibility of the corrosion prevention of the superhydrophobic surfaces will also
be explored. The main objectives of this research project are as follows:
Preparation of superhydrophobic copper surfaces by one-step process via a chemical route under the influence of electric field;
Electroplating of copper on aluminum surfaces and their electrochemical modification to obtain superhydrophobic aluminum surfaces.
To characterize these surfaces by surface morphological and compositional studies as well as to study their wetting characteristics;
To study the dynamics of corrosion behavior on the superhydrophobic surfaces as compared with their hydrophilic counterparts.
1.4 Methodology
The major procedures of this research work consist of the following steps:
Fabrication of nanostructured superhydrophobic copper surfaces: A one-step process of electrochemical deposition technique is applied to fabricate superhydrophobic surface on copper substrates, a method where Cu substrates are immersed in stearic acid solution for a certain period of time in the application of DC voltage.
Fabrication of nanostructured superhydrophobic aluminum surfaces: The similar methodology to fabricate superhydrophobic copper surface is applied on aluminum substrates to obtain superhydrophobic aluminum substrates.
Fabrication of nanostructured superhydrophobic copper-plated aluminum surfaces: Copper deposited on aluminum substrates under certain potential as the first step followed by electrochemically modification copper-plated aluminum surface with stearic acid as the second step.
The prepared superhydrophobic surfaces will be exposed to corrosive environments (3.5 wt. % NaCl solution) in a simulated off-shore and atmospheric conditions to which many industrial and aeronautical structures are exposed. In the test, different parameters such as the superhydrophobicity of the surfaces, solution concentration, exposure time, etc., will be controlled. The potentiodynamic polarization curve is also used to investigate how different superhydrophobicity of surfaces affect the corrosion protection by means of polarization curves and polarization resistance. A visual analysis with supporting digital images of the various surfaces following exposures at varying time-frame will be performed to monitor the corrosion behavior. In addition, morphological and chemical compositional studies will also be carried out using SEM/EDS. The wettability of the surface before and after corrosion will be compared by using water contact angle measurement.
CHAPTER 2
LITERATURE REVIEW
As part of the tasks of this Master's research project, a detailed literature review up to date has
been performed on, preparation superhydrophobic coatings and their applications among which, a
literature review on corrosion performance of certain materials has also been performed after the
main review on the superhydrophobicity. The corrosion studies on superhydrophobic surfaces are
only a kind of feasibility exploration as one of the applications of superhydrophobicity.
2.1 Wettability and Superhydrophobicity
2.1.1 Superhydrophobicity phenomena in nature
Superhydrophobicity is a technologically important property which describes the non-wetting
characteristics of solid surfaces when the solid surfaces come in contact with water. The
superhydrophobic properties or non-wetting properties are commonly observed on surfaces of many
natural plants and insects [1,10]. Figure 2.1 shows their photos and microstructure. One of the
commonly cited examples is the lotus leaf shown in figure 2.1 (a). The so-called "Lotus effect", is
due to the presence of a binary structure with numerous papillae, with diameters in the range
between 3 to 10 /an, providing a rough micro-nanostructure (figure 2.1(b)), which in turn is covered
with low surface energy waxy materials with a high degree of resistance to wetting, resulting in a
water contact angle above 150 ° [11]. The rough surface enhances the entrapment of large amount
of air in the gaps of the rough structure resulting in a heterogeneous composite structure and the low
surface energy waxy coating reduces the affinity of water to the surface, weakening the water-solid
interaction. Cassie-Baxter and Wenzel models are the two classic mathematical models which
explain the influence of roughness on wettability [12,13]. These models will be explained in detail later in the section of 2.1.4.
Figure 2.1 (a) Water drop on a lotus leaf; (b) Microstructure of a lotus leaf, (c) A colorful picture of a butterfly and (d) the microstructure of a butterfly wing; (e) Water strider on water surface and (f) the microstructure of a water strider leg showing the special hierarchical arrangement of large numbers of oriented tiny hairs (microsetae) with fine nanogrooves coated with waxy materials.
On the surfaces of animals and insects which exhibit superhydrophobic properties, the water droplets easily roll off. For examples, butterfly wings (fig. 2.1(c)) have the special ability of
superhydrophobicity resulting from the direction-dependent arrangement of flexible nano-patterns on ridging nano-stripes and micro-scales overlapped on the wings at the one-dimensional level (fig. 2.1(d)) [14]. Water striders are also commonly known as shown in fig. 2.1(e), as they can easily stand and walk on water due to the special non-wetting feature of their legs. The water repellency of their legs, according to Gao and Jiang [10], is due to the special hierarchical structure of the legs, as they are covered with large numbers of oriented tiny hairs with fine nanogrooves coated with waxy materials. The microstructure of the water strider leg is shown in fig. 2.1 (f).
2.1.2 The surface energy
Wetting phenomena happen where all the three states (solid, liquid and gas) are in contact, including the behaviors of intersection of three interfaces, solid-liquid, solid-vapor, and liquid-vapor. An interface is the boundary between two phases, and when one side is a vapor or gas, the other is called a surface. One important property of the surface is the extra energy associated with the surfaces, also known as surface energy.
There are two main types of solid surfaces with which liquids can interact. Traditionally, solid surfaces have been divided into high energy solids and low energy types. The relative energy of a solid has to do with the bulk nature of the solid itself. Solid such as metals, glasses, and ceramics are known as "hard solids" because the chemical bonds those hold them together (e.g. covalent, ionic, or metallic) are very strong. Thus, it takes a large input of energy to break these solids so they are termed "higher energy". Most molecular liquids achieve complete wetting with high-energy surfaces. The other type of solids is weak molecular crystals (e.g. fluorocarbons, hydrocarbons, etc.)
hydrogen bonds). Since these solids are held together by weak forces it would take a very low input of energy to break them, and thus, they are termed "low energy" [15].
The wettability of a surface is determined by the outermost chemical groups of the solid. Differences in wettability between surfaces that are similar in structure are due to differences in packing of the atoms. For instance, if a surface has branched chains, it will have poorer packing than a surface with straight chains.
2.1.3 Water contact angle and contact angle hysteresis
Wettability is one of the most important properties of a solid surface. Many practical applications depend on the wetting or non-wetting characteristics of the solid surface. When a water drop comes in contact with a surface, the surface is either wet or not wet depending on the hydrophilicity or hydrophobicity of the surface, respectively. Wettability is assessed by the water contact angle (CA) or 8 formed by the liquid and the substrate. The degree of wetting is characterized by the angle of contact the water drop makes with the surface which is the angle at which the liquid-vapor (LV) interface meets the solid-liquid (SL) interface and the solid-vapor (SV) interface (fig. 2.2). If the surface is hydrophilic, the water drop is strongly attracted to the surface and will spread on the surface providing a contact angle close to 0 °. Less strongly hydrophilic surfaces can have a contact angle up to 90 °. If the surface is hydrophobic, the interaction forces between the water drop and the solid are weaker and the water drop will have a tendency to form a compact droplet on the surface. The contact angle on such surfaces is usually greater than 90 °. The contact angle, therefore, is determined by the strength of the interfacial forces between the water drop and the solid surface. These interfacial forces are sometimes denoted as interfacial tensions or
interracial free surface energies.
A very basic and commonly used relation (eq. 2.1) describing wettability with respect to the contact angle of a drop in equilibrium with a solid surface was given by Young [16]. It relates the interfacial free energies of the three interfaces where drop comes into contact with, when placed on a solid surface, namely the solid/liquid ( 's c) , solid/vapor (Jsv), and liquid/vapor (JLV ) interfaces.
The Une of contact with the three co-existing phases of the system makes an angle of contact, 9, with the surface, as shown in figure 2.2.
7sL
ÏLV
(Equation 2.1)
YL,V
Figure 2.2 A water drop in equilibrium state on a surface, as presented by Young.
The measurement values of CA provide information regarding the bonding energy of the solid surface and the surface tension of the droplet. Because of its simplicity, CA has been broadly accepted for material surface analysis related to wetting, adhesion, and absorption. For a given liquid, a high-surface-energy solid tends to be wetted in contrast to a low-energy surface solid which does not absorb the liquid.
When there is a relative movement between the droplet and the surfece, for instance because of
the movement of the needle, as shown in figure 2.3, there will be a change in the contact angles.
The contact angle hysteresis is defined as the difference between the advancing angle (9 adv) and
the receding angle (9 rec), shown in eq. 2.2.
CAH = e
adv- e
rec (Equation 2.2)Figure 2.3 The schematic of contact angle hysteresis
2.1.4 Effect of roughness on the wettability of the surfaces
To reach contact angle values greater than 150 °, which is necessary for achieving
superhydrophobicity, surface roughness is often added to enhance the hydrophobicity of the solid
surfece. The surfece topography effects have been mathematically expressed by the Wenzel and the
Cassie-Baxter equations. The Wenzel equation is expressed as:
cos O'=R
Wcos 0
where the roughness factor Rw is the ratio of the true and apparent (geometric) surface areas. According to the Wenzel model as shown in fig. 2.4(a), when the true contact angle 0 of water on a smooth surface is less than 90 °, the apparent contact angle 0' is less than the true contact angle 0 on a rough surface, and when the true contact angle 0 is greater than 90 °, the apparent contact angle 0' is greater than the true contact angle 0 on a rough surface. It has been shown that the contact angle and the contact angle hysteresis increase as the roughness factor increases [17]. However, it has also been demonstrated that the contact angle contmues to increase when the roughness factor exceeds a certain level, whereas the hysteresis starts to decrease. This decrease in the CAH is attributed to a transition from the Wenzel regime to the Cassie-Baxter regime where the water drop does not penetrate the surface irregularities; rather, it stays suspended on the tips of the rough crests due to the entrapment of air pockets in those crests.
(a)
(b)
Figure 2.4 Surface topography effects on water contact angle by (a) Wenzel Model; (b) Cassie-Baxter Model.
The Cassie-Baxter model shown in fig. 2.4(b), describes the effect of roughness on chemically heterogeneous structures where the apparent contact angle is mathematically derived from the Cassie equation, as follows:
cos 0' = / , cos 0, + f2 cos 02 ( E q u a t i o n 2A)
where 0* is the contact angle of the composite surface consisting of two components with contact angles 6X and ^ , and their corresponding area fractions /L and f2. In such a composite system,
/j is assumed to be the area fraction of the solid surface and f2 is assumed to be that of air, where
^ is 180 °. As / , + f2 = 1, equation 2.4 can be further modified as:
COS 0' = / j (cos 0x + l) - 1 (Equation 2.5)
This equation explains why, on a rough surface with a large amount of air entrapment in the surface irregularities, one can obtain a highly superhydrophobic surface with a very small area fraction ft of the surface in contact with the water drop.
2.1.5 Applications of superhydrophobicity
A number of products using the lotus effect are already commercially available or in the process of development. Most of these applications use the high water repellent effect, especially of glasses (for architecture, automotive, optical sensor and other applications), roof tiles and other architectural materials [18]. Additionally, sprays and paints that create clean surfaces (e.g. graffiti-resistant) have been proposed, as well as self-cleaning textiles.
Some agricultural applications were also discussed, such as antibiofouling paints for boats [19], bio-chips [20], biomédical applications [21], microfuidics [22], corrosion resistance [23], eyeglasses, self-cleaning windshields for automobiles [1], stain resistant textiles [24], antisticking of snow for antennas and windows [25], expected inhibition of adherence of snow, oxidation, current
conduction [26] and many others. The following section includes how superhydrophobic coatings are used to improve the performance of some applications by surface modification.
2.1.5.1 Anti-icing applications
Ice buildup on overhead transmission and distribution lines may lead to mechanical line failure or insulator flashovers, entailing both power outages and often major costs. As a matter of feet, the ice storm that hit Eastern Canada in January 1998 caused several billions of dollars in damage to the power networks (fig. 2.5) and great hardship among hard-hit communities [27].
Figure 2.5 Image of fallen wood poles due to ice deposited on metal cables.
Sarkar et al. [27] mentioned that superhydrophobicity can help mitigate the ice accretion problem on power network equipment and other exposed structures by reducing ice-to-surfece adhesion. As the contact area of water on a superhydrophobic solid surface is negligible, such surfaces would effectively reduce the contact area of ice as well. Therefore, ice adhesion would be significantly reduced on superhydrophobic surfaces.
2.1.5.2 Self-cleaning applications
Superhydrophobic substrates with a self-cleaning property are prepared mostly on the basis of the lotus effect of plants. As illustrated in figure 2.6, when a droplet of water rolls off the surface of a superhydrophobic substrate, it removes the dust, whereas the dust remains on the normal surfaces.
Figure 2.6 Water droplets rolling off substrates with a normal hydrophobic surface Oe]ft) and a self-cleaning
superhydrophobic surface (right) through dust particles.
Superhydrophobic and self-cleaning surfaces with a high static contact angle above 150 ° and low contact angle hysteresis play an important role in technical applications ranging from self-cleaning window glasses to paints and textiles, and including low-friction surfaces for fluid flow and energy conservation [28,29,30,31].
2.1.5.3 Anti-biofouling applications
Biofouling of underwater structures and ships' hulls, in particular, increases operational and maintenance costs [32,33]. It can be reduced through underwater superhydrophobicity, i.e. forming
a hydrophobic rough surfece that supports an air film between itself and the water [34]. The reduction of the wetted area minimizes the probability that biological organisms encounter a solid surface. The design of such surfaces should involve optimization between mechanical stability and minimal wetted area. The anti-biofouling properties of superhydrophobic coatings have been investigated [ 3 5 ] . Compared to normal substrates which fouled within a day, almost no micro-organisms attached to the superhydrophobic surfaces in the first weeks after immersioa Figure 2.7 shows the photo of devices under biofouling in ocean.
Figure 2.7 The photo of devices under biofouling in ocean.
2.1.5.4 Anti-corrosion applications
It is known the contact with wet environments is the most important reason which leads to the corrosion behavior happens, which can be effectively controlled by making the surface superhydrophobic, where the water is non-sticky, thereby repelling the wet corrosive substance. Figure 2.8 shows the boat which was corroded badly.
Figure 2.8 The boat where the metal has been corroded badly
2.1.5.5 Drag reduction
Turbulent flows of a liquid along a surface experience frictional drag, a macroscopic
phenomenon that affects the speed and efficiency of marine vessels, the cost of pumping oil through
a pipeline, and countless other engineering parameters. The drag arises from shear stress, the rate
per unit area of momentum transfer from the flow to the surface. Superhydrophobic surfaces can be
fabricated in order to reduce the drag based on its highly water repellent property and capable of
forming a thin air film over an underwater surface which stops the surface from becoming wet. The
air film formed over the surface has the property of being able to take in air supplied from outside
because of the surface tension of the water. The superhydrophobic surfaces to reduce frictional drag
have been used in ships. When air is supplied from the bow section to a ship's hull with
superhydrophobic coatings, it becomes attached to the superhydrophobic surface and forms an air
film on it. The frictional drag can thus be reduced by an air lubricant effect. Figure 2.9 shows some
areas where superhydrophobic surfaces can be used to reduce their drag reduction.
Figure 2.9 The applications of superhydrophobicity- drag reduction.
2.2 Preparation techniques of superhydrophobic surfaces
Learning from nature, superhydrophobicity can be obtained by creating a surface with
optimum roughness followed by passivation with a low-surface-energy coating. Therefore,
superhydrophobic surfaces are traditionally prepared using a common two-step procedure where a
micro-nanorough pattern is first created using various procedures such as lithographic and
template-based techniques [36], laser ablation technique [37] and plasma treatment of the surfaces
[38,39], self-assembly and self-organization [40], chemical bath deposition (CBD) [41,42],
chemical vapor deposition (CVD) [43], and electrochemical deposition [44], etc. These surfaces are
then passivated using low surface energy coatings such as use of stearic acid or fluoroalkyl-silane
molecules or by use of Teflon coating by plasma techniques [45]. Some of these methods of
preparing superhydrophobic surfaces will be elaborated in the following sections as part of
literature review.
2.2.1 Electrodeposition technique to achieve superhydrophobicity
Superhydrophobic films can be made by immersing samples in some solutions via electrochemical deposition. Because of its cheaper, faster and easier in operation at lower temperatures, the electrochemistry is used extensively for the formation of nanostructured surfaces, either by applying certain external potential between the electrodes or simply by making use of the galvanic ion exchange reaction between a substrate and ions [46,47,48,49,50,51].
2.2.1.1 Galvanic exchange reaction (electroless deposition)
Safaee et al. [52] studied the superhydrophobic properties of the modified silver-coated copper surfaces. In their experiment, copper substrates were coated by immersing in a silver nitrate solution via a galvanic exchange reaction and then passivated with stearic acid dissolved in acetone or hexane. The galvanic exchange reaction of copper and Ag+ is as follow:
2 Ag+ +Cu-> 2Ag+Cu2+ (Equation 2.6)
The concentration of silver nitrate solution was found to influence the surface of deposited silver and hence the wetting properties after passivation. Variations of contact angle and contact angle hysteresis as a function of the coating time are shown in figure 2.10 [52]. When the concentration is 13.2 mM, the contact angle increases from 134 ° at 0.5 min to 150 ° at 10 min, and finally to 151 ° after 12h, while the contact angle hysteresis decreases correspondingly. On the other hand with the 50 mM solution, contact angle reduces from 155 "to 147 ° and hysteresis increases from 5.1 ° to 10.3 ° at 0.5 and 10 min, respectively. Using the 24.75 mM solution, the highest contact angle, 156 °, is obtained at 1 min while the least hysteresis, 4.1 °, is achieved at 2 min.
*6C
- s :
II. . . - , . . ! <2 tos
* • * o o - • ! f.'. . .. , . , . t 10 Time (min) 1000 1 10 Time (min) 1CG0 Figure 2.10 Variation of water contact angle and hysteresis with coating time.The morphologies of the modified surfaces are shown by SEM measurement in figure 2.11 [52]. It can be seen from the 2.11 (a), (b) and (c) that various concentration of silver nitrate solution leads to various morphologies on the sample surfaces. When the concentration is low (13.2 mM), the film has tiny voids because the low Ag+ concentration contributes to the slow reaction, as
presented in fig. 2.11 (a). Increasing the Ag+concentration to 24.75 mM (fig. 2.1 l(b)) and even to
396 mM (fig. 2.11(c)), however, the driving force of the galvanic exchange reactions is larger, so the reaction becomes faster and larger fractal-like structures of silver appear. Therefore, the size of the voids is more obvious than before, as compared with fig. 2.11 (a). Figure 2.11 (d) is a magnified fractal-like structure to (b). Due to their self-similarity, several nanometric empty spaces exist around the micrometric structures which are separated by voids.
Figure 2.11 SEM images of samples prepared using three different initial Ag+ concentrations of (a), 13.2
mM, (b) 24.75 mM and (c) 396 mM, respectively; and (d) a magnified section of (b); In the insets, the states of the droplets are shown.
Gu et al. [53] also applied galvanic reaction to fabricate superhydrophobic surfaces. In their study, galvanic replacement was adopted to grow cauliflower-like and dendrite coral-like silver films on commercial copper alloy substrates. The galvanic exchange reaction in their study is the same as that of Sarkar et al., as presented in eq. 2.6. However, the morphology of as-deposited silver crystals on the copper alloy substrates as a function of the reaction time is illustrated. The
insets shown in figure 2.12 are the corresponding SEM images with high resolution. After
immersing for 5 s, abundant isolated silver particles with a size of about 50 nm and some nanoplates,
having a length of 100-900 nm and a thickness of about 50 nm, are decorated loosely on the
substrate, as shown in figure 2.12(a). The density of the nanoparticles and nanoplates increases with
the reaction time. For the reaction time of 10 s, the nanoplates are interconnected to build a
flower-like architecture, as shown in the inset of figure 2.12(b). When the reaction time is extended
to 20 s, the interconnected silver nanoplates are transformed to microscopically coral-like silver
aggregates shown in figure 2.12(c). The coral-like silver aggregates are expanded to bigger ones
when prolonging the reaction time to 5min (see figure 2.12(d)). Furthermore, figure 2.12(f) shows
that plenty of silver particles and plates with size of 100-500 nm have fully filled the intervals of the
coral-like silver aggregates. Once some silver crystals have been deposited, further deposition is
more likely on them than on the substrate because deposition on the flat substrate surface is
generally less favorable due to the requirement of the formation of fresh metal nuclei [54]. Figure
2.12(e) gives the surface morphology of as-deposited silver films on the copper alloy substrate after
25 min reactions. It can be seen that dendrite silver crystals are emerged besides coral-like
aggregates, nanoparticles, and nanoplates.
Figure 2.12 SEM images with different magnifications of as-deposited silver crystallites prepared in the 0.01 M AgNCb aqueous solution for reaction time of (a) 5 s; (b) 10 s; (c) 20 s; (d) 5min; (e) 25 min; (f) magnified image corresponding to the area indicated by the rectangle in panel (d).
Sarkar et al. [55] demonstrated that the superhydrophobic silver films on copper substrates can be created in just a one-step process via galvanic reactions by immersing the copper substrates in
silver nitrate solution containing benzoic acid, simplifying the complexity of two different steps involved in the former method. Fig. 2.13 shows the X-ray diffraction (XRD) pattern of (a) copper substrates, (b) the silver films deposited on the copper substrates by the galvanic reaction in silver nitrate solution and (c) the silver films deposited on the copper substrates using silver nitrate solution in the presence of benzoic acid molecules. The characteristic peaks of Ag (1 1 1), Ag (2 0 0), Ag (2 2 0), Ag (3 1 1) and Ag (2 2 2) at 38.18 °, 44.38 °, 64.53 °, 77.48 ° and 81.65 °, respectively, confirming the silver deposition. The origin of the three peaks at 36.5 °, 42.35 ° and 61.43 ° are due to the formation of copper oxide (CU2O) crystalline phase, which is also complemented by the black colored appearance of the deposited films [56]. However, it has been observed from the pattern (c), which silver was deposited on copper substrate with the presence of benzoic acid molecules in the silver nitrate solution (fig. 2.13(c)), the three peaks of G12O are completely disappeared. These films appeared to be pure silver as evident from the distinct peaks of Ag (1 1 1), Ag (2 0 0), Ag (2 2 0) and Ag (3 1 1) at 38.18 °, 44.38 °, 64.53 °, and 77.48 °, respectively [57].
(a . >. In k 120 80 40 0 S
: 1
— . i * i s i 8 < IL . I L t1
O 1 • 1 •1 ï
'••
1
T i . i . < r -— 30 40 50 60 SO 90 26 (degrees)Figure 2.13 XRD patterns of (a) copper substrate, (b) the silver film deposited on galvanic exchange reaction on copper substrate in the silver nitrate solution, and (c) the silver film deposited on galvanic exchange reaction on copper substrate in the silver nitrate solution with benzoic acid molecules.
Furthermore, the chemical composition of the materials are analyzed by energy dispersive X-ray analysis (EDS) spectra of the silver films deposited on copper substrates (a) in silver nitrate solution and (b) in silver nitrate solution with benzoic acid molecules, as presented in fig. 2.14 [55]. The presence of oxygen in the EDS spectrum shown in fig. 2.14(a) is complemented with the observation of CujO by XRD as shown in fig. 2.13(b). EDS spectrum of silver films prepared with the benzoic acid (fig. 2.14(b)) shows the presence of two distinct elements, namely, copper and silver with a trace of carbon. The absence of oxygen in this spectrum (fig. 2.14(b)) is well complemented with the XRD analysis (fig. 2.13(c)), confirmed the deposition of CU2O free pure silver films. The presence of carbon in this EDS spectrum confirms the incorporation of benzoic acid molecule in these films. The inset of fig. 2.14(b) shows the bonding characteristics of the carbon in these films by FTIR. The distinct peak at 1386 cm"1 is due to the presence of COO"
vibration bond with copper possibly resulting in the formation of copper-3-hydroxy benzoate (C7H5CUO3) complementing the XRD analyses. The adsorption of benzoic acid on copper surfaces shows that the COO" vibration bond varies from 1390 to 1405 cm"1 depending on the orientation of
Figure 2.14 EDS spectra of silver films prepared in (a) silver nitrate solution and (b) silver nitrate solution with benzoic acid molecules. Inset shows the FTIR spectra of silver powder collected from the silver films prepared with the benzoic acid molecules.
2.2.1.2 Underpotential deposition
As mentioned in the previous section, galvanic exchange reaction is a kind of spontaneous reaction without external potential applied and some researchers studied the superhydrophobicity by electrochemical deposition without applied potential. In the electrochemical deposition methodology, underpotential deposition is another important type to achieve the deposition phenomena.
In Sarkar's study, the copper nanocrystals were deposited on thin polypyrrole films by the underpotential deposition [59]. Although he didn't investigate the superhydrophobic coatings in that work, the grow mechanism of the copper nanocrystals on the substrate by electrochemistry method
Figure 2.15 compared the SEM micrographs of the copper nanostructures deposited on the 100-nm-thick polypyrrole substrates galvanostatically and potentiostatically [59]. In the galvanostatic mode (of copper deposition), 0.2 mA/cm2 current density is passing through the
electrodes. It is found that the potential on the electrode decreased 0 V to -1.9 V in less than 4 s, as shown in figure 2.15(a). Figure 2.15(b) shows the corresponding SEM micrograph for copper deposition obtained galvanostatically as shown in figure 2.15(a), revealed the presence of a number of remarkably different forms of nanostructures, including cubic nanocrystals (80 run side length) individually or clustering together, nanowires, and microrods or clusters. Closer examination of an individual rod shows that it consists of near-perfect cubic copper nanocrystals. Figure 2.15(c) shows that copper nanostructures deposited at -0.4 V in the under-peak potential region correspond to fractal-like or dendrite structures. In contrast, uniformly dispersed near-perfect cubic nanocrystals (of 80 nm side length) are observed for copper deposition at -0.9 V in the under-peak potential region, as illustrated in figure 2.15(d). It is concluded that variation of the deposition potential may lead to the difference of the morphology as well as the size of the particles deposited on the substrates.
-2.01-0 2 4 6 8 1-2.01-0
Time (s)
500
nm
Figure 2.15(a) Change in the applied potential (V) as a function of time (s) in the galvanostatic mode for copper deposition on a 100-nmthick polypyrrole film. The cross at -0.56 V (versus AgCl/Ag standard potential) marks the peak potential for copper deposition obtained from a cyclic voltammetric scan for polycrystalline copper substrate. Potentials that are higher (e.g., open square at -0.4 V) and lower (e.g., open circle at -0.9 V) than -0.56 V are referred to as under-peak potential and over-peak potential, respectively. Panel b shows the corresponding SEM micrograph for copper deposition obtained galvanostatically as shown in panel a, depicting a variety of structures including nanowires, microrods, fractals, and cubic nanocrystals. Panels c and d show SEM micrographs for copper deposition obtained in potentiostatic mode at (c) under-peak potential (-0.4 V) and (d) overpeak potential (-0.9 V), depicting the changes in the predominant nanostructures from fractals to near-perfect cubic nanocrystals.


![Figure 2.6 Water droplets rolling off substrates with a normal hydrophobic surface O e] ft) and a self-cleaning superhydrophobic surface (right) through dust particles.](https://thumb-eu.123doks.com/thumbv2/123doknet/7693607.244317/39.925.122.805.275.663/figure-droplets-rolling-substrates-hydrophobic-cleaning-superhydrophobic-particles.webp)