Université de Montréal
Rôle du système rénine-angiotensine intrarénal dans
l’hypertension et les dommages rénaux chez les souris
transgéniques diabétiques
Par Fang Liu Programme de sciences biomédicales
Faculté de médecine
Thèse présentée à la faculté des études supérieures en vue de l’obtention du grade de docteurès sciences (Ph.D)
en sciences biomédicales
Septembre 2008
Université de Montréal
Faculté des études supérieure
Cette thèse intitulée
Rôle du système rénine-angiotensine intrarénal dans
l’hypertension et les dommages rénaux chez les souris
transgéniques diabétiques
Présentée par :
Fang Liu
a été évaluée par un jury composé des personnes suivantes :
Dr. Daniel Lajeunesse Président rapporteur Dr. John S.D. Chan Directeur de recherche Dre. Shao-Ling Zhang Codirecteur de recherche Dr. Jean-Pierre Hallé Membre du jury Dre. Kevin D. Burns Examinateur externe
RÉSUMÉ
Plusieurs expériences et études cliniques ont démontré que l’activation du système rénine-angiotensine (RAS) peut induire l’hypertension, un facteur de risque majeur pour les maladies cardiovasculaires et rénales. L’angiotensinogène (Agt) est l’unique substrat du RAS. Cependant, il n’a pas encore été démontré si l’activation du RAS intrarénal peut à elle seule induire des dommages rénaux, indépendamment de l’hypertension systémique, et ainsi jouer un rôle prépondérant dans la progression de la néphropathie diabétique.
Afin d’explorer le rôle du RAS intrarénal dans les dommages rénaux, un diabète a été induit par l’injection de streptozotocin chez des souris transgéniques (Tg) surexprimant l’Agt de rat dans les cellules des tubules proximaux du rein (RPTC). Les souris Tg diabétiques ont été traitées soit avec des inhibiteurs du RAS (perindopril et losartan), de l’insuline ou une combinaison des deux pour 4 semaines avant d’être euthanasiées. Pour une autre étude, des souris Tg non-diabétiques ont été traitées soit avec des inhibiteurs du RAS, l’hydralazine (vasodilatateur) ou l’apocynine (inhibiteur de la NADPH oxydase) pour une période de 8 semaines avant l’euthanasie. Des souris non-Tg ont été utilisées comme contrôles. Des cellules immortalisées de tubule proximal de rat (IRPTC) transfectées de manière stable avec un plasmide contenant l’Agt ou un plasmide contrôle ont été employées comme modèle in vitro.
Nos résultats ont démontré que les souris Tg présentaient une augmentation significative de la pression systolique, l’albuminurie, l’apoptose des RPTC et l’expression de gènes pro-apoptotiques par rapport aux souris non-Tg. Les mêmes changements ont été observés chez les souris Tg diabétiques par rapport aux souris non-Tg diabétiques. L’insuline et/ou les inhibiteurs du RAS ont permis d’atténuer ces changements, sauf l’hypertension qui n’était réduite que par les inhibiteurs du RAS. Chez les IRPTC transfectées
avec l’Agt in vitro, les hautes concentrations de glucose augmentent l’apoptose et l’activité de la caspase-3 par rapport aux cellules contrôles et l’insuline et/ou les inhibiteurs du RAS empêchent ces augmentations.
En plus des changements physiologiques, les RPTC des souris Tg présentent aussi une augmentation significative de la production des espèces réactive de l’oxygène (ROS) et de l’activité de la NADPH oxydase, ainsi qu’une augmentation de l’expression du facteur de croissance transformant-beta 1 (TGF-β1), de l’inhibiteur activateur du plasminogène de type 1 (PAI-1), des protéines de la matrice extracellulaire, du collagène de type IV et de la sous-unité p47 de la NADPH oxydase. Le traitement des souris Tg avec l’apocynine et le perindopril a permis d’améliorer tous ces changements, sauf l’hypertension qui n’était pas corrigée par l’apocynine. D’autre part, l’hydralazine a prévenu l’hypertension, sans modifier l’albuminurie, l’apoptose des RPTC ou l’expression des gènes pro-apoptotiques.
Ces résultats montrent bien que l’activation du RAS intrarénal et l’hyperglycémie agissent de concert pour induire l’albuminurie et l’apoptose des RPTC, indépendamment de l’hypertension systémique. La génération des ROS via l’activation de la NADPH oxydase induit en partie l’action du RAS intrarénal sur l’apoptose des RPTC, la fibrose tubulo-interstitielle et l’albuminurie chez les souris Tg.
D’autre part, une expérience en cours a tenté d’encore mieux délimiter les effets de l’activation du RAS intrarénal, tout en éliminant la néphrotoxicité du STZ. Pour cette étude, les souris Tg surexprimant l’Agt de rat dans leurs RPTC ont été croisées aux souris Ins2Akita, un modèle spontané de diabète de type I, afin de générer des souris Akita-rAgt-Tg. Les résultats préliminaires indiquent que le RAS intrarénal est activé dans les souris Akita et que la combinaison avec l’hyperglycémie induit du stress du réticulum endoplasmique (ER) dans les RPTC in vivo. Le stress du ER contribue à l’apoptose des RPTC observée dans le diabète, à tout le moins dans le modèle Akita. Le traitement avec des inhibiteurs du RAS permet d’atténuer certains des dommanges rénaux observés dans les souris Akita-rAgt-Tg.
Mots-clés: Rein, système rénine-angiotensine, néphropathie diabétique, hypertension, apoptose, fibrose tubulo-interstitielle, ROS, NADPH oxidase, stress du ER, modèle de souris Ins2Akita
ABSTRACT
Experimental and clinical studies have shown that renin-angiotensin system (RAS) activation may lead to hypertension, a major cardiovascular and renal risk factor. Angiotensinogen (Agt) is the sole substrate of the RAS. However, it is unclear whether intrarenal RAS activation alone could induce kidney injury independently of systemic hypertension and play an important role in the progression of diabetic nephropathy (DN). To explore the role of intrarenal RAS in kidney injury, transgenic (Tg) mice overexpressing rat Agt in their renal proximal tubular cells (RPTCs) were rendered diabetic by streptozotocin (STZ). Diabetic Tg mice were treated with RAS blockers (perindopril and losartan), insulin or a combination of both and then euthanized after 4 weeks of treatment. In a separate study, non-diabetic Tg mice were treated with RAS blockers or hydralazine (a vasodilator) or apocynin (an NADPH oxidase inhibitor) and then euthanized after 8 weeks of treatment. Non-Tg littermates served as controls in both studies. Immortalized rat proximal tubule cells (IRPTCs) stably transfected with Agt cDNA or control plasmid were used in the experiments as an in vitro model.
Our results showed that non-diabetic Tg mice displayed a significant increase in systolic blood pressure (SBP), albuminuria, RPTC apoptosis, and proapoptotic gene expression. Diabetic Tg mice had a further increase of albuminuria, RPTC apoptosis, and proapoptotic gene expression, though the SBP of the diabetic Tg mice was similar to that of non-diabetic Tg mice. RAS blockers and/or insulin treatments markedly attenuated these changes, except that insulin had no impact on hypertension. In vitro, high-glucose melieu significantly increased apoptosis and caspase-3 activity in Agt stable transfectants compared to control cells, and these changes were attenuated by insulin and/or RAS blockers.
Furthermore, non-diabetic Tg mice showed significantly elevated reactive oxygen species (ROS) production and NADPH oxidase activity, as well as
enhanced expression of transforming growth factor-beta 1 (TGF-β1), plasminogen activator inhibitor-1 (PAI-1), extracellular matrix proteins, collagen type IV, and NADPH oxidase subunit p47 in their RPTC. Treatment with apocynin and perindopril ameliorated these changes, but apocynin had no effect on SBP. In contrast, hydralazine prevented hypertension but not albuminuria, RPTC apoptosis, or proapoptotic gene expression.
These data indicate that intrarenal RAS activation and hyperglycemia act in concert to induce albuminuria and RPTC apoptosis independent of systemic hypertension. ROS generation via NADPH oxidase activation mediates, at least in part, intrarenal RAS action on RPTC apoptosis, tubulointerstitial fibrosis and albuminuria in Tg mice.
On the other hand, in an on-going experiment, to avoid the nephro-toxic effects of STZ and further delineate the effects of intrarenal RAS activation, Tg mice overexpressing rat Agt in their RPTCs were crossbred with Ins2Akita mice, a spontaneous type I diabetes model, to generate Akita-rAgt-Tg mice. Preliminary data indicated that hyperglycaemia and intrarenal RAS activation induced endoplasmic reticulum (ER) stress in RPTC in vivo, and the ER stress pathway contributed to RPTC apoptosis in diabetes, at least in the Akita model. RAS blockade was effective in attenuating some parameters of renal injury in Akita-rAgt-Tg mice.
Key words: Kidney, renin-angiotensin system, diabetic nephropathy, hypertension, apoptosis, tubulointerstitial fibrosis, ROS, NADPH oxidase
Table of Contents
Résumé………..iii Abstract……….vi Table of Contents………...viii List of Tables………...xiii List of Figures………..xiv List of Abbreviations………..xix Acknowledgements………...xxiv Chapter 1—Introduction 1.1 Renal physiology and Histology……….21.1.1 Renal physiology………...2
1.1.2 Renal histology………...3
1.1.2.1 Renal filtration barrier………...3
1.1.2.2 Other components of a nephron………...4
1.2 Pathological changes in kidney diseases……….7
1.3 Chronic kidney Diseases……….8
1.3.1 CKD and GFR………...8
1.3.2 Incidence, prevalence and cause of ESRD………..9
1.4 Diabetes Mellitus (DM)………...11
1.4.1 Prevalence and cost of diabetes………..11
1.4.2 Pathogenesis of diabetic complications………..11
1.4.3 ROS and oxidative stress………...19
1.5 Diabetic Nephropathy (DN)…..………...22 1.5.1 Pathogenesis of DN ………...23 1.5.1.1 AGEs and DN………...23 1.5.1.2 PKC and DN ………..25 1.5.1.3 TGF-β and DN………26 1.5.1.4 Hypertension and DN………....28
1.5.1.5 Oxidative stress in DN………..29
1.5.1.6 Peroxisome proliferator-activated receptors (PPARs) and DN……… ….32
1.5.2 Apoptosis and diabetic kidneys………...35
1.5.2.1 General apoptosis pathways………...35
1.5.2.2 ER stress and apoptosis………….………..37
1.5.2.3 Apoptosis in diabetic glomeruli………...42
1.5.2.4 Apoptosis in diabetic tubules………...43
1.6 Renin-angiotensin system (RAS)……….………..45
1.6.1 Local RASs ………...46
1.6.2 Intrarena lRAS activation and hypertension development ………...………..47
1.6.2.1 Animal models of RAS activation and hypertension……….47
1.6.2.1.1 RAS KO mice………...47
1.6.2.1.2 Tg mice overexpressing systemic or intrarenal RAS………….50
1.6.3 In vitro models of intrarenal RAS activation………...53
1.6.3.1 Characteristics of LLC-PK1 cells………...53
1.6.3.2 Characteristics of HK-2 cells………....53
1.6.3.3 The vEPT cells………...54
1.6.3.4 IRPTCs in the present study………54
1.6.4 BP measurement……….55
1.6.5 Intrarenal RAS and DN………...56
1.6.5.1 Haemodynamic effects of AngII………...56
1.6.5.2 Non-haemodynamic effects of AngII………...57
1.6.6 Clinical trials of RAS blockade in diabetic patients………...57
1.7 Relationship between Nephropathy and hypertension……….59
1.7.1 Key role of the kidneys in BP regulation ……….59
1.7.2 Hypertension causing nephropathy………..60
1.8 Animal models of DN research……….61
1.9 Brief description of apocynin and hydralazine………...63
Chapter 2—Article 1
Enhanced Tubular Apoptosis in Diabetic Transgenic Mice Overexpressing Angiotensinogen Gene
2.1 Abstract………....68
2.2 Introduction………..68
2.3 Results………...69
2.4 Discussion………73
2.5 Materials and Methods………..75
2.6 Acknowledgements………78
2.7 References………..79
2.8 Legends and Figures………...84
Chapter 3—Article 2 Apocynin attenuates tubular apoptosis and tubulointerstitial fibrosis in transgenic mice independent of hypertension 3.1 Abstract………99
3.2 Introduction………...99
3.3 Results………...100
3.4 Discussion……….103
3.5 Materials and Methods………106
3.6 Acknowledgements………...111
3.7 References………111
3.8 Legends and Figures………...117
Chapter 4—Discussion 4.1. Hypertension and albuminuria in rAgt-Tg mice………..129
4.2. Relationship between hypertension and ROS………131
4.2.2 Clinical studies of antioxidants in the treatment of hypertension
……….134
4.2.3 NADPH oxidase activation mainly involved in ROS generation in rAgt Tg mice ……….135
4.3. Effect of hyperglycaemia and intrarenal RAS activation on renal injury ………...137
4.3.1 Pathway(s) involved in RPTC apoptosis in non-diabetic and diabetic rAgt Tg mice………...137
4.3.2 Tubulointerstitial fibrosis and RPTC hypertrophy in rAgt Tg mice ………...140
4.3.2.1 Evidence of tubulointerstitial fibrosis in rAgt Tg mice………..140
4.3.2.2 Evidence of RPTC hypertrophy and atrophy in rAgt-Tg mice………143
4.4 Limitations of the present study……….144
Chapter 5—Unpublished data 5.1 Intrarenal RAS activation in Akita mice……….147
5.2 Hypertension in Akita mice……….147
5.3 Kidney damage in Akita mice………...148
5.4 Unpublished data………...149
Chapter 6—Perspective Research 6.1 The study on Akita and Akita-Agt-Tg mice………...161
6.1.1 Effect of RAS blockers……….161
6.1.2 Insulin treatment………...161
6.1.3 In vitro study to delineate the relationship between intrarenal RAS activation and ER stress……….162
6.1.4Updated data requiring further experiments on Akita and Akita-rAgt-Tg mice with RAS blockade………...162
Chapter 7—References
Reference……….164
Appendix
List of Tables
Table 1-1:5 Stages of Chronic Kidney Disease (page 9) Table 1-2: Average estimated GFR by age (page 9)
Table 1-3: Effects of AGEs that potentially contribute to DN (page 25) Table 1-4: Evidence for critical role of ROS in ECM remodeling in diabetic
kidney (page 32)
Table 1-5: Select mouse models of diabetes studied for DN (page 63) Table 2-1: Primers for RT-PCR (page 84)
List of Figures
Figure 1-1: simple diagram of a kidney nephron (page 2) Figure 1-2: Renal filtration barrier (page 4)
Figure 1-3: A, Proximal convoluted tubules (page 5) B, reabsorption of glucose, amino acid by proximal convoluted tubule (page 5)
Figure 1-4: Thin loop of Henle and distal tubule (page 6) Figure 1-5: JG apparatus (page 7)
Figure 1-6: A, normal renal histology; B, histology of end stage renal disease (page 7)
Figure 1-7: A, normal kidney; B, end stage kidney (page 8) Figure 1-8: causes of ESRD (page 10)
Figure 1-9: Cost of diabetes and its complications in Canada (page 11) Figure 1-10: Aldose reductase and the polyol pathway (page 13) Figure 1-11: Pathways for AGE Formation (page 14)
Figure 1-12: Protein architecture and cofactor requirements of various subfamilies of PKC (page 16)
Figure 1-13: Physiological effects and cellular mechanisms of DAG–PKC activation induced hyperglycemia (page 17)
Figure 1-14: The hexosamine pathway (page 18)
Figure 1-15: Mitochondrial overproduction of superoxide activates four major pathways of hyperglycaemic damage by inhibiting GAPDH (page 19)
Figure 1-16: Production of superoxide by the mitochondrial electron transport chain (page 20)
Figure 1-17: Relevant sites of production of reactive oxygen species (ROS) and antioxidant systems in a generic cell type (page 21)
Figure 1-18: A1, normal GBM, A2, GBM thickening in diabetes; B, mesangial matrix expansion and sclerosis in a diabetic glomerulus (page 23)
Figure 1-19: Cell signaling pathway of TGF-β superfamily of ligands (page 27) Figure 1-20: Molecular mechanisms of diabetic nephropathy (page 28)
Figure 1-22: NADPH oxidase subunits (page 31) Figure 1-23: PPAR structure (page 33)
Figure 1-24: Intrinsic and extrinsic apoptosis pathways (page 37)
Figure 1-25: Mechanisms of apoptosis in response to ER stress (page 38) Figure 1-26: Renin–angiotensin system (page 476)
Figure 1-27: Model for the production of AngII by proximal tubular cells (page 47)
Figure 1-28: Schematic map of the kidney androgen-regulated promoter (KAP2)-rat angiotensinogen (rANG) construct (page 52)
Figure 2-1: Transgene expression (page 85)
Figure 2-2: Blood glucose, kidney/body weight ratio, and urinary albumin / creatinine ratio in male non-Tg and Tg mice after 4 weeks of STZ-induced diabetes with or without treatment with insulin or RAS blockers (page 86)
Figure 2-3: Systolic BP in Tg and non-Tg mice (page 87)
Figure 2-4: Hematoxylin/eosin staining of kidneys of male non-Tg mice and Tg mice after 4 weeks of STZ-induced diabetes with or without treatment with insulin, RAS blockers or insulin plus RAS blockers (page 88)
Figure 2-5: Apoptosis in male non-Tg and Tg mouse kidneys after 4 weeks of STZ-induced diabetes with or without treatment with insulin or RAS blockers or insulin plus RAS blockers, analyzed by TUNEL assay (page 89)
Figure 2-6: Immunohistochemical staining and Western Blots of α-active caspase-3 in male non-Tg and Tg mouse kidneys after 4 weeks of STZ-induced diabetes with or without treatment with insulin or RAS blockers or insulin plus RAS blockers employing rabbit anti-α-active caspase-3 antibodies (1:50 dilution) (page 90)
Figure 2-7: Immunohistochemical staining and Western Blots of Bax in male non-Tg and Tg mouse kidneys after 4 weeks of STZ-induced diabetes with or without treatment with insulin or RAS blockers or insulin plus RAS blockers employing rabbit anti-Bax antibodies (page 91)
Figure 2-8: RT-qPCR assays of Bax and Bcl-xL mRNA expression in RPTs of non-Tg and Tg mice after 4 weeks of STZ-induced diabetes with or without
treatment with insulin or RAS blockers or insulin plus RAS blockers. Bax and β-actin or Bcl-xL and β-β-actin mRNAs were run simultaneously in the same RT-qPCR assay (page 92)
Figure 2-9: Blood glucose, kidney/body weight ratio, urinary albumin / creatinine ratio, and mean systolic blood pressure in male non-Tg and Tg mice with or without hydralazine treatment (page 93)
Figure 2-10: TUNEL assay of apoptotic RPTCs in male non-Tg and Tg mouse kidneys with or without hydralazine treatment (page 94)
Figure 2-11: Bar graph showing semi-quantitative analysis of active caspase-3 and Bax staining in RPTCs and RT-qPCR assay of Bax and Bcl-XL mRNA expression in RPTs of male non-Tg and Tg mice with or without hydralazine treatment (page 95)
Figure 2-12: Effect of high glucose on RPTC apoptosis and caspase-3 activity in stable transfectants with or without treatment with insulin or RAS blockers or insulin plus RAS blockers (page 96)
Figure 3-1: ROS generation, urinary albumin/creatinine ratio and kidney/body weight ratio in male non-Tg and Tg mice with or without apocynin, perindopril or hydralazine treatment (page 118)
Figure 3-2: SBP in Tg and non-Tg mice. (A) Longitudinal changes in mean SBP in male non-Tg and Tg mice with or without apocynin, perindopril or hydralazine treatment for a 8-week period (page 119)
Figure 3-3: Hematoxylin/eosin (H/E) staining of kidneys of male non-Tg mice and Tg mice with or without apocynin, perindopril or hydralazine treatment (page 120)
Figure 3-4: Apoptosis in male non-Tg and Tg mouse kidneys with or without apocynin, perindopril or hydralazine treatment, analyzed by TUNEL assay (page 121)
Figure 3-5: Immunohistochemical staining of α-active caspase-3 (A) and Bax (B) in male non-Tg and Tg mouse kidneys with or without apocynin, perindopril or hydralazine treatment, employing rabbit anti-α-active caspase-3 and anti-Bax antibodies (1: 50 dilution), respectively (page 122)
Figure 3-6: Periodic-acid Schiff (PAS) staining (A), Masson’s Trichrome staining (B) and collagen type IV immunostaining (C) of male non-Tg and Tg mouse kidneys at week 20 (page 123)
Figure 3-7: TGF-β1 (A) and PAI-1 (B) immunostaining of male non-Tg and Tg mouse kidneys at week 20 (page 124)
Figure 3-8: RT-qPCR assays of Bax (A), Bcl-xL (B), TGF-β1 (C) and PAI-1 (D) mRNA expression in RPTs of non-Tg and Tg mice with or without apocynin, perindopril or hydralazine treatment (page 125)
Figure 3-9: ROS generation, NADPH oxidase activity and Western blotting of p47phox in RPTs of non-Tg and Tg mice with or without apocynin treatment (page 126)
Figure 4-1: Intracellular ROS modify the activity of protein tyrosine kinases (page 133)
Figure 4-2: Mechanisms whereby mechanical forces influence generation of nitric oxide (NO) and ROS in vascular cells (page 133)
Figure 4-3: Scheme of ANG II-mediated apoptosis (page 139) Figure 5-1: Agt expression in mouse kidneys(page 150)
Figure 5-2: SBP in wild type, Akita, Akita treated with losartan and perindorpril, Agt Tg mice, Akita-Agt Tg mice and Akita-Agt Tg mice treated with losartan and perindopril (page 151)
Figure 5-3: (A) Blood glucose level, (B) Kidney/body weight ratio, (C) albumin/creatinine ratio (D) kidney pictures in wild type, Akita, Akita treated with losartan and perindorpril, Agt Tg mice, Akita-Agt Tg mice and Akita-Agt Tg mice treated with losartan and perindopril (page 152)
Figure 5-4: (A) HE staining of kidneys in wild type, Akita, Akita treated with losartan and perindorpril, Agt Tg mice, Akita-Agt Tg mice and Akita-Agt Tg mice treated with losartan and perindopril (page 153)
Figure 5-5: (A) Masson’s Trichrome staining, (B) collagen type IV immunohistochemical staining of kidneys in wild type, Akita, Akita treated with losartan and perindorpril, Agt Tg mice, Akita-Agt Tg mice and Akita-Agt Tg mice treated with losartan and perindopril (page 154)
Figure 5-6: Apoptosis analyzed by TUNEL assay (A) and active caspase 3 immnunohistochemical staining (B) of kidneys in wild type, Akita, Akita treated with losartan and perindorpril, Agt Tg mice, Akita-Agt Tg mice and Akita-Agt Tg mice treated with losartan and perindopril (page 155)
Figure 5-7: Caspase 12 expression in kidneys of wild type, Akita, Akita treated with losartan and perindorpril, Agt Tg mice, Akita-Agt Tg mice and Akita-Agt Tg mice treated with losartan and perindopril (page 156)
Figure 5-8: Caspase 12 expression in kidneys of wild type, Akita, Akita treated with losartan and perindorpril, Agt Tg mice, Akita-Agt Tg mice and Akita-Agt Tg mice treated with losartan and perindopril (page 157)
Figure 5-9: Immunohistochemical staining of CHOP in kidneys of wild type, Akita, Akita treated with losartan and perindorpril, Agt Tg mice, Akita-Agt Tg mice and Akita-Agt Tg mice treated with losartan and perindopril (page 158) Figure 5-10: RT-qPCR of (A)TGF-β1, (B)PAI-1, (C) Bax, (D)Bcl-Xl, (E)CHOP and (F)GRP78 mRNA expression in RPTs of kidneys of wild type, Akita, Akita treated with losartan and perindorpril, Agt Tg mice, Agt Tg mice and Akita-Agt Tg mice treated with losartan and perindopril (page 159)
List of Abbreviations
α-SMA: α-smooth muscle actin 8-OHdG: 8-hydroy-deoxyguanosine ACE: angiotensin converting enzyme ADA: American Diabetes Association ADH:antidiuretic hormone
AGEs: advanced glycation end-products Agt: Angiotensinogen
AIF: apoptosis-inducing factor Ang: angiotensin
AR : aldose reductase
ARBs: angiotensin receptor blockers
ASK1: Apoptosis signal-regulating kinase 1 AT1R: angiotensin II subtype I receptor AT2R: angiotensin II sybtype 2 receptor ATF: activating transcription factor
BENEDICT: Bergamo Nephrologic Diabetes Complications Trial BIK: Bcl2-interacting killer
BiP: binding immunoglobulin protein BP: blood pressure
CAD: Caspase-Activated DNAse CDA: Canadian Diabetes Association
CHOP: ((C/EBP (CCAAT/enhancer-binding protein) homologus protein CIHI: Canadian Institute for Health Information
CKD: chronic kidney disease CML: carboxymethyl
CNS: central nervous system
DAG: diacylglycerol
DED: Death Effector Domain
DFF/CAD: DNA-Fragmentation Factor/ Caspase-Activated DNAse DIABLO: direct inhibitor of apoptosis (IAP)-binding protein with low pI DISC: Death Inducing Signaling Complex
DM: Diabetes mellitus DN: Diabetic nephropathy DR5: death receptor 5 ECM: extracellular matrix
ELISA: Enzyme-Linked ImmunoSorbent Assay EMT: epithelial-mesenchymal transition
Endo G: Endonuclease-G ER: endoplasmic reticulum
ERAD: ER-associated degradation
ERK: extracellular signal-regulated kinase ERO1: endoplasmic reticulum oxidoreductin 1 ESRD: end–stage renal disease
FADD: Fas-Associated via Death Domain FasL: Fas ligand
GADD: growth arrest and DNA damage
GAPDH: Glyceraldehyde 3-phosphate dehydrogenase GBM: glomerular basement membrane
GFAT: glutamine: fructose-6 phosphate amidotransferase GFR: glomerular filtration rate
GlcNAc: N-acetyl glucosamine GSH: reduced glutathione HE: hematoxylin-eosin
IAPs: Inhibitor of Apoptosis Proteins
IRE1: inositol-requiring enzyme 1
IRPTCs: immortalized renal proximal tubular cells
JAK/STAT: Janus kinase/signal transducers and activation of transcription JG apparatus: Juxtaglomerular apparatus
JNK/SAPK: c-Jun N-terminal kinase/stress-activated protein kinase KAP: kidney androgen-regulated protein
KO: knockout
MAPKs: mitogen-activated protein kinases MCP-1: monocyte chemoattractant protein-1 MMPs: matrix metalloproteinases
MPO: myeloperoxidase
NADPH: nicotinamide-adenine dinucleotide phosphate NEP: neutral endopeptidase
NF-κB: nuclear factore-κB
NIDDK: National Institute of Diabetes and Digestive and Kidney Diseases NKF: National Kidney Foundation
NO: nitric oxide
NOD: nonobese diabetic OK: opossum kidney
OMI/HTRA2: High Temperature Requirement Protein-A2 ONOO- : peroxynitrite anion
PA: plasminogen activator
PAI-1: plasminogen activator inhibitor-1 PARP: poly (ADP-ribose) polymerase
PERK: pancreatic ER kinase (PKR)-like ER kinase PKC: protein kinase C
PP1: protein phosphatase 1
PPARs: Peroxisome proliferator-activated receptors PS: phosphatidyl serine
PTCs: proximal tubular cells PTs: proximal tubules RAGE: receptor for AGEs
RAP: receptor-associated protein RAS: renin-angiotensin system RIA: radioimmunoassay
ROS: Reactive Oxygen Species RPT: renal proximal tubules RPTC: renal proximal tubular cells RRT: renal replacement therapy SBP: systolic blood pressure SD rats: Sprague Dawley rats SHR: spontaneous hypertension rat
SMAC: Second Mitochondria-Derived Activator of Caspase SOD: superoxide dismutase
STZ: streptozotocin T1D: type 1 diabetes T2D: type 2 diabetes
TEF: transcription enhancer factor Tg: transgenic
TGF-β1: transforming growth factor-β1 TNFR1: Tumor Necrosis Factor Receptor-1
TRADD: Tumor Necrosis Factor Receptor-1-Associated Death Domain TRAF2: TNF receptor associated factor 2
TUNEL: Terminal deoxynucleotidyl Transferase dUTP nick end labeling TZD: thiazolidinediones
UDP: uridine diphosphate
UPR: unfolded protein response
VEGF: vascular endothelial growth factor
VSMCs: vascular smooth muscle cells XBP-1: X-box binding protein 1
Acknowledgement
I would like to thank my supervisor Dr. John S.D. Chan for his full support and for giving me the opportunity to learn and perform experiments. Dr. Chan’s hard work is an excellent example for me and his enthusiasm and perseverance of science influence me greatly. His insightful encouragements helped me develop my passion for science and gave me the confidence to pursue my career in science. It has been a precious experience to be Dr. Chan’s student.
I would also like to thank my co-director Dr. Shao-Ling Zhang for her academic direction. Moreover, I would like to express my gratitude to Dr. Marie-Luise Brezniceanu, Dr. Chih-Chang Wei, Miss. Yunwen-Chen, Stella Tran, Garnet Lau and Mr. Nicolas Godin in our lab. Specifically, I appreciate all the generous help from Ms. Isabelle Chénier. Though Dr. Cara Lau just joined the lab recently, her practical suggestions and careful correction of my thesis helped in making it more comprehensive and easier to understand.
Finally, I am grateful to my family. The love from my husband, my daughter and my mother are my sources of energy.
1.1 Renal physiology and histology 1.1.1 Renal physiology
The kidney is the most important organ for maintaining homeostasis of the organism regarding both its volume and composition. It is responsible for the removal of metabolic waste products, such as urea, uric acid, creatinine and other end-products of normal metabolism from the blood, and of foreign substances, such as drugs. The kidney is also essential for regulating extracellular fluid osmolarity and for concentrating electrolytes. Another one of its functions is the secretion of hormones: erythropoietin, renin, etc. Urine is formed by the kidney in 3 steps, beginning with the filtration of protein-free plasma into Bowman's capsule, followed by tubular reabsorption and/or tubular secretion.
The nephron, the basic functional unit of the kidney, consists of a renal tubule and a renal corpuscle (a glomerulus enclosed in a Bowman’s capsule) (Figure 1-1) [1]. Urine is formed by the nephron-filtration and collecting duct systems. There are approximately 1.7 to 2.4 million nephrons in both kidneys. The typical glomerular filtration rate (GFR) is around 180 litres per day, or 125 ml per minute. However, only 1-2 litres of urine are excreted per day, implying that 99% of the filtered volume is reabsorbed.
1.1.2 Renal histology
Light microscopy reveals 2 general classes of nephrons, based on the location of the renal corpuscles: cortical nephrons, whose renal corpuscles are in the superficial renal cortex; and juxtamedullary nephrons, whose renal corpuscles are located near the renal medulla. A renal corpuscle is the beginning of a nephron. It is composed of a glomerulus and Bowmans’s capsule (or "Malphigian corpuscle").
The glomerulus is a capillary tuft. It receives its blood supply from an afferent arteriole of the renal circulation. Water and solutes from the blood filter into Bowman’s capsule by glomerular blood pressure (BP), resulting in ultrafiltrate formation. About 20% of plasma passing through the kidneys filters into Bowman’s capsule. The remainder of the blood passes into efferent arterioles, which are narrower than afferent arterioles, forming glomerular BP.
1.1.2.1 Renal filtration barrier
The ultrafiltrate passes through the endothelial cells, the glomerular basement membrane (GBM), and podocytes, which form the renal filtration barrier. The ultrafiltrate then enters the proximal tubules (PTs). However, endothelial cells lining the glomerulus are not usually regarded as part of the renal filtration barrier because they exhibit such large openings that any substance smaller than an erythrocyte can pass through.
The glomerular endothelium sits on the GBM, which is about 250-350 nm thick. The GBM contains 3 layers: the lamina rara externa − adjacent to podocyte processes, the lamina densa − a dark central zone, and the lamina rara interna − adjacent to the endothelial cells. The GBM is rich in negatively-charged glycosaminoglycans, such as heparan sulfate, which serves as part of a charge-selectivity barrier. The negatively-charged basement membrane repels negatively-charged proteins from the blood, preventing proteins from passing into Bowman's space.
Figure 1-2. Renal filtration barrier (ref. [2])
On the other side of the GBM are the podocytes, which cover the GBM with interdigitating foot processes (or “pedicels”). The space between adjacent podocyte foot processes is called the filtration slit, spanned by a slit diaphragm, which is composed of a number of cell-surface proteins, including nephrin, podocalyxin, etc., ensuring that large macromolecules, such as serum albumin and γ-globulin, remain in the bloodstream. Figure 1-2 illustrates the renal filtration barrier [2].
1.1.2.2 Other components of nephrons (a)Intraglomerular mesangial cells
Intraglomerular mesangial cells are located among mesangial matrices within a renal corpuscle. They regulate blood flow of the glomerular capillaries by their contractile activity and contribute to the formation of extracellular matrix (ECM), including fibronectin and type IV collagen. Phagocytosis is another function of the intraglomerular mesangial cells; GBM components and immunoglobins can be phagocytosed by mesangial cells.
(b) Renal tubules
Another portion of the nephron is the renal tubule, which contains a PT, Henle’s loop and a distal convoluted tubule. Functionally, the most important segment, the PT can be divided into 2 parts: the proximal convoluted tubule (Figure 1-3 A) and the proximal straight tubule. The most distinctive characteristic of the PT is its brush border, i.e. microvilli on the luminal surface.
They increase the luminal surface area of proximal tubular cells (PTCs) to facilitate their resorptive function. One hundred percent of glucose and amino acids as well as most water, salt and urea are reabsorbed by PTs from the ultrafiltrate.
In detail, glucose is reabsorbed by a fixed number of carrier molecules on the membranes of proximal convoluted tubules. The ability to reabsorb glucose from the filtrate depends on its level in the blood. For example, in the diabetic condition, the glucose level in blood is so high that the number of carrier molecules is not sufficient to transport all of it in the filtrate; therefore, glucose remains in the urine, and glycosuria develops. Normally, by the end of the PTs, all filtered glucose should be reabsorbed. Another function of PTCs is secretion: they secrete hydrogen ions, creatinine, etc. into the lumen (Figure 1-3 B).
Figure 1-3A. Proximal convoluted tubules (ref.[3])
Figure 1-3B. Reabsorption of glucose and amino acids by proximal convoluted tubules (ref.[4])
After the PT comes Henle’s loop (Figures 1-1 and 1-4). It can be divided into 4 parts: the descending limb of Henle’s loop, the thin ascending limb of Henle’s loop, the medullary thick ascending limb of Henle’s loop, and the cortical thick ascending limb. One special effect of Henle’s loop is to establish medullary hyperosmolarity. It transports NaCl from the tubule lumen to the interstitium with almost no water, building an hyperosmotic medullary interstitium and delivering hyposmotic tubule fluid to the distal tubule.
Figure 1-4. Thin limb of Henle’s loop and distal tubule (ref. [5])
(d) Distal tubules
The distal convoluted tubule is the final segment of the nephron. Distal tubular cells are simple cuboidal cells that are shorter than PTCs. They reabsorb H2O and sodium, and secrete potassium, protons, etc. Aldosterone can increase sodium reabsorption by the distal tubule. After the distal tubule, the collecting duct connects the nephrons to the ureter. It is the last component of the kidney to influence the body's electrolyte and fluid balance.
(e) Juxtaglomerular (JG) apparatus
The JG apparatus (Figure 1-5) [6] [7] is a unique segment of the nephron located in the renal cortex, where the afferent arteriole and distal convoluted tubule make direct contact with each other. The JG apparatus works to regulate filtrate formation and systemic BP. It is composed of JG cells, macula densa cells and extraglomerular mesangial cells (or polar cushion cells). JG cells can sense decreases in systemic BP and secrete renin to activate the
renin-Thin limb of Henle’s loop Distal tubule
angiotensin system (RAS), leading to increased BP. The macula densa cells function as chemoreceptors; they sense changes in solute concentration and flow rate of the filtrate. When sodium concentration in the filtrate gets low, macula densa cells stimulate JG cells to release renin to retain more sodium and expel more potassium. The function of the extraglomerular mesangial cells, however, remains somewhat unknown. .
Figure 1-5. The JG apparatus (refs.[6],[7])
1.2 Pathological changes in kidney diseases
In the early stages of kidney disease, histological changes can vary because of many different causes. However, the pathological alterations of the kidneys at end-stage are similar: most glomeruli become sclerotic, and the affiliated tubular cells turn atrophic. Other commonly-observed characteristics are tubules with dilated lumens, tubulointerstitial fibrosis, scattered chronic inflammatory cell infiltrates, and tubules filled with pink casts (Figure 1-6) [8, 9]. Hypertension and renal ischaemia also affect the arteries in the kidneys, making them thick and narrowing their lumen.
Grossly, diseased kidneys are pale, small and bilaterally hard; cross-sectionally, the cortex is thinner. The boundary of the cortex and medulla is no longer as clear as in the normal condition. Additionally, the size of the kidneys in end-stage renal disease (ESRD) is smaller and the surface is granular with more or less scattered, shallow cortical scars (Figure 1-7)[10].
Figure 1-7. A: Normal kidney; B: ESRD (ref. [10])
1.3 Chronic kidney diseases (CKD) 1.3.1 CKD and GFR
Regardless of the cause, kidney damage and decreased function lasting longer than 3 months are called CKD [11], which is a progressive loss of renal function. Analyzing the GFR is the best way to measure the level of kidney function and to determine the stage of kidney disease progression. CKD can be divided into 5 stages based on the GFR, as shown in Table 1-1: the GFR decreases with increasing stage. According to the National Institute of Diabetes and Digestive and Kidney Diseases (NIDDK) [12], stage 5 CKD is also referred to as ESRD, wherein there is total or near-total loss of kidney function. Patients with stage 5 CKD need dialysis or kidney transplantation to survive. However, since the GFR tends to decline with age, it is necessary to take this into consideration when evaluating kidney function. The average estimated GFR for different age groups, according to the National Kidney Foundation, is given in Table 1-2[13].
Table 1-1.The 5 stages of chronic kidney disease (CKD) (ref. [12])
Stage Description GFR*
mL/min/1.73m2
1 Slight kidney damage with normal or increased filtration More than 90
2 Mild decrease in kidney function 60–89
3 Moderate decrease in kidney function 30–59
4 Severe decrease in kidney function 15–29
5 Kidney failure requiring dialysis or transplantation Less than 15
Table 1-2. Average estimated GFR by age (ref. [13])
1.3.2 Incidence, prevalence and causes of ESRD Incidence is defined as the number of newly-diagnosed patients in a
specific population during a given time period. Prevalence indicates the number of patients in a specific population at a given point. The incidence and prevalence of ESRD continue to grow worldwide. Globally, at the end of 2005, about 1,900,000 people were receiving renal replacement therapy (RRT), thoughprecise estimates of ESRD incidence and prevalence remain elusive due to incomplete registries of ESRD patients in international databases [14]. In the USA, for example, there were 104,364 new cases of ESRD in 2004 − equivalent to an annual incidence of 342 cases per million, according to the US Renal Data System 2006 annual report [15]. The prevalence of ESRD in the USA in 2003 was 494,471 (1,555 cases per million population). In comparison, based on data pooled from the European Renal Association-European Dialysis and Transplant Association Registry and the UK Renal Registry, the incidence of treated ESRD (based on the incidence of RRT) in 2004 ranged from 75 cases per million in
Age GFR 20-30 116 ml/min/1.73m2 30-40 107 ml/min/1.73m2 40-50 99 ml/min/1.73m2 50-60 93 ml/min/1.73m2 60-70 85 ml/min/1.73m2 70+ 75ml/min/1.73m2
Iceland to 195 cases per million in Greece. The prevalence of treated ESRD in 2004 ranged from about 479 cases per million in Iceland to 1,022 cases per million in Italy [15]. The NIDDK reported in 2007 that more than 450,000 Americans were undergoing treatment for ESRD in 2003. The major causes of ESRD are diabetes and high blood pressure. According to the American Diabetes Association (ADA), about half of all ESRD patients also have diabetes. The NIDDK asserted that diabetes and hypertension combined account for more than 60% of all ESRD cases, although there are other potential causes of ESRD, including other CKDs, heart failure and lupus. Patients with type 1 diabetes (T1D) may progress to ESRD within 5 to 10 years if they have chronic proteinuria. T1D patients are 12 times more likely to develop ESRD than type 2 diabetes (T2D) patients, according to the ADA. However, T2D is far more common and, therefore, produces more total cases of ESRD [17]. Other possible causes of kidney disease that may lead to ESRD are glomerulonephritis, vasculitis, interstitial nephritis and toxicity, etc. Figure 1-8 summarizes the causes of ESRD [16].
Figure 1-8. Causes of ESRD (ref.[16])
The Canadian Institute for Health Information (CIHI) reported in 2005 that from 1998 to 2002, the prevalence of ESRD in Canada increased 33%, while the incidence rose 17%; the incidence rate of ESRD was 153 per million. During this period, annual kidney transplants performed in Canada increased 2.5%. Expenditures on ESRD were about 1.2% of total health care costs. More precisely, the annual cost per ESRD patient is Cdn $55,466 [17].
1.4 Diabetes mellitus (DM)
1.4.1 Prevalence and cost of diabetes
In 2007, an estimated 246 million people worldwide were affected by diabetes. With a further 7 million people developing diabetes each year, that number is expected to hit 380 million by 2025 [18]. In the USA, 14.6 million people were diagnosed with diabetes in 2005; and it is believed that another 6.2 million diabetic patients were undiagnosed. Therefore, 20.8 million people, or about 7% of the American population, have diabetes[19]. According to the Canadian Diabetes Association (CDA), more than 2 million Canadians have diabetes. By the end of the decade, this number is expected to reach 3 million. Based on CDA data, diabetes and its complications cost the Canadian healthcare system an estimated $13.2 billion per year. By 2010, these costs are expected to rise to $15.6 billion a year and to $19.2 billion a year by 2020 (figure 1-9)[20].
Figure 1-9. Cost of diabetes and its complications in Canada (ref.[20])
1.4.2 Pathogenesis of diabetic complications
Diabetes is characterized by chronic hyperglycaemia and the development of microvascular and macrovascular pathologies. The microvascular complications of diabetes affect small blood vessels, including retinopathy, nephropathy and neuropathy. The central pathological mechanism in macrovascular disease is the process of atherosclerosis, which leads to narrowingof arterial walls throughout the body, evoking coronary heart disease, myocardial infarction, stroke, etc. Numerous researchers are working on the
mechanisms of hyperglycaemia-induced cell injury. Brownlee’s group summarized 4 main hypotheses on how hyperglycaemia produces diabetic complications [21]. They are: increased polyol pathway flux, augmented advanced glycation end-product (AGE) formation, activation of protein kinase C (PKC) isoforms; and increased hexosamine pathway flux [21].
(1) Increased polyol pathway flux
The polyol pathway was first described in peripheral nerves in 1966 [22]. In this pathway, aldose reductase (AR) plays a central role. AR normally reduces toxic aldehydes in cells to inactive alcohols. In the diabetic condition, glucose concentrations in cells become very high. AR also reduces glucose to sorbitol, which is later oxidized to fructose. In the process of reducing glucose to sorbitol, AR consumes the cofactor nicotinamide-adenine dinucleotide phosphate (NADPH). NADPH is also essential for regenerating a critical intracellular antioxidant: reduced glutathione (GSH). By reducing the amount of reduced GSH, the polyol pathway increases susceptibility to intracellular oxidative stress. Lee et al. reported previously that decreased GSH levels were found in the lenses of transgenic (Tg) mice that overexpress AR [23]. The indirect biochemical consequences of heightened sorbitol pathway activity include non-enzymatic glycation initiated by fructose, a glycating agent that is 10 times more potent than glucose [24], PKC activation, oxidative and nitrosative stress, and oxidative stress-mediated downstream events, such as activation of mitogen-activated protein kinases (MAPKs) and poly(ADP-ribose) polymerase (PARP) [25]. Two separate groups using different AR inhibitors demonstrated that its suppression in the nerve improved both nerve physiology and fibre density as well as function (Figure 1-10) [21] [26][27].
Figure 1-10. Aldose reductase (AR) and the polyol pathway (ref.[21])
(2) Increased intracellular formation of AGEs
Intracellular glucose elevation is the initiating event in the formation of both intracellular and extracellular AGEs [28]. AGEs are normally formed non-enzymatically by the interaction of carbonyl (aldehyde or ketone) groups of reducing sugars, such as glucose, and with lysine and N-terminal amino groups in a variety of proteins, lipids, and nucleic acids, which results in the formation of glycation products via the Maillard reaction. These go through further rearrangements and various reactive intermediate products, or AGE precursors, including the formation of α-dicarbonyls or oxoaldehydes. 3-Deoxyglucosone, glyoxal, and methylglyoxal are examples of α-dicarbonyls. They react with amino groups of intracellular and extracellular proteins to form AGEs, an heterogeneous class of stable and irreversible covalent adducts (Figure 1-11) [29]. Physiologically, AGE formation is part of the ageing process. It is thought that the physiological role of advanced glycation is to identify senescent proteins for degradation. Under high glucose ambience, AGE formation increases due to hyperglycaemia [30]. Among the many potential pathogenic factors responsible for the development of diabetic microvascular disease, the advanced glycation pathway is thought to be a pivotal process in mediating tissue damage. Serum and tissue AGE levels are correlated with the time-averaged concentration of
blood glucose and the severity of diabetic complications, including nephropathy and retinopathy. Glycoxidation products, a subclass of AGEs, such as N-(carboxymethyl) lysine (CML) and pentosidine, require both glycation and oxidation for their formation. In diabetic nephropathy (DN), CML and pentosidine accumulate in the expanded mesangial matrix and nodular lesions co-localizing with malondialdehyde-lysine, a lipoxidation product[31]. Schinzel et al confirmed the role of AGEs in diabetic micro- and macroangiopathy by immunohistochemistry showing that AGEs localized in the vascular wall. Both AGE precursors and AGEs alter the functional properties of some important intracellular molecules, such as proteins involved in gene regulation and extracellular molecules. By changing the signaling between the matrix and the cells, AGE precursors and AGEs elicit cellular dysfunction, disrupting normal cell-matrix contact and preventing the maintenance of tissue integrity [32].
Figure 1-11. Pathways of AGE formation (ref.[29])
Hyperglycaemia may also activate PKC isoforms indirectly via binding to AGE receptors. In a study by Thallas-Bonke et al., where streptozotocin (STZ)-induced diabetic rats were treated with ALT-711, an inhibitor of AGE accumulation, diabetes-evoked increases in PKC-α, -βI, -βII, and -ε isoforms were attenuated in association with decreased renal AGE accumulation.
ALT-711 also reduced the translocation of phosphorylated PKC-α from the cytoplasm to the membrane. ALT-711 treatment suppressed the expression of vascular endothelial growth factor and the ECM proteins fibronectin and laminin, in association with diminished albuminuria. These findings implicate AGEs as important stimuli of PKC activation, particularly PKC-α, in diabetic kidneys [33].
(3) PKC Activation
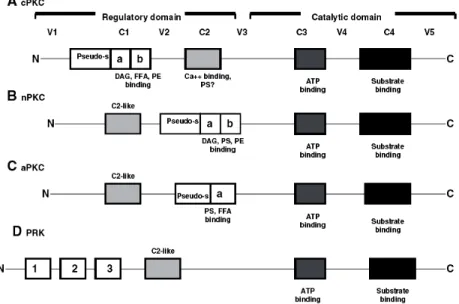
Among various kinases, PKCs are one of the most extensively studied. PKCs are a family of serine/threonine kinases that comprises 13 isoforms, which can be categorized into 3 groups based on their mode of activation [34]. The group of classical or conventional PKCs (cPKC) consists of the α, βI, βII and γ isoforms, all of which depend on calcium, diacylglycerol (DAG) or its analogue phorbol 12-myristate 13-acetate, and in most cases phosphatidyl serine (PS) for activation. The isoforms that are independent of calcium, but require DAG and PS are classified as the new PKCs (nPKCs), and include the subtypes δ, ε, η, and υ. Isoforms ζ, ι, λ and µ constitute the third group of PKCs, called the atypical PKC (aPKC). Their activation does not require calcium or DAG, only PS. However, PKCs are incapable of activation by DAG and other co-factors unless they are post-translationally or co-translationally phosphorylated. Thus, PKCs are regulated by 2 sequential and equally critical mechanisms: phosphorylation and binding to DAG and/or other co-factors. Each mechanism regulates the structure, subcellular localization and function of PKC [35]. Figure 1-12 is a simple summary of PKC subtypes [36].
Figure 1-12. Protein architecture and cofactor requirements of various subfamilies of protein kinase C (PKC): all PKC subfamilies, and so all isoforms, contain a regulatory and a catalytic domain. These consist of 4 conserved regions (C1–C4) and 5 variable regions (V1–V5). As can be seen by the differences in protein architecture and cofactor requirements, the inclusion of the PRK (D) as a true subfamily of PKC is controversial. cPKC, conventional PKC; nPKC, new PKC; aPKC, atypical PKC; PRK, protein kinase C regulatory kinase; DAG, diacylglycerol; FFA, free fatty acids; PS, phosphatidyl serine; PE, phorbol ester; pseudo-s, pseudo-substrate; Ca ++ , calcium; ATP, adenosine triphosphate. The cysteine-rich zinc finger regions C1a and C1b are indicated with a and b. (ref. [36])
Many studies have reported that total DAG levels in vascular tissues, such as the retina, heart and renal glomeruli [37] [38] [39] are increased in diabetes. DAG levels can be augmented in the diabetic state through multiple pathways, and subsequently PKC is activated by DAG. Furthermore, the DAG-PKC pathway can be activated by hyperglycaemia-induced elevations of reactive oxygen species (ROS), such as hydrogen peroxide (H2O2) which can activate PKC either directly or by increasing DAG production [40, 41]. Multiple diabetic complications have been associated with heightened PKC activation (Figure 1-13)[42]. Increased ECM deposition is a common characteristic of DN, which is due to overexpression of ECM collagen, fibronectin and laminin [43]. High-glucose levels stimulate collagen IV transcription in mesangial cells in vitro. Similarly, PKC agonists stimulate type IV collagen expression [44] and fibronectin accumulation in cultured mesangial cells [45] and PKC inhibitors down-regulated their expression. These results suggest the importance of PKC
activation in the basement membrane remodeling process in the presence of hyperglycaemia.
Figure 1-13. Physiological effects and cellular mechanisms of DAG–PKC activation induced hyperglycaemia (ref.[42])
Among various fibrotic factors, transforming growth factor-β1 (TGF-β1) and connective tissue growth factor (CTGF) play key roles in the development of basement membrane thickening and increased ECM in DM [46]. Both CTGF and TGF-β1 can stimulate the production of type IV collagen, fibronectin and laminin in cultured mesangial cells and glomerular epithelial cells[47, 48], contributing to ECM accumulation. It is suggested that PKC activation may be involved in glucose-induced elevation of CTGF and TGF-β1 expression [49]. Therefore, PKC activation in the hyperglycaemic condition could be responsible for heightened levels of matrix protein synthesis mediated either directly or indirectly by stimulating the expression of TGF-β1 and CTGF. Augmented basement membrane levels could partially cause the vascular dysfunction and proteinuria seen in nephropathy. Several studies have demonstrated that PKC activation can directly increase the permeability of macromolecules[50, 51] across the endothelial or epithelial barriers.
To summarize, activated PKC has a variety of effects on gene expression: some genes that are essential for normal function are decreased; whereas others that are detrimental to cells are elevated [52-54].
(4) Hexosamine pathway flux
When intracellular glucose is high, it is metabolized through glycolysis, going first to glucose-6 phosphate, then to fructose-6 phosphate, and enters the glycolytic pathway. However, some fructose-6 phosphate is converted to glucosamine-6 phosphate and finally, to UDP (uridine diphosphate) N-acetyl glucosamine by GFAT (glutamine: fructose-6 phosphate amidotransferase). Intracellular glycosylation by the addition of GlcNAc to serine and threonine is catalyzed by the enzyme O-GlcNAc transferase. Glycosylated serine and threonine can then bind to transcription factors, such as Sp-1 and augment the synthesis of factors such as TGF-β1 and plasminogen activator inhibitor-1 (PAI-1), both of which are detrimental to blood vessels [55]. The hexosamine pathway generating toxic metabolites is another mechanism by which hyperglycaemia can induce cell damage. However, its role remains to be fully elucidated and the clinical applicability of these findings has been limited by a lack of specific orally-active agents targeting this pathway (Figure 1-14) [21].
A unified mechanism
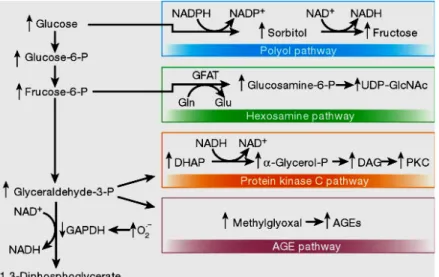
Although data support the above mentioned hypotheses, no apparent common element has linked these mechanisms to each other until several years ago. Moreover, clinical trials inhibiting these pathways in patients were not satisfactory. In recent years, it is hypothesized that all of these mechanisms are linked to a common upstream event and that failure to block all of the downstream pathways could explain the unsatisfactory clinical trials with single-pathway inhibitors. In 2000, 2 separate groups confirmed that the common element linking hyperglycaemia-induced damage is the overproduction of superoxide by the mitent linking these mechanisms to each other until several years ago. Superoxide activates the 4 damaging pathways mentioned by inhibiting glyceraldehyde 3-phosphate dehydrogenase (GAPDH) [41, 55]. Soon after, Du et al. reported that GAPDH was inhibited through the activation of poly(ADP ribose) polymerase [56]. Figure 1-15 demonstrates the 4 mechanisms linked by the common element: superoxide [21].
Figure 1-15. Mitochondrial overproduction of superoxide activates 4 major pathways of hyperglycaemic damage by inhibiting GAPDH (ref.[21]).
1.4.3 ROS and oxidative stress
Molecular oxygen (O2) is essential for all aerobic organisms. Primarily in the mitochondria, aerobic energy metabolism is dependent on oxidative phosphorylation, by which the oxidoreduction energy of mitochondrial electron
transport is converted to the high-energy phosphate bond of ATP. O2 serves as the final electron acceptor for cytochrome-c oxidase which catalyzes O2 to H2O. During these electron transfer reactions, partially reduced and highly reactive metabolites of O2 may be formed. These O2 metabolites include superoxide anion and H2O2. In the presence of transition metal ions, even more reactive hydroxyl radicals may be generated. These partially reduced metabolites of O2 are often referred to as ROS because of their higher reactivities relative to molecular O2 [57] (Figure 1-16).
Figure 1-16. Production of superoxide by the mitochondrial electron transport chain (ref.[21])
Under certain conditions, superoxide anion can react with nitric oxide (NO) to produce significant amounts of a much more oxidatively-active molecule, peroxynitrite anion (ONOO-), which is a potent oxidizing agent: NO• + O2•−→ ONOO− [58]. Indeed, all phagocytes have a well-characterized superoxide anion-generating plasma membrane oxidase, which is capable of producing large amounts of ROS required in host defense. ROS generated in nonphagocytic cells have been traditionally regarded as toxic by-products of metabolism because of their potential to damage lipids, to oxidize proteins, and to mutate and cleave DNA [59]. Besides mitochondria, the endoplasmic reticulum (ER), peroxisomes and NADPH oxidase are also sources of ROS production. A variety of cytokines and growth factors that bind receptors of different classes have been reported to generateROS in nonphagocytic cells as well, though not all functional or pathophysiological effects have been elucidated [57]. Several antioxidant enzymes, such as superoxide dismutase, which reduce
superoxide anion to H2O2, and catalase and glutathione peroxidise, which reduce H2O2 to H2O, can protect against the potentially-damaging effects of ROS (figure 1-17) [60]. In addition, non-enzymatic free radical scavengers, vitamin E, vitamin C and glutathione play a critical role in cellular redox balance. Oxidative stress will occur if there is an imbalance between oxidant production and the capacity of the cells to prevent oxidative injury.
Figure 1-17. Relevant sites of production of ROS and antioxidant systems in a generic cell type (ref.[60])
Oxidative stress is detrimental to cell structures, nucleic acids, lipids and proteins. Hydroxyl radical can react with all components of the DNA molecule, damaging both purine and pyrimidine bases as well as the deoxyribose backbone. 8-OHdG formation is a typical example of a DNA lesion by oxidative stress [61]. Permanent modification of genetic material by ROS could be the first step involved in mutagenesis, carcinogenesis, and other pathological processes, including diabetes. Polyunsaturated fatty acid residues of phospholipids, which are extremely sensitive to oxidation, are another target of ROS generation. 4-Hydroxynonenal, a weak mutagen, appears to be the major toxic product of lipid peroxidation [62]. However, proteins vary significantly in their susceptibility to oxidative damage, for example, intact proteins are less sensitive to oxidation than misfolded proteins. Oxidative modifications of proteins heighten their susceptibility to proteolytic attack. Proteolysis is estimated to increase more than 10-fold after exposure to superoxide radical or H2O2[63]. Based on Stadtman’s
finding, the side-chains of all amino acid residues of proteins, particularly cysteine and methionine, are susceptible to oxidation of ROS [64]. Oxidation of cysteine residues may result in the reversible formation of mixed disulphides between protein thiol groups (–SH) and low molecular weight thiols, especially GSH (S-glutathiolation). A variety of stress-sensitive intracellular signaling pathways such as nuclear factore-κB (NF-κB), p38 MAPK, c-Junamino-terminal kinase/ stress-activated protein kinase (JNK/SAPK), hexosamine and others, can be activated, resulting in the increased expression of numerous gene products that may cause cellular damage and thus play a major role in the etiology of diseases [60].
1.5 Diabetic nephropathy (DN)
DN, a common diabetic complication, is a clinical syndrome characterized by progressive renal insufficiency in the setting of hyperglycaemia, persistent albuminuria (microalbuminuria > 30mg/24h, clinical albuminuria > 300mg/24h), hypertension, decreased GFR and a highly-elevated risk of cardiovascular morbidity and mortality [65]. The earliest morphological change of DN is expansion of the mesangial area [66], which is caused by elevated ECM deposition and mesangial cell hypertrophy. GBM thickening is another early histological finding that is already apparent 1 year after the onset of T1D [67]. Moreover, GBM thickening is progressive over years; augmented ECM synthesis and impaired removal contribute to GBM thickening. In the diabetic condition, α1 (IV) and α2 (IV) chains are up-regulated in mesangial cells, whereas α3 (IV) and α4 (IV) expression is increased in the GBM [68]. Deposition of collagen type I and III in the mesangial area occurs late in glomerulosclerosis and is not an early event [69]. In the late stage of DN, glomerulosclerosis, vascular diseases and changes of the tubulointerstitial architecture with tubular atrophy and interstitial fibrosis have all been discerned [66] [70] [71] [72] [73]. Since the original description by Kimmelstiel and Wilson, nodular glomerulosclerosis has been considered as a hallmark of DN [70]. Figure 1-18 shows some typical morphological changes in DN [74][10].
After 20 years of diabetes duration, around 30% of T1D patients develop DN. Over 5% of newly diagnosed T2D patients already have renal dysfunction. Another 25-40% of T2D patients will develop DN after 25 years of diabetes; they will also manifest a high tendency to progress to ESRD.This difference is based on the fact that T2D can remain undiagnosed for long periods. Several studies have indicated genetic predisposition to DN, and epidemiological investigations confirm that the prevalence of DN depends on ethnic background. Siblings of T1D patients with DN have a higher risk of DN [75]. The relatives of T2D dialysis patients are 5 times more likely to develop ESRD than the relatives of T2D patients without nephropathy [76]. Caucasians of European origin demonstrate the lowest prevalence [77].
Figure 1-18. A1: Normal GBM, A2: GBM thickening in diabetes B: Mesangial matrix expansion and sclerosis in a diabetic glomerulus (refs.[74], [10])
1.5.1 Pathogenesis of DN
Although the pathogenesis of DN is not completely understood, several factors are closely relevant to DN. The major factors of hyperglycaemia-induced cell damage have been discussed previously. Briefly, they are: (1) increased formation of AGEs; (2) PKC activation; (3) heightened activity of growth factors; (4) augmented ROS formation; (5) activation of cytokines (e.g. angiotensin II or AngII); (6) enhanced activity of the AR pathway; and (7) decreased glycosaminoglycan content in basement membranes. The relationship of these major factors to the development of DN is discussed below.
1.5.1.1 AGEs and DN
The kidney is a target of AGE-mediated damage. It also contributes to increasing the circulation of AGE concentrations via a decline of renal function,
B
i.e. the clearance of AGEs [78]. Clinical studies in patients with diabetes have demonstrated that serum levels of AGEs are significantly augmented with progression to microalbuminuria and, subsequently, to overt nephropathy [79]. Makita et al. found an elevation of circulating AGE peptides, which correlated with the severity of renal impairment in both T1D and T2D patients [80]. Tanji et al. reported that DN patients had increased podocyte receptors for AGE (RAGE) expression, and DN severity was correlated with the extent of AGE formation in the glomerular and tubulointerstitial compartments [81]. Animal studies have provided further evidence that AGEs correlate with DN. Diabetic animals manifest significant increases of renal AGEs, as assayed by a range of techniques [82]. Pathological changes in the diabetic kidney are reduced with AGE formation inhibitors or other approaches to diminish AGE accumulation, such as cross-link breakers [83, 84]. Demonstrated by Vlassara et al., AGEs caused kidney damage similar to that seen in DN: elevated renal AGE content and glomerular volume, GBM thickening, mesangial matrix expansion, NF-κB activation, heightened collagen IV and TGF-β mRNA expression [85]. Soulis-Liparota et al. similarly demonstrated the effect of AGEs mediating renal injury in the diabetic condition in animal studies with non-specific AGE formation inhibitors to ameliorate both the structural and functional features of experimental DN without directly influencing glycaemic control [86].Since then, numerous experiments have supported and extended these findings [87]. The detrimental effects of AGEs on the kidney appear to occur through their interaction with specific RAGEs and binding proteins.
AGEs can interact with multiple pathways, such as inflammatory, oxidative, metabolic, and haemodynamic pathways. These diverse interactions appear to occur mainly through multiligand RAGE, a member of the immunoglobulin superfamily of cell surface molecules [88, 89] and the best characterized signal transduction receptor for AGEs. RAGE is highly expressed by a number of cells whose function is perturbed in diabetes [89]. These receptors are present on various renal cell types, including PTCs, mesangial cells, and podocytes [90] [91] [92] [93]. Numerous studies have implicated
RAGEs in the development and progression of DN [94, 95]. In Tg mice overexpressing the RAGE gene in vascular cells, Yamamoto et al found an accelerated rate of renal damage after the induction of diabetes. The changes they observed included: elevation of albuminuria and serum creatinine levels, mesangial expansion, and advanced glomerulosclerosis [96]. Consistently, diabetic RAGE knockout (KO) mice induced by STZ showed less renal injury compared to diabetic wild-type mice.In particular, these RAGE KO mice did not present significant mesangial expansion or GBM thickening [93]. Table 1-3 is a simple summary of AGE effects on DN.
Table 1-3. Effects of AGEs that potentially contribute to DN (ref.[97])
1.5.1.2 PKC and DN
PKC seems to be a centerpiece in the pathogenesis of DN. The importance of PKC isozyme activation in the diabetic milieu initiating early DN was first identified by Ishii et al. [39]. They discovered that when the PKC-β inhibitor LY-333531 was administered orally to STZ-induced diabetic rats, not only did it prevent an elevated GFR, an increased albumin excretion rate, and augmented retinal circulation time, but it also led to the mRNA overexpression of glomerular TGF-β1 and ECM proteins [39][52]. They observed a similar effect in db/db mice, a T2D animal model. LY-333531 also prevented progressive mesangial expansion [98]. Cohen et al. discerned that glycated albumin stimulated mesangial cell PKC-β activity, which is linked to the increased
expression of collagen IV [99]. Stimulation of MAPKs, particularly extracellular signal-regulated kinase (ERK)1/2 after PKC activation, is necessary for mesangial cell growth and enhanced gene expression of growth factors and ECM proteins [44, 100]. In both mesangial cells cultured in high glucose [101, 102] and glomeruli isolated from STZ-induced diabetic rats[103], ERK1/2 activity was significantly higher than in normal glucose controls and was PKC-dependent, although protein expression remained unchanged. It was further determined that high glucose-enhanced mesangial cell TGF-β1 and ECM protein expression was mediated through ERK1/2 [100]. In cultured rat mesangial cells, Ha and Lee found that high glucose generates H2O2 within 1 hour and inhibition of PKC blocks high glucose or H2O2-induced TGF-β1 and fibronectin mRNA expression and protein synthesis [104]. These data imply that ROS generated under high glucose conditions directly or indirectly stimulates PKC. One mechanism for direct activation of PKC by ROS is through redox changes in sulfhydryl groups on PKC isoform cysteine-rich regions. These redox changes may also cause PKC isozymes to be more responsive to DAG activation during signal transduction[105]. These results suggest that stimulated PKC isozymes have multiple functions in the signaling cascades leading to collagen IV expression and ECM accumulation, and basal PKC-β activities are required for the high-glucose-enhanced mesangial cell expression of ECM protein, contributing to diabetic glomerulosclerosis and tubulointerstitial fibrosis.
1.5.1.3 TGF-β and DN
TGF-β signaling is activated by a large number of mediators that have been identified to induce renal injury in DN. AGEs, ROS, DAG, PKC and AngII are able to activate TGF-β signaling [106] [107]. TGF-β is recognized as the major cytokine responsible for the ECM pathobiology seen in DN and perhaps plays the most crucial role in DN pathogenesis [108]. The TGF-β 1, 2 and 3 isoforms are prototypes of the TGF-β superfamily that exert multiple effects and consist of dimeric proteins with conserved structures. When TGF-β binds to its type II receptor, it trans-phosphorylates type I serine/threonine kinase receptors. The
![Figure 1-3B. Reabsorption of glucose and amino acids by proximal convoluted tubules (ref.[4])](https://thumb-eu.123doks.com/thumbv2/123doknet/2170797.10071/29.918.307.613.723.988/figure-reabsorption-glucose-amino-acids-proximal-convoluted-tubules.webp)
![Figure 1-5. The JG apparatus (refs.[6], [7])](https://thumb-eu.123doks.com/thumbv2/123doknet/2170797.10071/31.918.261.754.305.513/figure-jg-apparatus-refs.webp)
![Figure 1-7. A: Normal kidney; B: ESRD (ref. [10])](https://thumb-eu.123doks.com/thumbv2/123doknet/2170797.10071/32.918.180.766.288.487/figure-normal-kidney-b-esrd-ref.webp)

![Figure 1-16. Production of superoxide by the mitochondrial electron transport chain (ref.[21])](https://thumb-eu.123doks.com/thumbv2/123doknet/2170797.10071/44.918.298.642.365.585/figure-production-superoxide-mitochondrial-electron-transport-chain-ref.webp)
![Figure 1-17. Relevant sites of production of ROS and antioxidant systems in a generic cell type (ref.[60])](https://thumb-eu.123doks.com/thumbv2/123doknet/2170797.10071/45.918.287.678.303.587/figure-relevant-sites-production-ros-antioxidant-systems-generic.webp)

![Figure 1-20. Molecular mechanisms of DN (ref. [118] )](https://thumb-eu.123doks.com/thumbv2/123doknet/2170797.10071/52.918.261.744.214.482/figure-molecular-mechanisms-dn-ref.webp)
