Publisher’s version / Version de l'éditeur:
Publication - International Association of Scientific Hydrology, 54, pp. 288-294,
1961-08-01
READ THESE TERMS AND CONDITIONS CAREFULLY BEFORE USING THIS WEBSITE. https://nrc-publications.canada.ca/eng/copyright
Vous avez des questions? Nous pouvons vous aider. Pour communiquer directement avec un auteur, consultez la
première page de la revue dans laquelle son article a été publié afin de trouver ses coordonnées. Si vous n’arrivez pas à les repérer, communiquez avec nous à [email protected].
Questions? Contact the NRC Publications Archive team at
[email protected]. If you wish to email the authors directly, please see the first page of the publication for their contact information.
NRC Publications Archive
Archives des publications du CNRC
This publication could be one of several versions: author’s original, accepted manuscript or the publisher’s version. / La version de cette publication peut être l’une des suivantes : la version prépublication de l’auteur, la version acceptée du manuscrit ou la version de l’éditeur.
Access and use of this website and the material on it are subject to the Terms and Conditions set forth at
Energy balance during the snow melt period at an Ottawa site
Gold, L. W.; Williams, G. P.
https://publications-cnrc.canada.ca/fra/droits
L’accès à ce site Web et l’utilisation de son contenu sont assujettis aux conditions présentées dans le site LISEZ CES CONDITIONS ATTENTIVEMENT AVANT D’UTILISER CE SITE WEB.
NRC Publications Record / Notice d'Archives des publications de CNRC:
https://nrc-publications.canada.ca/eng/view/object/?id=ac6a2089-209a-4759-8361-115702791fe7
https://publications-cnrc.canada.ca/fra/voir/objet/?id=ac6a2089-209a-4759-8361-115702791fe7
Ser
TH1
N2lr2
no. 1 3 1
c . 2
NATIONAL
RESEARCH
COUNCIL
C A N A D A
DIVISION O F BUILDING RESEARCH
I
ENERGY BALANCE DURING THE SNOW MELT PERIOD AT
AN OTTAWA SITE
P R I C E 10 C E N T S
BY
L. W. GOLD AND G. P. WILLIAMS
REPRINTED FROM
INTERNATIONAL ASSOCIATION O F SCIENTIFIC HYDROLOGY PUBLICATION N O . 5 4 . P. 2 8 8 - 2 9 4 R E S E A R C H P A P E R NO O F THE DIVISION OF BUILDING 1 3 1 RESEARCH OTTAWA AUGUST 1 9 6 1 9
- ,
3 i , N R C 6 2 8 3T h i s p u b l i c a t i o n i s being d i s t r i b u t e d by t h e D i v i s i o n of B u i l d i n g R e s e a r c h of t h e N a t i o n a l R e s e a r c h C o u n c i l . It s h o u l d n o t be r e p r o d u c e d i n w h o l e o r i n p a r t , without p e r m i s - s i o n of t h e o r i g i n a l p u b l i s h e r . T h e D i v i s i o n would b e g l a d to be of a s s i s t a n c e i n o b t a i n i n g s u c h p e r m i s s i o n . P u b l i c a t i o n s of the D i v i s i o n of B u i l d i n g R e s e a r c h m a y b e o b t a i n e d by m a i l i n g the a p p r o p r i a t e r e m i t t a n c e , ( a B a n k , E x p r e s s , o r P o s t O f f i c e M3ney O r d e r o r a cheque m a d e p a y - a b l e a t p a r in O t t a w a , to t h e R e c e i v e r G e n e r a l of C a n a d a , c r e d i t N a t i o n a l R e s e a r c h Council) t o t h e N a t i o n a l R e s e a r c h Council, O t t a w a . S t a m p s a r e not a c c e p t a b l e . A c o u p o n s y s t e m h a s been i n t r o d u c e d to m a k e p a y - m e n t s f o r p u b l i c a t i o n s r e l a t i v e l y s i m p l e . Cgupons a r e a v a i l - a b l e i n d e n o m i n a t i o n s of 5, 25 and 50 c e n t s , and m a y be o b - t a i n e d b y m a k i n g a r e m i t t a n c e a s i n d i c a t e d above. T h e s e coupons m a y be u s e d f o r t h e p u r c h a s e of a l l N a t i o n a l R e s e a r c h C o u n c i l p u b l i c a t i o n s i n c l u d i n g s p e c i f i c a t i o n s of t h e C a n a d i a n G o v e r n m e n t S p e c i f i c a t i o n s B o a r d .
Extrnct of prrblicntioiz no. 51 of the I . A . S . H. Stlolv nrrti ice cominissiorz, pp. 288-294
--
ENERGY BALANCE DURING THE SNOW MELT
PERIOD AT AN OTTAWA SITE
L.W. GOLD*
andG.P.
WILLIAMS*
Observations were made on the energy balance at the surface of a melting snow cover for a two-week period in the spring of 1959 at Ottawa, Canada. The net radia- tion was found to contribute over this period 2305 cal/cm3, a n d convection 785 cal/cm2. Of this heat, 2290 cal/cm2 were used for evaporation and 800 cal/cm3 for melting. The water equivalent of the snow cover lost was 13.4 cm and of this, 3.4 c m is estimated to have evaporated. The observations are discussed in relation to climatic factors and similar studies carried out in other regions.
On a effectue des releves relat~fs a u bilan energet~que tel qu'on le trouve a la surface d'une couverture de neige en tram de fondre. Les releves ont ete effectues durant une periode d e deux semaines, a u printemps de 1959, a Ottawa, Canada. Au cours d e cette periode le rayonnement a donne 2305 cal/cm2 et la convection 785 cal/cm2. Toute cette chaleur a servl a I'evaporation qui a pris 2290 cal/cm%t B la fonte des neiges, laquelle a pris 800 cal/cm2. On a estime que 1'6quivalent en eau de la couverture fondue a ete d e 13.4 cm et que sur ce chiffre 3.4 cm d'eau s'est eva- porie. On analyse les releves en fonction de facteurs climatiques et d'etudes sem- blables effectuees dans d'autres regions.
I n the spring of 1959, observations were made at a site in Ottawa, Canada, (latitude 450 24' N, longitude 7S041' W, elevation 103 metres (339 feet) above mean sea level) o n the energy exchange at the snow surface during two weeks of the snow melt period. The purpose of the observations was to estimate, for the weather condi- tions that occurred, the amount of energy associated with each component of the energy exchange and to determine the evaporative and convective heat transfer coef- ficients as defined by an empirical equation similar to that used in the Lake Hefner studies (1). The site chosen for the observations was a treeless level field, 300 metres
by 91 metres (1000 feet by 300 feel), with low buildings located along three of its sides and open to the west.
The energy balance at the snow surface for the two-week period is given by:
where Q, = net radiation, cal/cm2
Qs = snow melt component, cal/cm2 Qc = evaporative component, cal/cm2 Qc = convective component, cal/cm2
Q, was obtained by direct measurement. A first estimate of Qs was obtained from measurements of the change in the depth and average density of the snow cover. From this, the weight of snow per unit area remaining after each day
*
Snow and Ice Section, Division of Building Research, National Research Council, Ottawa, Canada.could be calculated. T o calculate Q e and Q c , the following equations were assumed valid:
(2) q e = Ice uz (em - e8)
(3) sc = k c UZ (Ta - Ts)
where qe = evaporative heat transfer, cal/cm2 hr
q, = convective heat transfer, cal/cm2 hr Uz = wind speed at 2-meter level, cm/hr e, = vapor pressure of the air, mmHg e, = vapor pressure at the snow surface, mmHg
T, = temperature of the airmeasured in a Stevenson's screen, o C Ts = temperature of the snow surface, OC
Ice = evaporative heat transfer coefficient
kc = convective heat transfer coefficient. It was assumed also that Bowens ratio
c2)
was valid. P is the atmospheric pressure in millibars.The average atmospheric pressure at Ottawa is very close to 1000 millibars. Since pressure fluctuations during the obser- vation period were less than 2 per cent of the atmospheric pressure, the pressure correction was neglected. Therefore, combining Equations (2), (3), and (4) and neglecting the pressure correction, gives
The convective and evaporative heat loss for the two-week period is given by
Substituting in Equation (I) gives
(6) Q,
+
Qs = -Ice{
c u z ( e , - es)+
0.462
Liz(Ta-Ts))The net radiation was measured with a Schulze radiometer. This instrument was calibrated for short wave radiation by comparison with an Eppley pyroheliometer. A cone, whose inside surface was painted with a flat black paint and whose surface temperature could be accurately controlled, was used to calibrate the radio- meter in the long wave region. Some difficulties were encountered in the calibration of the instrument and in its use during observation. It is estimated that Q, is accurate to within f I0 per cent.
The wind speed was measured with a cup anemometer mounted at the two metre level. The air temperature was measured and recorded continuousIy with a ventilated thermocouple mounted 120 cm above the ground in a Stevenson screen. The vapor pressure of the air was obtained from the hourly readings of the wet and dry bulb temperature taken by the Meteorological Service of Canada at Rockcliffe Airport, about I600 meters (one mile) from the observation site.
The temperatures at various levels in the snow cover were measured and recorded every 20 minutes with thermocouples connected to a Leeds and Northrup recorder.
The snow surface temperature was obtained by plotting these ten~peratures against depth and extrapolating to the surface. One thelmocouple was usually located at the surface or very close to it. In the morning, the temperature of the surface usually rose very quickly to O°C which helped to relieve the difficulty of determining the snow surface temperature when the thermometer was exposed to short wave radiation. The vapor pressure at the snow surface was assumed to be equal to that in equilibrium with a plane ice surface at the same temperature a s the snow surface.
The period over which the energy balance was obtained was from 0000 hours 17 March to 2400 hours 30 March. The temperatures, T, and T, were plotted against time on one graph and the vapor pressures em and es on a second. The area enclosed by the T,, T, and e,, e, curves during periods of time when the wind speed did not change by more than 44.7 cm/sec (I mph) was obtained with a planimeter. This area was converted t o OC-hr or mmHg-hr and the resulting value multiplied by the appropriate mean wind speed for the period. These values were then summed over the total observation period and yielded Uz(Ta - T,) and U2(en - es).
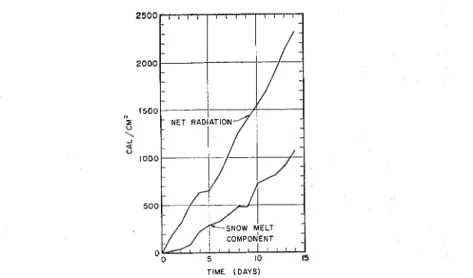
In Fig. 1, the accumulated net radiation and weight loss of the snow cover are plotted against time. As a first approximation, it was assumed that all the snow was melted and so a value for Q, was obtained. Using the observed values for Q,, Q,,
U2(Tn - Ts) and U2(ea - e,), k , was calculated from Equation (6). Using this value for kc, a first approximation to the heat used in evaporating snow was obtained. The weight of snow evaporated was then deducted from the total weight and a new value for Q, found. A new value for k , was calculated using Equation (6). This procedure was continued until a change of less than 1 per cent in the previous value of k, was obtained using the corrected Q,. Equation (5) was used to obtain kc.
TIME ( D A Y S )
Fig. 1 - Integrated net radiation and snow melt component.
The observed value for k , and kc over the two-week period a n d the measured o r calculated components of the energy balance are given in Table 1.
TABLE 1
The compo,re,rfs of rlre errerg.11 excl~nrrge rrrensrrred or co/crrlntedfor //re 2-week period
0000 llolrrs, 17 Mnrcll fo 2400 l ~ o r u : ~ , 30 Murclr.
Qr, net radiation
Q s , snow melt component
Q,, evaporative component Qe, convective component
0 2 (e, - es)
UZ (T(L - Ts) Ice
kc
In carrying out a study such as this, the possible errors that may arise in the observations, assumptions, and associated calculations become increasingly apparent. I t is of value to review briefly the possible errors that may occur.
With sufficient care, it should be possible to measure net radiation t o within f 5 per cent with instruments now available. In the present study, it is believed that the net radiation measurements were accurate to within f 10 percent. The measure- ment and recording of the wind speed and the relative humidity and temperature of air inside a suitable screen a given distance above the snow surface presents no real difficulty. The present observations are considered to be accurate t o f 5 per cent.
The measurement and recording of the snow surface temperature presents a real problem. In the present study this was estimated by extrapolation of temperatures measured within the cover. Such a procedure is satisfactory at night but becomes questionable in the daytime when the temperature-measuring instruments are exposed to incoming short wave radiation. I f t h e cover is actively melting, then the assumption that the surface is at O°C, as was made in the present study, cannot be strictly valid as the heat required to melt the ice must pass through a film of water on the ice surface. Therefore, the air-water interface must be somewhat above O°C. The authors are not aware of any studies that have been made that show if this effect would be significant. It is acknowledged that the estimate of the snow surface temperature, and therefore of the vapor pressure at the snow surface, are probably the largest source of error in the present study. Using the figures given in Table 1, the average difference between the shielded air temperature and the snow surface temperature is calculated to be 0.83OC. It is believed that this value is reasonable for the weather conditions that prevailed.
A number of theoretical equations for calculating the convective and evaporative components of the heat flow are available in the literature. Some of these require detailed and careful measurement of the temperature a n d vapor pressure gradient in the free air stream. Such measurements are often impractical for many fieldapplications. Studies such a s those done on Lake Hefner (I) and by the co-operative Snow Investi- gations Group ( 3 ) have indicated which of the proposed formulae are probably most accurate, but they also show that from the practical point of view, equations such as
(2), ( 3 ) , and ( 4 ) are normally adequate. Priestley (4) discusses the different approaches for calculating theconvective and evaporative heat flows and states that for a saturated surface, equations such as ( 2 ) are convenient for estimating evaporation and that the assumption contained in Equation ( 5 ) is probably satisfactory.
Measurement of the water equivalent of the snow cover does not present any real difficulty. The snow cover depth and average density vary with position and to sufficient observations must be made to ensure a statistically valid average. The information used in this study was the total weight of snow that has melted o r evapo- rated over the two-week period and it is believed that the daily observations that were made determine this weight to f 5 per cent.
The water equivalent of the snow that was lost was observed to be 13.4cm and of this, 3.4 was calculated as evaporation loss and the remainder runoff. Attempts were made to measure the amount of evaporation using white aluminum pans and a technique described in a paper by Williams (5). One of the difficulties encountered was that during the daytime, the pan contained a mixture of snow and water and thus presented to the air a surface which differed from that of the surrounding snow cover. The observations were not continuous but those made show an evaporation loss less than that obtained by the preceding analysis. The observed evaporation would indicate that the calculated heat gain by convection is too high. If it is assumed that the convective heat gain is zero, then the calculated evaporation is 2.1 cm of water and this agrees favorably with what was obs-rved. The value for the evaporative coefficient under these conditions is found to be 4.8 x cal/cm3 mmHg.
For a saturated surface, it is convenient to define a n evaporative coefficient by the following equation from Priestley (4),
1 . 1 1 qeT
CE =
ff3 (e, - e,)
where T is the temperature in O Kelvin, and
CE is a dimensionless constant Substituting for q, from Equation (2) gives
C E = 1.11 T k ,
Assuming T = 2650K, CE is found from the present observations to be 0.0023 for
Ice = 7.9
x
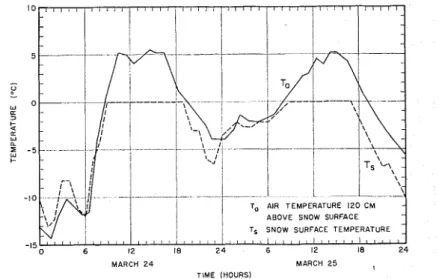
10-6. There is some justification for assuming CE to be equal to the drag coefficient used in momentum transfer calculations. Deacon found the drag coefficient over smooth snow o n short grass to be 0.0012 and for a snow surface on natural prairie to be 0.0028 (4). Using k , = 4.8 X gives CE a value of 0.0013. Since the surface of a melting snow cover is probably rougher than that of smooth snow o n a short grass field, the higher values of CE, and kc, are indicated. A difference in surface roughness could account for the difference between the observed and calculated evaporative loss.Accepting the results in Table 1 as giving a reasonable picture of the energy balance, it is of interest to consider some of the factors that affect this balance. Under the temperate conditions that existed at Ottawa during the period of obser- vations, the snow cover disappeared when the weekly mean air temperature was about O°C. Figures 2 and 3, showing the difference between the air and snow tempera- tures and the associated vapor pressure differences for two of the days of observation, are typical for this period. For part of the time, the snow surface temperature was a t its maximum of OOC and the vapor pressure at its maximum of 4.58 mmHg. If the snow surface temperature and vapor pressure had not been limited in this way, as is the case for temperatures below O°C, then the convective heat gain would have been less and the evaporation would have increased. Therefore, in regions of shallow snow cover, such as are found in the Canadian Arctic or Prairies, much of the cover can be lost by evaporation before the snow melt begins. Under such conditions, the heat lost by evaporation over a three or four day period would be very nearly equal to the net radiative gain less the change in heat content of the snow and ground.
On the other hand, if the snow cover can persist for some time after the snow melt has begun, for example as snow fields on north slopes, glaciers, or ice caps, then
MARCH 2 4 MARCH 2 5
,
TIME (HOURSIFig. 2 - Free air stream and snow surface temperature.
MARCH 2 4 MARCH 2 5
T I M E (HOURS1
Fig. 3 - Free air stream and snow surface vapor pressure.
t h e air temperature may be persistently above 0°C and near saturation with the result that evaporation is reduced and even reversed and convection is increased. Under such conditions, both radiation and convection contribute to the snow melt component and the rates of melting can greatly exceed those observed in the present study. This is borne out by observations made by L a Chapelle on the Blue Glacier in Washington State ('j), by Ward and Orvig on the Barnes Ice C a p in Baffin Land (7), and by the
Under the conditions existing at the time of observation and for the assump- tions made in the calculations, the evaporative heat transfer coefficient was found to be
7.9
x
cal/cm3 mmHg and the convective coefficient3.6
x
cal/cm3 oC.The net radiation and the evaporation were found to be the major components in the balance. The studies indicate that for snow surface temperatures below OOC, the evaporative loss should be very nearly equal to the net radiative gain less the change in heat content of the snow and ground for periods of observation greater than three or four days. Snow surface temperature measurements are, at present, the greatest source of potential error in the energy balance observations. Further studies should be made to check the validity of the assumptions made and to determine, with reasonable accuracy, the constants and coefficients required for calculating the convective and evaporative heat exchange coefficients and their dependence on factors such as surface roughness.
The authors gratefully acknowledge the assistance of Mr. R. Armour in making the observations and Mr. A. Elzinga in their analysis. They are particularly grateful to Mr. D.W. Boyd, of the Canadian Meteorological Service, for his assistance in obtaining the radiation observations. This paper is a contribution from the Division of Building Research, National Research Council of Canada and is published with the approval of the Director of the Division.
REFERENCES
(1) Water Loss Investigation. Lake Hefner Studies. Techrzicnl Repcrt, Geologicni
Sirrvey, Professional Paper 269. United States Govt. Printing Office, Washington,
1954.
(
9
)BOWEN,
I.S. The ratio of heat losses by conduction and by evaporation fromany water surface. Pl~ys. Rev. ser. 2 Vol. 27, June 1926, p. 779-787.
(3) Snow Hydrology. Summary Report of the Snow Investigations. North Pacific Division, Corps of Engineers, U.S. Army, Portland, Oregon, June 1956.
(4)
.
. PRIESTLEY, C.H.B. The Turbulent Transfer in the Lower Atmosvhere. Universitv of chicago Press, 1959.(5) WILLIAMS, G.P. Evaporation from Snow Covers in Eastern Canada. National Research Council, Division of Building Research. Researcl~ Paper No. 73, Jan. 1959.
LA-CHAPELLE, E. Annual Mass and Energy Exchange on the Blue Glacier. Jolrr. Geoph. Res. 64:4, April 1959, p. 443-449.
(7) WARD, W.H. and S. ORVIG. The Glaciological Studies of the Baffin Island Expedition, 1950, Part IV: The heat exchange at the surface of the Barnes Ice Cap during the ablation period. Joirr. Glacicl.2:13, April 1953, p. 158-1 68.