HAL Id: hal-01008819
https://hal.archives-ouvertes.fr/hal-01008819
Submitted on 23 Oct 2018
HAL is a multi-disciplinary open access
archive for the deposit and dissemination of
sci-entific research documents, whether they are
pub-lished or not. The documents may come from
teaching and research institutions in France or
abroad, or from public or private research centers.
L’archive ouverte pluridisciplinaire HAL, est
destinée au dépôt et à la diffusion de documents
scientifiques de niveau recherche, publiés ou non,
émanant des établissements d’enseignement et de
recherche français ou étrangers, des laboratoires
publics ou privés.
loaded footings
Abdul-Hamid Soubra
To cite this version:
Abdul-Hamid Soubra. Reliability-based analysis and design of eccentrically loaded footings.
Inter-national Foundation Congress & Equipment Expo, IFCEE ’09, ASCE, 2009, Florida, United States.
�10.1061/41022(336)49�. �hal-01008819�
Reliability-based analysis and design of eccentrically loaded footings
Abdul-Hamid Soubra1, M. ASCE
1Professor, University of Nantes, GeM, UMR CNRS 6183, Bd. de l’université, BP 152, 44603
Saint-Nazaire cedex, France. E-mail: [email protected]
ABSTRACT: This paper presents a reliability-based approach for the analysis and
design of a shallow strip footing subjected to an eccentric load. Only the punching failure mode of the ultimate limit state is considered in this paper. The deterministic model used is based on two rotational double-spiral failure mechanisms in limit analysis. The random variables used are the soil shear strength parameters. The hypothesis of uncorrelated shear strength parameters was found conservative in comparison to the one of negatively correlated variables. The coefficient of variation of only the angle of internal friction has a significant effect on the failure probability. For design, an iterative procedure is performed to determine the breadth of the footing for a target failure probability.
INTRODUCTION
Several authors have investigated the reliability-based analysis of foundations. Some of them (e.g. Fenton and Griffiths 2003) have modelled the uncertain parameters as random processes and have examined the effect of the spatial variability of these parameters on the bearing capacity of footings. Others have modelled the uncertainties of the different parameters as random variables and have conducted a reliability-based analysis by using empirical formulas for the bearing capacity factors (e.g. Low and Phoon 2002). These approaches have the advantage of being simple; however, they present some shortcomings because they are based on approximate formulae. Also, to the authors' knowledge, there are no extensive investigations on the reliability analysis or design of footings subjected to an eccentric load. In this paper, a reliability-based analysis and design of a strip footing resting on a
(
c−ϕ)
soil and subjected to aneccentric load is presented. Only the punching mode of the ultimate limit state is analysed. A limit analysis deterministic model is used. The soil shear strength
1
Reliability-based analysis and design of eccentrically loaded footings
Abdul-Hamid Soubra1, M. ASCE
1Professor, University of Nantes, GeM, UMR CNRS 6183, Bd. de l’université, BP 152, 44603
Saint-Nazaire cedex, France. E-mail: [email protected]
ABSTRACT: This paper presents a reliability-based approach for the analysis and
design of a shallow strip footing subjected to an eccentric load. Only the punching failure mode of the ultimate limit state is considered in this paper. The deterministic model used is based on two rotational double-spiral failure mechanisms in limit analysis. The random variables used are the soil shear strength parameters. The hypothesis of uncorrelated shear strength parameters was found conservative in comparison to the one of negatively correlated variables. The coefficient of variation of only the angle of internal friction has a significant effect on the failure probability. For design, an iterative procedure is performed to determine the breadth of the footing for a target failure probability.
INTRODUCTION
Several authors have investigated the reliability-based analysis of foundations. Some of them (e.g. Fenton and Griffiths 2003) have modelled the uncertain parameters as random processes and have examined the effect of the spatial variability of these parameters on the bearing capacity of footings. Others have modelled the uncertainties of the different parameters as random variables and have conducted a reliability-based analysis by using empirical formulas for the bearing capacity factors (e.g. Low and Phoon 2002). These approaches have the advantage of being simple; however, they present some shortcomings because they are based on approximate formulae. Also, to the authors' knowledge, there are no extensive investigations on the reliability analysis or design of footings subjected to an eccentric load. In this paper, a reliability-based analysis and design of a strip footing resting on a
(
c−ϕ)
soil and subjected to aneccentric load is presented. Only the punching mode of the ultimate limit state is analysed. A limit analysis deterministic model is used. The soil shear strength
379
parameters are modelled as random variables which implies an assumption of an infinite correlation length. This may lead to unconservative estimates of the reliability index or failure probability (cf. Fenton and Griffiths 2003). A more rigourous approach dealing with the uncertainties of the soil parameters as random fields should thus be investigated in the future. After an overview of the reliability concepts, the probabilistic model and the corresponding numerical results are presented and discussed.
OVERVIEW OF RELIABILITY CONCEPTS
Two different measures are commonly used in literature to describe the reliability of a structure: The reliability index and the failure probability. The reliability index is a measure of the safety that takes into account the inherent uncertainties of the input variables. The widely used reliability index is the one defined by Hasofer and Lind. Its matrix formulation is given by:
(
μ)
(
μ)
β = − − − ∈ x C x T F x HL 1 min (1)in which x=vector representing the n random variables, μ=vector of their mean values,
C=covariance matrix and F=failure region. The minimisation of (1) is performed over
the failure domain F corresponding to the region G
( )
x ≤0 where the hyper-surface( )
x =0G , referred to as the limit state surface, separates the n-dimensional domain of
random variables in two regions: a failure region represented by G
( )
x ≤0 and a safe region given by G( )
x >0. The classical approach for computing βHL using (1) is basedon the transformation of the limit state surface into the space of standard normal uncorrelated variates. The shortest distance from the transformed failure surface to the origin of the reduced variates is the reliability index βHL. An intuitive interpretation of
the Hasofer-Lind reliability index was suggested in Low and Tang (1997) where the concept of an expanding ellipsoid led to a simple method of computing βHL in the original space of the random variables. These authors stated that the minimization of the reliability index is equivalent to find the smallest dispersion ellipsoid that is tangent to the limit state surface and whose centre is at the equivalent normal mean point of the random variables. This ellipsoid is called 'critical dispersion ellipsoid' and the ellipsoid corresponding to βHL =1 in eq (1) without the min is named 'unit dispersion ellipsoid'. The ratio between the critical dispersion ellipsoid and the unit dispersion one is the Hasofer-Lind reliability index. The computation of the equivalent normal mean and standard deviation for each trial design point are automatically found during the constrained optimization search. The method of computation of the reliability index suggested by Low and Tang (1997) is used in this paper.
parameters are modelled as random variables which implies an assumption of an infinite correlation length. This may lead to unconservative estimates of the reliability index or failure probability (cf. Fenton and Griffiths 2003). A more rigourous approach dealing with the uncertainties of the soil parameters as random fields should thus be investigated in the future. After an overview of the reliability concepts, the probabilistic model and the corresponding numerical results are presented and discussed.
OVERVIEW OF RELIABILITY CONCEPTS
Two different measures are commonly used in literature to describe the reliability of a structure: The reliability index and the failure probability. The reliability index is a measure of the safety that takes into account the inherent uncertainties of the input variables. The widely used reliability index is the one defined by Hasofer and Lind. Its matrix formulation is given by:
(
μ)
(
μ)
β = − − − ∈ x C x T F x HL 1 min (1)in which x=vector representing the n random variables, μ=vector of their mean values,
C=covariance matrix and F=failure region. The minimisation of (1) is performed over
the failure domain F corresponding to the region G
( )
x ≤0 where the hyper-surface( )
x =0G , referred to as the limit state surface, separates the n-dimensional domain of
random variables in two regions: a failure region represented by G
( )
x ≤0 and a safe region given by G( )
x >0. The classical approach for computingβHL using (1) is basedon the transformation of the limit state surface into the space of standard normal uncorrelated variates. The shortest distance from the transformed failure surface to the origin of the reduced variates is the reliability index βHL. An intuitive interpretation of
the Hasofer-Lind reliability index was suggested in Low and Tang (1997) where the concept of an expanding ellipsoid led to a simple method of computing βHL in the original space of the random variables. These authors stated that the minimization of the reliability index is equivalent to find the smallest dispersion ellipsoid that is tangent to the limit state surface and whose centre is at the equivalent normal mean point of the random variables. This ellipsoid is called 'critical dispersion ellipsoid' and the ellipsoid corresponding to βHL =1 in eq (1) without the min is named 'unit dispersion ellipsoid'. The ratio between the critical dispersion ellipsoid and the unit dispersion one is the Hasofer-Lind reliability index. The computation of the equivalent normal mean and standard deviation for each trial design point are automatically found during the constrained optimization search. The method of computation of the reliability index suggested by Low and Tang (1997) is used in this paper.
RELIABILITY ANALYSIS OF ECCENTRICALLY LOADED STRIP FOUNDATIONS
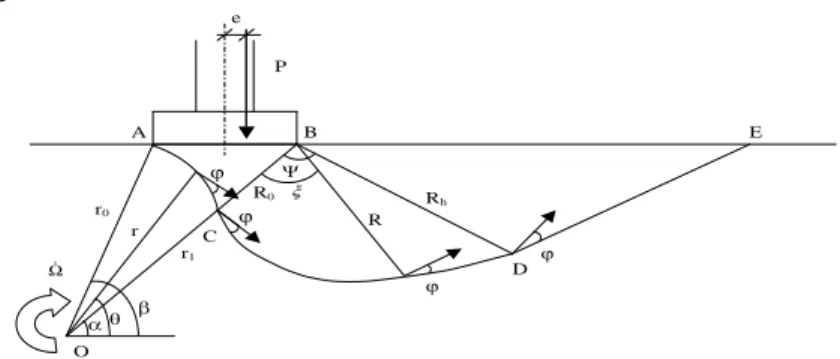
The aim of this paper is to perform a reliability analysis of a strip footing resting on a c-ϕ soil and subjected to an eccentric load. The deterministic model is based on the upper-bound method of limit analysis using two kinematically admissible failure mechanisms. The first mechanism is referred to here as M1 (Figure 1). This mechanism is composed of a central shear zone BCD sandwiched between a rigid block ABC and a
triangular shear zone BDE.
O e P Ω& ϕ ϕ r0 r1 r R0 R Rh ϕ ϕ A B C D E α θ β Ψ ξ
FIG. 1: Double-spiral rotational failure mechanism with full contact along the
soil-footing interface (M mechanism) 1
The first block ABC adjacent to the footing is bounded by a log-spiral slip surface AC.
This block undergoes a rigid body rotation about the as yet undefined center of rotation
O. Thus, the velocity along any radial line (say BC) varies linearly. The block BCD is
bounded by a log-spiral slip surface which is tangent to lines AC and DE respectively at C and D. It is subject to radial and orthoradial shear. Finally, the block BDE undergoes
a simple shear along lines parallel to line DE. This mechanism is described by 3 angular
parameters α, β and ψ. Note that the foundation is assumed to be adherent to the soil mass along the whole soil-foundation interface, i.e. AB. The second failure mechanism
is referred to here as M2 mechanism. M2 resembles M1 mechanism. The only difference is that M2 mechanism allows some separation along the soil-foundation interface. Thus, the footing is assumed to be adherent to the soil mass only along λ⋅B
where 0p λp1. In the M2 mechanism, the slip surface AC is assumed to be tangent to
the foundation at A. Notice that point A moves horizontally to the right as the
eccentricity increases. This mechanism is described by 4 parameters α, β, ψ and λ. It is particularly interesting for large load eccentricities. As expected, M1 mechanism provides the lowest solutions of the ultimate bearing capacity for small eccentricities; however for high eccentricities, M2 gives smaller (i.e. better) results because of the
3
RELIABILITY ANALYSIS OF ECCENTRICALLY LOADED STRIP FOUNDATIONS
The aim of this paper is to perform a reliability analysis of a strip footing resting on a c-ϕ soil and subjected to an eccentric load. The deterministic model is based on the upper-bound method of limit analysis using two kinematically admissible failure mechanisms. The first mechanism is referred to here as M1 (Figure 1). This mechanism is composed of a central shear zone BCD sandwiched between a rigid block ABC and a
triangular shear zoneBDE.
O e P Ω& ϕ ϕ r0 r1 r R0 R Rh ϕ ϕ A B C D E α θ β Ψ ξ
FIG. 1: Double-spiral rotational failure mechanism with full contact along the
soil-footing interface (M mechanism) 1
The first block ABC adjacent to the footing is bounded by a log-spiral slip surface AC.
This block undergoes a rigid body rotation about the as yet undefined center of rotation
O. Thus, the velocity along any radial line (say BC) varies linearly. The block BCD is
bounded by a log-spiral slip surface which is tangent to lines AC and DE respectively at C and D. It is subject to radial and orthoradial shear. Finally, the block BDE undergoes
a simple shear along lines parallel to line DE. This mechanism is described by3 angular
parameters α, β and ψ. Note that the foundation is assumed to be adherent to the soil mass along the whole soil-foundation interface, i.e. AB. The second failure mechanism
is referred to here as M2 mechanism. M2 resembles M1 mechanism. The only difference is that M2 mechanism allows some separation along the soil-foundation interface. Thus, the footing is assumed to be adherent to the soil mass only along λ⋅B
where 0p λp1. In the M2 mechanism, the slip surface AC is assumed to be tangent to
the foundation at A. Notice that point A moves horizontally to the right as the
eccentricity increases. This mechanism is described by4 parameters α, β, ψ and λ. It is particularly interesting for large load eccentricities. As expected, M1 mechanism provides the lowest solutions of the ultimate bearing capacity for small eccentricities; however for high eccentricities, M2 gives smaller (i.e. better) results because of the
381
separation permitted on the soil-foundation interface. The minimal values between both 1
M and M2 mechanisms are adopted in the present analysis.
Due to uncertainties in soil shear strength parameters, the cohesion c and the angle of internal friction ϕ are considered as random variables. The performance function of the punching mode is defined with respect to the bearing failure of the soil. It is given by:
1 1= − − =Pu P Fp
G , where Pu and P are the ultimate foundation load and the service
applied load respectively and Fp is the punching safety factor.
In this paper, one literally sets up a tilted ellipsoid in a spreadsheet and minimizes the dispersion ellipsoid subject to the constraint that it be tangent to the limit state surface. The minimization of equation 1 is performed not only with respect to the random variables, but also with respect to the geometrical parameters of the failure mechanism. The obtained surface corresponding to the minimum reliability index is referred to here as the critical probabilistic surface. The reliability index obtained using this surface is smaller (i.e. more critical) than the one calculated by using the critical deterministic surface.
NUMERICAL RESULTS
The numerical results presented in this paper consider the case of a strip foundation with breadth B=2m. The soil has a unit weight of 18 kN/m3. The illustrative values used for the statistical moments of the shear strength parameters and their coefficient of correlation ρc,ϕ are given as follows: μc =20 kPa, μϕ=30o, COVc=20%, COVϕ=10%
and ρc,ϕ =−0.5. Notice that c and ϕ are unlikely to be positively correlated. This may be explained by the linear Mohr-Coulomb failure criterion: when c increases, ϕ decreases. Experimental research is needed in order to confirm this commonly used assumption. For the probability distribution of the random variables, two cases are studied. In the first case referred to as normal variables, c and ϕ are considered as normal variables. In the second case referred to as non-normal variables, c is assumed to be log-normally distributed while ϕ is assumed to be bounded and a beta distribution is used (e.g. Fenton and Griffiths, 2003). The parameters of the beta distribution are determined from the mean value and standard deviation of ϕ. For both cases, correlated and uncorrelated shear strength parameters are considered.
For the mean values of the soil shear strength parameters, the critical eccentricity is equal to 0.11B. This corresponds to the value of the eccentricity beyond which separation may occur at the soil-footing interface. In the following sections, (i) a smaller eccentricity of 0.05B for which M1 is the most critical mechanism in a reliability analysis and, (ii) a greater eccentricity of 0.3B for which M2 mechanism becomes the most critical, are employed. The reason why M1 is suitable for e/B=0.05 and M2 for e/B=0.3 may be explained as follows: the failure mechanism used (M1 or M2) for the
separation permitted on the soil-foundation interface. The minimal values between both 1
M and M2 mechanisms are adopted in the present analysis.
Due to uncertainties in soil shear strength parameters, the cohesion c and the angle of internal friction ϕ are considered as random variables. The performance function of the punching mode is defined with respect to the bearing failure of the soil. It is given by:
1 1= − − =Pu P Fp
G , where Pu and P are the ultimate foundation load and the service
applied load respectively and Fp is the punching safety factor.
In this paper, one literally sets up a tilted ellipsoid in a spreadsheet and minimizes the dispersion ellipsoid subject to the constraint that it be tangent to the limit state surface. The minimization of equation 1 is performed not only with respect to the random variables, but also with respect to the geometrical parameters of the failure mechanism. The obtained surface corresponding to the minimum reliability index is referred to here as the critical probabilistic surface. The reliability index obtained using this surface is smaller (i.e. more critical) than the one calculated by using the critical deterministic surface.
NUMERICAL RESULTS
The numerical results presented in this paper consider the case of a strip foundation with breadth B=2m. The soil has a unit weight of 18 kN/m3. The illustrative values used for the statistical moments of the shear strength parameters and their coefficient of correlation ρc,ϕ are given as follows: μc =20 kPa, μϕ=30o, COVc=20%, COVϕ=10%
and ρc,ϕ =−0.5. Notice that c and ϕ are unlikely to be positively correlated. This may be explained by the linear Mohr-Coulomb failure criterion: when c increases, ϕ decreases. Experimental research is needed in order to confirm this commonly used assumption. For the probability distribution of the random variables, two cases are studied. In the first case referred to as normal variables, c and ϕ are considered as normal variables. In the second case referred to as non-normal variables, c is assumed to be log-normally distributed whileϕ is assumed to be bounded and a beta distribution is used (e.g. Fenton and Griffiths, 2003). The parameters of the beta distribution are determined from the mean value and standard deviation of ϕ. For both cases, correlated and uncorrelated shear strength parameters are considered.
For the mean values of the soil shear strength parameters, the critical eccentricity is equal to 0.11B. This corresponds to the value of the eccentricity beyond which separation may occur at the soil-footing interface. In the following sections, (i) a smaller eccentricity of 0.05B for which M1 is the most critical mechanism in a reliability analysis and, (ii) a greater eccentricity of 0.3B for which M2 mechanism becomes the most critical, are employed. The reason why M1 is suitable for e/B=0.05 and M2 for e/B=0.3 may be explained as follows: the failure mechanism used (M1 or M2) for the
determination of the ultimate load Pu in the punching performance function is only
dependent on the eccentricity ratio.
Reliability index, design point and failure probability
Tables 1-2 present the reliability results [i.e. Hasofer-Lind reliability index, FORM failure probability, the design point
(
c*,ϕ*)
and the resistance factors, * c Fc=μc
( )
* tan tanμϕ ϕ ϕ=F ] for different values of the applied load P and for two
values of the eccentricity ratio (e/B=0.05 ; 0.3). The case of non-normal and correlated variables is considered in these tables. Columns 2 of these tables give the values of the deterministic punching safety factor Fp computed based on the mean values of the random variables.
Table 1. Reliability results for different values of the applied load (e/B=0.05)
P(kN/m) Fp βHL Pf (%) c* ϕ* Fc Fϕ 700 2.87 3.91 0.005 18.68 19.65 1.07 1.62 900 2.24 2.89 0.193 19.65 22.09 1.02 1.42 1100 1.83 2.11 1.743 20.05 24.10 1.00 1.29 1300 1.55 1.50 6.681 20.15 25.80 0.99 1.19 1500 1.34 1.00 15.866 20.09 27.24 1.00 1.12 1700 1.18 0.57 28.434 19.93 28.48 1.00 1.06 1900 1.06 0.19 42.465 19.73 29.56 1.01 1.02 2012 1.00 0.00 50.000 19.61 30.10 1.02 1.00
Table 2. Reliability results for different values of the applied load (e/B=0.3)
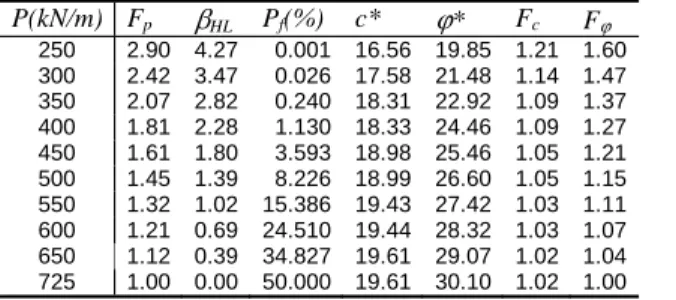
P(kN/m) Fp βHL Pf(%) c* ϕ* Fc Fϕ 250 2.90 4.27 0.001 16.56 19.85 1.21 1.60 300 2.42 3.47 0.026 17.58 21.48 1.14 1.47 350 2.07 2.82 0.240 18.31 22.92 1.09 1.37 400 1.81 2.28 1.130 18.33 24.46 1.09 1.27 450 1.61 1.80 3.593 18.98 25.46 1.05 1.21 500 1.45 1.39 8.226 18.99 26.60 1.05 1.15 550 1.32 1.02 15.386 19.43 27.42 1.03 1.11 600 1.21 0.69 24.510 19.44 28.32 1.03 1.07 650 1.12 0.39 34.827 19.61 29.07 1.02 1.04 725 1.00 0.00 50.000 19.61 30.10 1.02 1.00
For both tables, the reliability index decreases with the increase of P (i.e. with the decrease of the deterministic safety factor Fp) until it vanishes when the ultimate state of failure is reached. This ultimate state is the one for which the design point is equal to the equivalent normal mean point of the random variables. The corresponding failure probability is equal to 50%. The values of c∗ and ϕ∗ at the design point are almost
smaller than their respective equivalent normal mean values and increase with the
5 determination of the ultimate load Pu in the punching performance function is only
dependent on the eccentricity ratio.
Reliability index, design point and failure probability
Tables 1-2 present the reliability results [i.e. Hasofer-Lind reliability index, FORM failure probability, the design point
(
c*,ϕ*)
and the resistance factors, * c Fc=μc
( )
* tan tanμϕ ϕ ϕ=F ] for different values of the applied load P and for two
values of the eccentricity ratio (e/B=0.05 ; 0.3). The case of non-normal and correlated variables is considered in these tables. Columns 2 of these tables give the values of the deterministic punching safety factor Fp computed based on the mean values of the random variables.
Table 1. Reliability results for different values of the applied load (e/B=0.05)
P(kN/m) Fp βHL Pf (%) c* ϕ* Fc Fϕ 700 2.87 3.91 0.005 18.68 19.65 1.07 1.62 900 2.24 2.89 0.193 19.65 22.09 1.02 1.42 1100 1.83 2.11 1.743 20.05 24.10 1.00 1.29 1300 1.55 1.50 6.681 20.15 25.80 0.99 1.19 1500 1.34 1.00 15.866 20.09 27.24 1.00 1.12 1700 1.18 0.57 28.434 19.93 28.48 1.00 1.06 1900 1.06 0.19 42.465 19.73 29.56 1.01 1.02 2012 1.00 0.00 50.000 19.61 30.10 1.02 1.00
Table 2.Reliability results for different values of the applied load (e/B=0.3)
P(kN/m) Fp βHL Pf(%) c* ϕ* Fc Fϕ 250 2.90 4.27 0.001 16.56 19.85 1.21 1.60 300 2.42 3.47 0.026 17.58 21.48 1.14 1.47 350 2.07 2.82 0.240 18.31 22.92 1.09 1.37 400 1.81 2.28 1.130 18.33 24.46 1.09 1.27 450 1.61 1.80 3.593 18.98 25.46 1.05 1.21 500 1.45 1.39 8.226 18.99 26.60 1.05 1.15 550 1.32 1.02 15.386 19.43 27.42 1.03 1.11 600 1.21 0.69 24.510 19.44 28.32 1.03 1.07 650 1.12 0.39 34.827 19.61 29.07 1.02 1.04 725 1.00 0.00 50.000 19.61 30.10 1.02 1.00
For both tables, the reliability index decreases with the increase of P (i.e. with the decrease of the deterministic safety factor Fp) until it vanishes when the ultimate state of failure is reached. This ultimate state is the one for which the design point is equal to the equivalent normal mean point of the random variables. The corresponding failure probability is equal to 50%. The values of c∗ and ϕ∗ at the design point are almost
smaller than their respective equivalent normal mean values and increase with the
383
increase of P. They tend to the equivalent normal mean values when Pf =50%. For some values of P, c* slightly exceeds the mean. This may be explained by the counter clockwise rotation of the critical dispersion ellipse due to the negative correlation (cf. Youssef Abdel Massih and Soubra 2008). Finally, the resistance factors Fc and Fϕ
decrease with the increase of P and become equal to 1 when Pf =50% except in the case of Fc in Table 1. In this case, Fc first decreases and then increases with P. It
becomes equal to 1 when Pf =50%. This trend is again due to the negative correlation between the shear strength parameters. Notice that Fc and Fϕ corresponding to different
values of the reliability index are determined rigourously based on the maximization of the failure probability. Thus, they may be recommended for use in practice.
Effect of the probability distribution and correlation of the input parameters on the reliability index
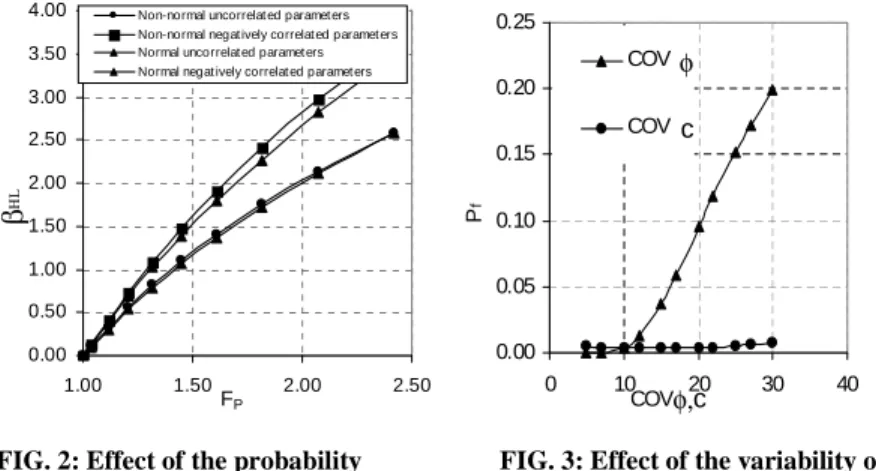
Figure 2 shows the variation of the reliability index with the punching safety factor for the cases of normal and non-normal variables with or without correlation when the eccentricity ratio e/B is equal to 0.3.
0.00 0.50 1.00 1.50 2.00 2.50 3.00 3.50 4.00 1.00 1.50 2.00 2.50 FP β HL
Non-normal uncorrelated parameters Non-normal negatively correlated parameters Normal uncorrelated parameters Normal negat ively correlated parameters
0.00 0.05 0.10 0.15 0.20 0.25 0 10COV 20 30 40 φ,c P f COV COVc φ
The reliability index corresponding to uncorrelated shear strength parameters is smaller than the one of negatively correlated variables for both normal and non-normal probability distributions. However, the probability distribution has a non-significant effect on the reliability index.
FIG. 2: Effect of the probability distribution and correlation of the random variables on the reliability index
FIG. 3: Effect of the variability of the random variables on the failure probability
increase of P. They tend to the equivalent normal mean values when Pf =50%. For some values of P, c* slightly exceeds the mean. This may be explained by the counter clockwise rotation of the critical dispersion ellipse due to the negative correlation (cf. Youssef Abdel Massih and Soubra 2008). Finally, the resistance factors Fc and Fϕ
decrease with the increase of P and become equal to 1 when Pf =50% except in the case of Fc in Table 1. In this case, Fc first decreases and then increases with P. It
becomes equal to 1 when Pf =50%. This trend is again due to the negative correlation between the shear strength parameters. Notice that Fc and Fϕ corresponding to different
values of the reliability index are determined rigourously based on the maximization of the failure probability. Thus, they may be recommended for use in practice.
Effect of the probability distribution and correlation of the input parameters on the reliability index
Figure 2 shows the variation of the reliability index with the punching safety factor for the cases of normal and non-normal variables with or without correlation when the eccentricity ratio e/B is equal to 0.3.
0.00 0.50 1.00 1.50 2.00 2.50 3.00 3.50 4.00 1.00 1.50 2.00 2.50 FP β HL
Non-normal uncorrelated parameters Non-normal negatively correlated parameters Normal uncorrelated parameters Normal negat ively correlated parameters
0.00 0.05 0.10 0.15 0.20 0.25 0 10COV 20 30 40 φ,c P f COV COVc φ
The reliability index corresponding to uncorrelated shear strength parameters is smaller than the one of negatively correlated variables for both normal and non-normal probability distributions. However, the probability distribution has a non-significant effect on the reliability index.
FIG. 2: Effect of the probability distribution and correlation of the random variables on the reliability index
FIG. 3: Effect of the variability of the random variables on the failure probability
Effect of the variability of each random variable on the reliability index
Figure 3 shows the FORM failure probability versus the coefficient of variation of c and ϕ. For each curve, the coefficient of variation of a parameter is held to the same constant value given in the introduction of the section named "numerical results" and the coefficient of variation of the second parameter is varied over the range 5%-30%. The results show that the failure probability is highly influenced by the coefficient of variation of the angle of internal friction, the greater the scatter in ϕ, the higher the failure probability of the foundation. This means that the accurate determination of the distribution of this parameter is very important in obtaining reliable probabilistic results. The significant influence of ϕ on Pf may be explained by the fact that a significant change in the deterministic ultimate bearing capacity is obtained due to a small change in ϕ; the cohesion parameter does not have a significant effect on the ultimate load.
Probabilistic design
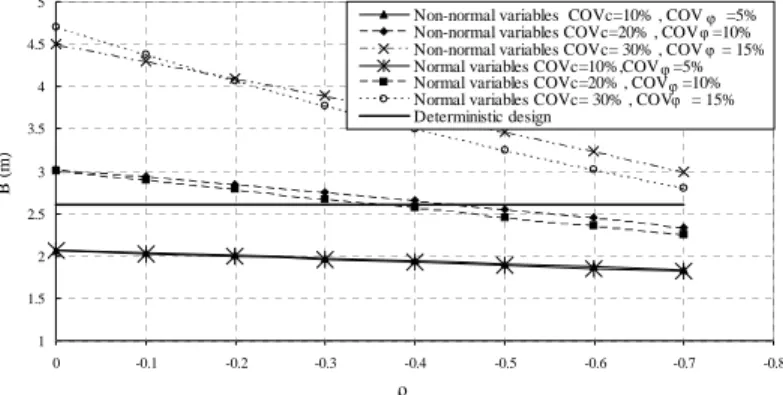
The conventional deterministic approach used in the design of a shallow foundation consists in prescribing a target safety factor (generally Fp=3 for the punching mode) and determining the corresponding breadth of the footing B. In this section, a probabilistic design is presented. It consists in the calculation of B for a target reliability index of 3.8 as suggested by Eurocode 7 for the ultimate limit states. The mean value of the vertical applied load was taken equal to P=800 kN/m and the eccentricity ratio was taken equal to 0.3. Figure 4 presents the probabilistic foundation breadth for different values of the coefficients of variation of the random variables and for different values of their coefficient of correlation. The cases of normal and non-normal variables are considered. This figure also presents the deterministic breadth corresponding to a punching safety factor of 3.
From figure 4, one can notice that the probabilistic foundation breadth decreases with the increase of the negative correlation between the shear strength parameters and the decrease of the coefficients of variation of the random variables. It can become smaller than the deterministic breadth for the common values of the soil variability (i.e.
5 10 %,
COVϕ= − COVc=20%, −0.7≤ρc,ϕ≤−0.3). For large values of the coefficients of
variation and small correlation coefficient, the probabilistic breadth is higher than the deterministic one. As a conclusion, the deterministic footing breadth may overestimate or underestimate the probabilistic one according to the values of the uncertainties. Contrary to Eurocode 7 which prescribes constant values of the resistance and load factors, the present Reliability Based Design RBD has the advantage of providing different values of these factors depending on the soil variability. These factors are the optimal ones and are determined rigorously by a maximization of the failure probability for a given soil variability.
7
Effect of the variability of each random variable on the reliability index
Figure 3 shows the FORM failure probability versus the coefficient of variation of c and ϕ. For each curve, the coefficient of variation of a parameter is held to the same constant value given in the introduction of the section named "numerical results" and the coefficient of variation of the second parameter is varied over the range 5%-30%. The results show that the failure probability is highly influenced by the coefficient of variation of the angle of internal friction, the greater the scatter in ϕ, the higher the failure probability of the foundation. This means that the accurate determination of the distribution of this parameter is very important in obtaining reliable probabilistic results. The significant influence of ϕ on Pf may be explained by the fact that a significant change in the deterministic ultimate bearing capacity is obtained due to a small change in ϕ; the cohesion parameter does not have a significant effect on the ultimate load.
Probabilistic design
The conventional deterministic approach used in the design of a shallow foundation consists in prescribing a target safety factor (generally Fp=3 for the punching mode) and determining the corresponding breadth of the footing B. In this section, a probabilistic design is presented. It consists in the calculation of B for a target reliability index of 3.8 as suggested by Eurocode 7 for the ultimate limit states. The mean value of the vertical applied load was taken equal to P=800 kN/m and the eccentricity ratio was taken equal to 0.3. Figure 4 presents the probabilistic foundation breadth for different values of the coefficients of variation of the random variables and for different values of their coefficient of correlation. The cases of normal and non-normal variables are considered. This figure also presents the deterministic breadth corresponding to a punching safety factor of 3.
From figure 4, one can notice that the probabilistic foundation breadth decreases with the increase of the negative correlation between the shear strength parameters and the decrease of the coefficients of variation of the random variables. It can become smaller than the deterministic breadth for the common values of the soil variability (i.e.
5 10 %,
COVϕ= − COVc=20%, −0.7≤ρc,ϕ≤−0.3). For large values of the coefficients of
variation and small correlation coefficient, the probabilistic breadth is higher than the deterministic one. As a conclusion, the deterministic footing breadth may overestimate or underestimate the probabilistic one according to the values of the uncertainties. Contrary to Eurocode 7 which prescribes constant values of the resistance and load factors, the present Reliability Based Design RBD has the advantage of providing different values of these factors depending on the soil variability. These factors are the optimal ones and are determined rigorously by a maximization of the failure probability for a given soil variability.
385
1 1.5 2 2.5 3 3.5 4 4.5 5 -0.8 -0.7 -0.6 -0.5 -0.4 -0.3 -0.2 -0.1 0 ρ B ( m )
Non-normal variables COVc=10% , COV =5% Non-normal variables COVc=20% , COV =10% Non-normal variables COVc= 30% , COV = 15% Normal variables COVc=10%,COV =5% Normal variables COVc=20% , COV =10% Normal variables COVc= 30% , COV = 15% Deterministic design ϕ ϕϕ c,ϕ ϕ ϕ ϕ
FIG. 4: Comparison between deterministic and probabilistic design CONCLUSION
This paper presents a reliability-based approach for the analysis and design of a strip footing subjected to an eccentric load. The random variables are the soil shear strength parameters. A RBD of the footing has also been presented. It was shown that the negative correlation between the shear strength parameters gives a higher reliability of the footing. However, the type of the probability distribution of the random variables does not have a significant effect on the reliability index. The failure probability was found to be significantly influenced by the coefficient of variation of ϕ. The values of the design points have given information about the resistance factors of the random variables. The RBD has shown that the probabilistic foundation breadth decreases with the increase of the negative correlation between the shear strength parameters and the decrease of the coefficients of variation of the random variables. The deterministic footing breadth corresponding to a punching safety factor of 3 may thus overestimate or underestimate the probabilistic one according to the values of the uncertainties.
REFERENCES
Fenton, G. A., and Griffiths D. V. (2003). "Bearing capacity prediction of spatially random C-φ soils." Can. Geotech. J., 40: 54-65.
Low, B. K., and Tang, W. H. (1997). "Efficient reliability evaluation using spreadsheet." J. of Engrg. Mech., ASCE, 123: 749-752.
Low, B. K., and Phoon, K. K. (2002). "Practical first-order reliability computations using spreadsheet." Probabilistics in Geotechnics: Technical and Economic Risk
Estimation, Austria, 39-46.
Youssef Abdel Massih, D.S., and Soubra, A.-H. (2008). "Reliability-based analysis of strip footings using response surface methodology." Int. J. Geomech., 8 (2): 134-143.
8 1 1.5 2 2.5 3 3.5 4 4.5 5 -0.8 -0.7 -0.6 -0.5 -0.4 -0.3 -0.2 -0.1 0 ρ B ( m )
Non-normal variables COVc=10% , COV =5% Non-normal variables COVc=20% , COV =10% Non-normal variables COVc= 30% , COV = 15% Normal variables COVc=10%,COV =5% Normal variables COVc=20% , COV =10% Normal variables COVc= 30% , COV = 15% Deterministic design ϕ ϕϕ c,ϕ ϕ ϕ ϕ
FIG. 4: Comparison between deterministic and probabilistic design CONCLUSION
This paper presents a reliability-based approach for the analysis and design of a strip footing subjected to an eccentric load. The random variables are the soil shear strength parameters. A RBD of the footing has also been presented. It was shown that the negative correlation between the shear strength parameters gives a higher reliability of the footing. However, the type of the probability distribution of the random variables does not have a significant effect on the reliability index. The failure probability was found to be significantly influenced by the coefficient of variation ofϕ. The values of the design points have given information about the resistance factors of the random variables. The RBD has shown that the probabilistic foundation breadth decreases with the increase of the negative correlation between the shear strength parameters and the decrease of the coefficients of variation of the random variables. The deterministic footing breadth corresponding to a punching safety factor of 3 may thus overestimate or underestimate the probabilistic one according to the values of the uncertainties.
REFERENCES
Fenton, G. A., and Griffiths D. V. (2003). "Bearing capacity prediction of spatially random C-φ soils." Can. Geotech. J., 40: 54-65.
Low, B. K., and Tang, W. H. (1997). "Efficient reliability evaluation using spreadsheet." J. of Engrg. Mech., ASCE, 123: 749-752.
Low, B. K., and Phoon, K. K. (2002). "Practical first-order reliability computations using spreadsheet." Probabilistics in Geotechnics: Technical and Economic Risk
Estimation, Austria, 39-46.
Youssef Abdel Massih, D.S., and Soubra, A.-H. (2008). "Reliability-based analysis of strip footings using response surface methodology." Int. J. Geomech., 8 (2): 134-143.