HAL Id: hal-01591719
https://hal-ensta-paris.archives-ouvertes.fr//hal-01591719
Submitted on 18 Jan 2018
HAL is a multi-disciplinary open access
archive for the deposit and dissemination of
sci-entific research documents, whether they are
pub-lished or not. The documents may come from
teaching and research institutions in France or
abroad, or from public or private research centers.
L’archive ouverte pluridisciplinaire HAL, est
destinée au dépôt et à la diffusion de documents
scientifiques de niveau recherche, publiés ou non,
émanant des établissements d’enseignement et de
recherche français ou étrangers, des laboratoires
publics ou privés.
Influence of Robot’s Interaction Style on Performance in
a Stroop Task
Roxana Agrigoroaie, Adriana Tapus
To cite this version:
Roxana Agrigoroaie, Adriana Tapus. Influence of Robot’s Interaction Style on Performance in a Stroop
Task. International Conference on Social Robotics, Nov 2017, Tsukuba, Japan. �hal-01591719�
Influence of Robot’s Interaction Style on
Performance in a Stroop Task
Roxana Agrigoroaie and Adriana Tapus
Autonomous Systems and Robotics Laboratory, U2IS
ENSTA-ParisTech, Universit´e Paris-Saclay, Palaiseau, France
Abstract. For a greater acceptance of robots in home-like environ-ments, there is a great need to adapt the behaviors of the robots to the profiles of the individuals they interact with. In this paper, we inves-tigate the impact of the sensory profile of an individual over the robot styles of interaction displayed by a humanoid robot in a non-verbal word-color Stroop task. The style of interaction is based on different visual and auditory stimuli. The results of a within participants study carried out with 30 participants are reported. Our study suggests that the sensory profile of an individual should be taken into consideration when decid-ing the style of interaction between a robot and the person. We found statistical results that suggest that there is a difference in performance based on having either a low or high auditory category type.
1
Introduction
More and more research in the field of Human-Robot Interaction (HRI) has focused on adapting the behavior of a robot to the user it interacts with. The adaptation can be based on the personality of the user [14, 16], the affective state of the user [7], or different body signals [9].
One area in which little research has been done in HRI is to adapt the be-havior of a robot based on the sensory profile of a user. The Sensory Profile has been developed by Winnie Dunn [3, 4] to measure the responses of children to ev-eryday sensory experiences. Initially the model was developed only for children, but later research showed that it can be applied to adults as well [2]. The model has been conceptualized on the basis of the relationship between a neurological threshold continuum (low and high) and a behavioral response continuum (ac-cordance and counteract). Based on the intersection between the two continuum a four-quadrant model was developed [4].
A low neurological threshold indicates that a low-intensity stimulus is re-quired for an individual to react, while a high neurological threshold requires high-intensity stimulus or a longer time to react to the same stimulus. Accor-dance indicates that the behavior corresponds with the neurological threshold, while counteracting indicates that the person is responding contrary to the neu-rological threshold. The four quadrants are: Low Registration (high neuneu-rological threshold and accordance), Sensation Seeking (high neurological threshold and
counteract), Sensory Sensitivity (low neurological threshold and accordance), and Sensation Avoiding (low neurological threshold and counteract). Each of these four quadrants is characterized by six sensory processing categories (i.e., taste/smell, movement, visual, touch, activity level, auditory).
In this research, we analyze the visual and auditory sensory processing cat-egories corresponding to all four quadrants. The visual and auditory sensory processing categories have been chosen as they are better suited for an interac-tion between a robot and a user.
The purpose of the experiment presented in this study is to find a correspon-dence between the sensory profile of a participant and the style of interaction (based on visual and auditory stimuli) of a humanoid robot in order to improve the participant’s performance.
Our paper is structured as follows. Section 2 presents the experimental design of the experiment. The results are shown in Section 3. Finally, Section 4 concludes the paper and offers a perspective on future work.
2
Experimental Design
2.1 Robotic platform
(a) Tiago Robot (b) Laboratory setup
Fig. 1: (a) Tiago Robot; (b) Laboratory setup
In this experiment, the TIAGo robot (see Fig. 1a) was used [10], which was developed by PAL Robotics1in Spain. This version of the robot was customized
for the ENRICHME EU H2020 project2. It is composed of a mobile base, a
lifting torso, a touch-screen, and a head. The head has 2 degrees of freedom, providing pan-tilt movements and it features a RGB-D camera and an Optris thermal camera. The frontal part of the head has a stereo microphone and a speaker (mean sound pressure level 84dB(1W/1m), which were aimed at HRI.
1 www.pal-robotics.com
2
Robot Interaction Style 3
2.2 User’s Sensory Profile based on AASP Questionnaire
The sensory profile can be measured using the Adult/Adolescent Sensory Profile (AASP) Questionnaire [1]. It consists of 60 questions divided into six groups, each one corresponding to one sensory processing category. Each question is measured on a scale from 1 (almost never) to 5 (almost always). For example, a question from the auditory category is: “I am distracted if there is a lot of noise around”. The questionnaire can be given to 3 group ages (11-17 years, 18-64 years, more than 65 years), each with its own scoring key. The sensory processing category in each quadrant is measured on a scale from 1 to 5.
Individuals with high scores in Low Registration need a lower rate of presen-tation of stimuli so that they have time to detect and process the information. Individuals with low scores do not miss sensory stimuli. High scores in Sensation Seeking means that a person tries to engage actively with the sensory world. In contrast, a person with a low score is not actively involved in intensifying the sensory environment. For a person to perform better a given task, a robot should match the user’s sensory profile.
2.3 Scenario
Each experiment started with the experimenter greeting the participants and escorting them to the laboratory where the interaction took place. The experi-mental region was separated from the rest of the room so as to be sure that there were no distractions for the participants (see Fig. 1b). First, each participant had to sign a consent form in order to take part in the experiment. Once the consent form was signed each participant was asked to fill-in the AASP Questionnaire [1]. Upon the completion of the questionnaire, the experimenter left the experi-mental region, and the robot explained to the participant what they had to do. When the robot finished with the instructions, the experimenter made sure that the participants understood what they had to do.
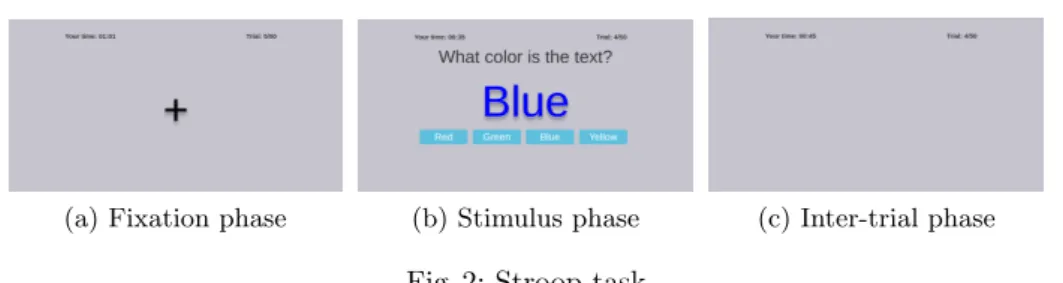
For this experiment, a computer based non-verbal word-color Stroop task was developed. This task has been chosen as it was shown in the literature that it can be used as an experimental stressor [11, 13, 15], and no significant differences have been found for gender differences [5, 8]. A variation of the classic incongruent word-color Stroop test [12] was developed, which uses four colors: red, green, blue, and yellow. Each participant performed the Stroop task on the computer monitor that was positioned in front of them. They had to use the mouse to press on the button which corresponded to the color of the text displayed on the screen. Feedback was given after each button press. There was no time limit for answering and for each trial the total number of errors, and the reaction time (RT) was recorded. Once the participant selected the correct color, the next trial began. Each trial consisted of three phases (see Fig. 2): the fixation phase, the stimulus phase, and the inter-trial phase. Before showing the stimulus, there was a 1 second fixation phase. This acted as a warning signal. In [6], the author stated that a warning signal requires a fore period of 0.5 seconds
(a) Fixation phase (b) Stimulus phase (c) Inter-trial phase
Fig. 2: Stroop task
to fully develop and to lead to the reduction of the RT. The inter-trial period of 1 second acted as a resting period.
Two difficulty levels were developed: easy (congruent Stroop) and difficult (incongruent Stroop). In congruent Stroop the written text matches the color of the text displayed (see Fig. 3a), while in incongruent Stroop the written text does not match the color of the word (see Fig. 3b). For each condition the same number of congruent and incongruent trials were shown in a random order.
After each of the robot’s behaviors the participants had to fill a custom designed questionnaire. It contained multiple Yes/No questions with respect to the amount of auditory and visual stimuli present (e.g., “Were there too many auditory stimuli?”), and 4 questions on a 5-points Likert scale to measure how the participants were affected by the auditory and visual stimuli (e.g., “How were you affected by the auditory stimuli?”) (1 - “Not at All”; 5 - “Very much”), and to assess their perception of the robot’s behavior (e.g., “The robot was stressing.”) (1 - “I disagree completely”; 5 - “I agree completely”).
(a) Congruent Stroop (b) Incongruent Stroop
Fig. 3: Congruent and Incongruent Stroop
2.4 Conditions
In this experiment, we had one condition that did not involve the robot, and two in which the robot displayed different behaviors. The robot used different audi-tory and visual stimuli in order to influence the performance of the participants.
Robot Interaction Style 5
Each participant performed all 3 conditions. Between each condition there was a short break with some relaxing music. All participants started with the Control condition and continued with the 2 robot conditions. The order of the two robot conditions was randomized between participants.
The movement of the robot was remotely controlled by the experimenter. During the Encouraging Robot condition the robot maintained a fixed position. However, during the Stressing Robot condition, the robot continuously moved back-and-forth in the left side of the participants. It was also controlled to turn around in order to distract the participants.
Condition 1. Control The purpose of the Control condition was for the participants to familiarize themselves with the task in order to counteract the novelty factor. This condition consisted of 60 trials. For this part, the robot was not present in the examination are. The last 20 trials were considered as the control for the RT and errors for each participant.
Condition 2. Encouraging Robot The Encouraging Robot condition con-sisted of 50 trials that the participants had to perform in the presence of the robot. In this condition the robot displayed both visual (no movement) and audi-tory (encouraging verbal content, medium volume for robot speech, and no sound for the timer) stimuli. At every 4 seconds the robot said a random encouraging verbal phrase from a given list of phrases (e.g., “I know you can do it”, “Relax”, “Keep up the good work”, “Continue just like that”, “You are progressing re-ally well”). The encouraging content was given no matter how the participant performed. The volume for the speech was set at 50% of the maximum volume of the robot speakers.
Condition 3. Stressing Robot The Stressing Robot condition consisted of 50 trials that the participants had to perform in the presence of the robot. In this condition the robot displayed both visual (movement of the robot) and auditory (stressing verbal content, high volume for robot speech, sound for the timer) stimuli. At every 4 seconds the robot said a random stressing verbal phrase from a given list of phrases (e.g., “Make a choice already”, “What are you doing?”, “Faster, faster”, “Hurry up”, “What is so hard in saying the color of the text?”). The stressing content was given no matter how good or bad the participant performed. The volume for the speech was set at 80% of the maximum volume of the robot speakers. The purpose of the timer was to induce further stress in the participants.
2.5 Hypotheses
Based on the literature review (shown in Section 1) regarding the sensory profile, we propose the following hypotheses:
H1. Participants with low scores in low registration (visual or auditory) will perform better in both Stressing and Encouraging Robot conditions than in the control condition (all trials).
H2. Participants with high scores in sensation seeking (visual or auditory) will perform better in both Stressing and Encouraging Robot conditions than in the control condition (all trials).
H3. Participants with high scores in sensation seeking auditory category will perform better in the Stressing Robot condition than in the Encouraging Robot condition.
H4. Participants with low scores in low registration auditory category will perform better in the Encouraging Robot condition than in the Stressing Robot condition.
2.6 Participants
A total of 35 participants (7 females and 28 males) agreed to take part in this experiment. Due to technical problems encountered during the experiment 5 participants had to be excluded from the analysis. As a result the data from 30 participants (M = 26.5, SD = 5.64) was further analysed. All participants have a technical background. Before the experiment they were asked how much they knew about robotics, on a scale from 1 to 5 (1=“Not at all”and 5=“Very much”). 11 participants said they knew much or very much about robotics, 13 knew somewhat, while 6 knew a little. 14 participants are from France, 5 from China, 3 from Romania, and 1 from each of the following countries: Brazil, Burkina Faso, Canada, Mexico, Morocco, Russia, Spain, and Tunisia.
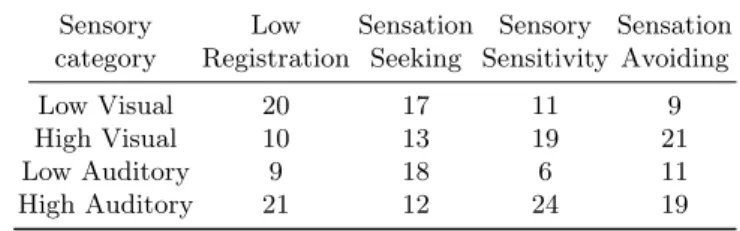
Table 1 presents the distribution of the participants based on their sensory processing categories as established by the AASP Questionnaire.
Table 1: Participants distribution based on sensory processing categories
Sensory Low Sensation Sensory Sensation
category Registration Seeking Sensitivity Avoiding
Low Visual 20 17 11 9
High Visual 10 13 19 21
Low Auditory 9 18 6 11
High Auditory 21 12 24 19
3
Experimental Results
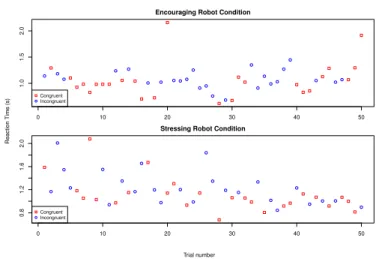
As participants had no time limit to complete the Stroop task, the majority of the participants did not commit any errors. Therefore, only the RT for each trial was further analysed. We extracted the mean RT during the congruent Stroop, the incongruent Stroop, and all trials for both encouraging and stressing conditions. As mentioned in Section 2.4, for the control condition we considered only the last 20 trials. Figure 4 shows the RT corresponding to each trial in the two robot conditions for one of the participants.
In order to test hypothesis H1 we applied four Welch Two Sample t-tests on the low auditory and low visual sensory categories for both stressing and
Robot Interaction Style 7
0 10 20 30 40 50
1.0
1.5
2.0
Encouraging Robot Condition
Congruent Incongruent 0 10 20 30 40 50 0.8 1.2 1.6 2.0
Stressing Robot Condition
Congruent Incongruent
Trial number
Reaction Time (s)
Fig. 4: Reaction times
encouraging conditions for all trials compared to the mean RT for all trials in the control condition. The results are shown in Table 2. Based on these results, our first hypothesis is validated.
Table 2: T-tests analysis for Low Registration
Sensory Category Control mean Encouraging mean t df p
Low Visual 1.495438 1.250875 2.4237 30.773 0.02144
Low Auditory 1.741030 1.396309 2.9938 15.592 0.00878
Sensory Category Control mean Stressing mean t df p
Low Visual 1.495438 1.234829 2.6883 27.733 0.01201
Low Auditory 1.741030 1.325098 4.0803 12.982 0.00130
For hypothesis H2 we applied the same type of analysis as for H1. The results are shown in Table 3. Based on the results, we can confirm hypothesis H2.
We have found no statistical significance to support hypotheses H3 and H4 (see Table 4), therefore these cannot be validated.
The results show that for both quadrants participants performed better in the Stressing robot condition than in the Encouraging robot condition.
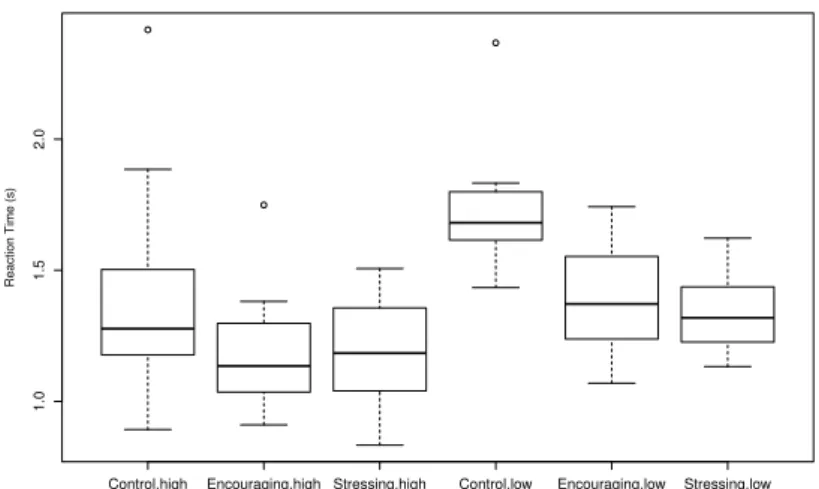
Moreover, we created boxplots of mean RT based on the conditions and the Low Registration and Sensation Seeking quadrants. The results show that par-ticipants with low scores performed differently than parpar-ticipants with high scores (e.g., Fig. 5 shows the boxplot for the mean RT in all trials for Low Registra-tion). Participants with high auditory Low Registration performed better than participants with low auditory Low Registration.
Table 3: T-tests analysis for Sensation Seeking
Sensory Category Control mean Encouraging mean t df p
High Visual 1.497737 1.269498 2.3626 22.698 0.02711
High Auditory 1.59425 1.35239 2.8233 21.342 0.01008
Sensory Category Control mean Stressing mean t df p
High Visual 1.497737 1.263102 2.5509 21.147 0.01855
High Auditory 1.59425 1.320723 3.9411 20.646 0.00076
Table 4: T-tests analysis for H3 and H4
Stroop type Sensory
Category Encouraging mean Stressing mean t df p Congruent High Auditory 1.22071 1.21187 0.1476 20.344 0.8841 Incongruent 1.48406 1.42957 0.5352 17.758 0.5991 All trials 1.35239 1.32072 0.4052 18.793 0.6899 Congruent Low Auditory 1.25064 1.19795 0.7045 15.7 0.4914 Incongruent 1.54197 1.45224 0.7481 13.051 0.4676 All trials 1.39630 1.32509 0.7841 14.275 0.4458
Control.high Encouraging.high Stressing.high Control.low Encouraging.low Stressing.low
1.0
1.5
2.0
Mean RT All Trials ~ Condition * Low Registration auditory category type
Reaction Time (s)
Robot Interaction Style 9
Next, we wanted to see if these results are statistically significant. Therefore, we performed pairwise t-tests on the mean RT in congruent, incongruent and all trials for Stroop and used as factors the auditory type for Low Registration and Sensation Seeking. We found statistically significant results for five of our tests (see Table 5).
For each condition we applied one-way ANOVA analysis of variance on the mean RT in congruent, incongruent, and all trials of Stroop task, and used the sensory profile as factors. We considered as factors the sensory categories for each quadrant. The significant results are shown in Table 6.
Table 5: Pairwise t-tests results
Stroop type Low Registration Sensation Seeking Congruent 0.0027 0.061 Incongruent 0.0013 0.0052 All Trials 0.00017 0.0046
Table 6: ANOVA test results
Condition Quadrant Sensory
category Stroop type Sum Sq Mean Sq F valuePr(>F)
Control Sensory Sensitivity Auditory incongruent 1.477 1.477 11.51 0.002**
Low Registration Auditory all trials 0.842 0.843 8.392 0.007**
Encouraging
Low Registration Auditory incongruent 0.529 0.529 9.225 0.005**
Sensation Seeking Auditory incongruent 0.42 0.42 6.861 0.014*
Low Registration Auditory all trials 0.303 0.303 7.512 0.01*
Sensation Seeking Auditory all trials 0.24 0.24 5.648 0.024*
Stressing Sensation Seeking Auditory congruent 0.187 0.187 7.201 0.121*
Sensation Seeking Auditory all trials 0.172 0.172 5.402 0.027*
4
Conclusion and Future work
In this paper, we have presented the way in which a robot could use visual and auditory stimuli to increase the performance of a user in a non-verbal word color Stroop task. We performed a within participants study with 3 conditions: con-trol - no robot, encouraging robot and stressing robot. We found that there is a correspondence between the sensory profile of a participant and the interac-tion style of the robot. Based on the results we can conclude that two of our
hypotheses have been confirmed: H1 and H2, while for the other two hypotheses we have not find any support.
Some of our future work include to find a model based on the sensory profile of a participant and their RTs during the Stroop task. Based on this model we plan to adapt the behavior of the robot in a new condition: Adaptive Robot condition. During this experiment RGB and thermal data were recorded. We plan to analyse the recorded data and to measure the arousal level of the participants.
Acknowledgement
This work was funded and done in the context of the EU Horizon2020 EN-RICHME project, Grant Agreement No: 643691
References
1. Brown, C., Dunn, W.: Adult/adolescent sensory profile: Self questionnaire. Pearson Clinical (2002)
2. Brown, C., Tollefson, N., Dunn, W., Cromwell, R., Filion, D.: The adult sensory profile: Measuring patterns of sensory processing. American Journal of Occupa-tional Therapy (2001)
3. Dunn, W.: Performance of typical children on the sensory profile: An item analysis. American Journal of Occupational Therapy (1994)
4. Dunn, W.: The impact of sensory processing abilities on the daily lives of young children and their families: A conceptual model. Infants and young children (1997) 5. Jensen, A., et.al.: The stroop color-word test: A review. Acta psychologica (1966) 6. Kahneman, D.: Attention and effort. Prentice-Hall (1973)
7. Liu, C., et.al.: Online affect detection and robot behavior adaptation for interven-tion of children with autism. IEEE transacinterven-tions on robotics (2008)
8. MacLeod, C.: Half a century of research on the stroop effect: An integrative review. Psychological Bulletin (1991)
9. Mitsunaga, N., et.al.: Robot behavior adaptation for hri based on policy gradient reinforcement learning. Journal of the Robotics Society of Japan (2006)
10. Pages, J., Marchionni, L., Ferro, F.: Tiago: the modular robot that adapts to dif-ferent research needs. International Workshop on Robot Modularity, IROS (2016) 11. Renaud, P., Blondin, J.P.: The stress of stroop performance: physiological and emotional responses to color-word interference, task pacing, and pacing speed. International Journal of Psychophysiology (1997)
12. Stroop, J.: Studies of interference in serial verbal reactions. Journal of Exploratory Psychology (1935)
13. Svetlak, M., et.al.: Electrodermal complexity during the stroop colour word test. Autonomic Neuroscience (2010)
14. Tapus, A., Tapus, C., Mataric, M.J.: Hands-off therapist robot behavior adapta-tion to user personality for post-stroke rehabilitaadapta-tion therapy. In: Robotics and Automation, 2007 IEEE International Conference on (2007)
15. Tulen, J., et.al.: Characterization of stress reactions to the stroop color word test. Pharmacology Biochemistry and Behavior (1989)
16. Woods, S., et.al.: Are robots like people?: Relationships between participant and robot personality traits in human–robot interaction studies. Interaction Studies (2007)