HAL Id: hal-00728582
https://hal.archives-ouvertes.fr/hal-00728582
Submitted on 30 Aug 2012
HAL is a multi-disciplinary open access
archive for the deposit and dissemination of
sci-entific research documents, whether they are
pub-lished or not. The documents may come from
teaching and research institutions in France or
abroad, or from public or private research centers.
L’archive ouverte pluridisciplinaire HAL, est
destinée au dépôt et à la diffusion de documents
scientifiques de niveau recherche, publiés ou non,
émanant des établissements d’enseignement et de
recherche français ou étrangers, des laboratoires
publics ou privés.
A collaborative information system supporting decision
and collaboration in transport crisis context
Guillaume Mace Ramete, Matthieu Lauras, Frederick Benaben, Jacques
Lamothe
To cite this version:
Guillaume Mace Ramete, Matthieu Lauras, Frederick Benaben, Jacques Lamothe. A collaborative
information system supporting decision and collaboration in transport crisis context. 9th International
Conference on Modeling, Optimization & SIMulation, Jun 2012, Bordeaux, France. �hal-00728582�
“Performance, interoperability and safety for sustainable development”
A COLLABORATIVE INOFRMATION SYSTEM SUPPORTING DECISION
AND COLLABORATION IN TRANSPORT CRISIS CONTEXT
G. MACE RAMETE, M. LAURAS, F. BENABEN, J. LAMOTHE
Centre Génie Industriel / Mines Albi / Université de Toulouse Campus Jarlard – Route de Teillet
81000 ALBI – France
[email protected] [email protected] [email protected] [email protected]
ABSTRACT: This paper presents the first results of a French research project SIM-PeTra dealing with an agile
Mediation Information Decision Support System in specific transport crisis context. The paper exposes the global architecture of such a system using an Event Driven Architecture approach coupled with a Service Oriented Architecture. This article describes briefly the functions of new services for this architecture. The paper explains also what are the futures topics for developing a Mediation Information System in Crisis Context.
.
KEYWORDS: Decision Support System, Crisis Management, Mediation Information System, Traffic Management.
1 INTRODUCTION
In December 2010, the north west of France was hit by heavy snowfalls. It caused disturbances in road trans-ports and because of heavy traffic, snow clearance was unable to be done. This snow episode provoked a major road crisis because of numerous accidents and truck ob-structing the road. As (Panhaleux et al., 2011) explained this crisis management might have been more efficient if a better coordination was.
A crisis can be seen as a disordered state of a reference universe (Lagadec, 92) and can be characterized by its nature, release events and problems that crisis could gen-erate. In order to prepare and resolve a crisis situation, means and techniques should be organized and imple-mented. This is the role of crisis management. (Atlay et
al., 2006) sequence the crisis management as the
succes-sion of four steps: prevention, preparation, response and recovery. In all these phases, many actors have to work together in order to resolve or reduce a crisis situation. In some cases, a crisis cell might be set up to control the cooperation and to lead the operations for response. This kind of cell is generally low supported by decision-supports systems (Truptil, 2011). Our research-work explores this weakness by designing a dedicated Media-tion InformaMedia-tion System (MIS) able to (i) provide and ensure a link between all stakeholders’ activities and (ii) to execute the collaborative processes. Particularly, our objective is to implement such a solution to support road crisis management due to bad weather conditions. To be relevant, our MIS should verify some properties.
Firstly the crisis situation could evolve during the re-sponse phase. For example the crisis situation evolution is dependant of the weather evolution. The MIS should support those changes and adapt quickly its behaviour to respond to those variations. This combination of reactivi-ty (fast response) and flexibilireactivi-ty (adaptation) can be de-fined as the agility of the MIS.
Secondly, this MIS property shall be integrated firstly while it is designed (Design Time) and secondly while it is running (Run Time).
Thirdly, as an information and decision support system (IDSS) for crisis management, the MIS should cover the following functionalities (Aligne, 2009): (i) acquisition of information (collect, update and share information) (ii) analysis and understanding of situation (represent, monitor, detection and alert) (iii) decision-making sup-port (Decision elaboration, resources allocation, planning and analyse the impact of decision).
Finally, the research statement is how can we provide an
agile Mediation Information Decision Support System able to support transport crisis management? In the
fol-lowing, the first part deals with a literature review con-cerning agility and tools that have been implemented in a crisis context. Then we propose a method to provide an agile decision system for crisis management and we fin-ish with a transportation use case that illustrates our sci-entific proposal.
MOSIM’12 - June 06-08, 2012 - Bordeaux - France
2 LITTERATURE REVIEW
A possible solution to support crisis response is to set up a MIS coordinating actors. The ISyCri project (Interop-erability of System in Crisis situation) deals with such an information system. (Truptil, 2011) explains how to de-sign and implement a MIS supporting a crisis response based on a Service Oriented Architecture (SOA). The MIS implementation starts by deducing collabora-tive process cartography from a crisis characterization and a description of each actor service. The crisis and actors descriptions are done respecting a generic crisis metamodel defined in (Benaben et al. 2008). This meta-model describes the crisis as a complex system divided into three complementary dimensions (i) crisis character-ization, (ii) studied system (crisis environment and crisis risks) and (iii) treatment system (actor and services used to respond to the crisis situation). Once the metamodel is instancied, the collaborative process deduction is done respecting rules described by (Truptil et al. 2008). A
major lack of this deduction is that it only takes into ac-count crisis characteristics and actor’s services but does not care of means dimensions and possible processes options.
In the second phase of MIS implementation, the collabo-rative process is defined as a workflow following a transformation described by (Touzi et al. 2009). Then a new transformation is done to implement technically the workflow into an Enterprise Service Bus (ESB). This phase is done automatically increasing system agility in terms of flexibility (it can support crisis or actor evolu-tions) and reactivity (short design lead time).
A crisis might change and so the crisis response needs to evolve too. (Pingaud, 2009) identified three change rea-sons: (i) crisis nature changes, (ii) modification of re-sponse composition (an actor can leave or join the crisis cell) (iii) dysfunction while crisis response is running. Thus, the detection of the crisis evolution takes an im-portant place in order to design an agile information sys-tem supporting crisis response. (Truptil et al., 2010) de-tected evolutions through a panel control which follows on the one hand risks and consequences of the crisis (cri-sis characteristics) and on the other hand the actor and services status (Treatment System). According to those information the system can be redesigned at different levels (new collaborative process, new workflow defini-tion, new services). The panel control is filled in by the current services states (finished, in progress, not started yet) and by the information recoveries from the field. Then two limits can be identified. Firstly, it only takes
into account the service states but doesn’t deal with how the service was executed. It lasts indicators to make a performance assessment of the activities. Secondly, the way to retrieve real time data is laborious and could be done more automatically.
In order to assess a crisis response, (Rongier et al., 2010) provides a method to define a Performance Indicator System (PIS) for the control of a crisis in four steps: (i) characterization of domain or process or activity, (ii) risk analysis per domain or process or activity, (iii) Determi-nation of performance indicators to use, (iv) scorecard by domain, process or activity (Indicator list). The indica-tors list takes part for the following dimensions: rele-vance, efficiency, effectiveness and effectivity. Defining such a PIS is useful in order to do a real time perfor-mance assessment of a collaborative response crisis pro-cess.
On the other hand, (Luckham, 2011) proposes an Event Driven Architecture in order to retrieve real time data via a Complex Event System (CEP). He defined it as an ar-chitectural style in which components are event-driven and communicate by means of events. (Maréchaux, 2006) considered that an EDA approach is based on the publish/subscribe mechanism. (Luckham, 2011) distin-guishes two categories of event entities: on the one hand event producer that sends events and on the other hand event consumer that receives events. The key device for EDA is the CEP where events are read, created and transformed according to rules defined to fix its behav-iour. The European project PLAY is working with EDA developing a distributed platform for event-driven inter-action between services.
At the end, to elaborate several possible processes op-tions (Badeig et al., 2008) details a decisional system that helps transport crisis management. It is based on a multi-agent simulator that helps in defining and simulat-ing multi scenarios in transport crisis context. It supports crisis management to take right decisions in particular for choosing to forbid circulation on specific roads. This simulator is made of three modules: traffic management, life cycle and observer. Traffic management chooses which roads are going to be closed. Life cycle defines simulation parameters and in particular the chosen sce-nario. The observer recovers environment data to anal-yses the scenario execution using an interface with a traffic simulator.
3 SCIENTIFIC PROPOSITION
As explained before, our scientific proposition deals with the design of a MIS for road crisis management. The figure 1 describes the system architecture and the service that we are going to provide. We make a distinction be-tween the design time (when all the different models are deduced) and the run time (when the MIS is going to support the crisis response and the coordination between all actors).
1) The mechanism used in ISyCri project is reused for deducing and implementing a MIS in a crisis context. Firstly the crisis transport situation is modelled thanks to the crisis situation characterization design service (model editor). Secondly the process cartography is deduced from the crisis model thanks to business rules defined in the services. Thirdly the workflow associated to the col-laborative cartography is defined. At the same time we suggest to set up a Performance Measurement System (PMS) that aims to assess qualitatively each activity of the collaborative process. The PMS is based on the defi-nition of Key Performance Indicator (KPI) in a crisis situation.
2) During these previous steps a Simulation & Perfor-mance Assessment (SPA) service can be used to support each design service. It should take into account the mean allocation and provide different options for designing the process. It might also elaborate several scenarii while defining the collaborative process. Thus flexibility is increased for the new system.
3) Once the system is designed, the workflow is running in the bus through a workflow engine. This one guaran-tees the coordination and the collaboration between all services and actors. It acts like a conductor whose score is the workflow model and whose orchestra is composed by all actors and run time services associated.
4) Crisis situation evolutions and services states can be represented by events in an EDA. Those events are sent into an event cloud where they are treated by a CEP. In turn the CEP sends events according to rules that have been defined during crisis preparation phase.
5) During Run Time the CEP emits events in the event cloud. The MIS needs to get them back in order to adapt its behaviour according different evolutions. The MIS is connected to the event cloud through an event proxy. The event proxy subscribes to events that MIS services are interested in. For example a road management ser-vice could be interested in « traffic jam » events. Thus the event proxy will be subscriber for all « traffic jam » events and keep the road management service informed. 6) Events are also sent to the automatic adjustment ser-vice. This service is divided in three functions. The model updating gathers information from crisis situation and update the associated model (real model). On the other hand a theoretical model is deduced after each ac-tivity of the process and represents the situation, as it should be after having been treated. Secondly the model comparison makes the difference between the real model and the theoretical one. It aims to detect if the response is still appropriate to treat the crisis situation. Then it gives information to the adaptation service, which is going to replay the MIS deduction explained in 1) from the three different levels: crisis characterization, process
MOSIM’12 - June 06-08, 2012 - Bordeaux - France
cartography deduction or workflow definition. The au-tomatic adjustment service provides agility in Run Time to the MIS because reactivity of the response to the crisis evolution is increased.
7) In order to realise a real time assessment a Perfor-mance Measurement System is proposed. The PMS of-fers three functions for the user. Firstly it calculates the Key Performance Indicators (defined in Design Time see 1)) thanks to the Performance Indicators Measurement services. The calculation is based on events provided by the event cloud through the event proxy. Once KPI are calculated, the PMS send its results as events to the event proxy. Those KPI give qualitatively information about how the activities are processed. The PMS is also composed of a capitalization service, which recovers all run time information about the process, and the services. It aims to assess the deduction process and the CEP rules according to the relevance of the response to the crisis situation. So it could change and define new business rules for the process cartography deduction and for the CEP. Thus it intents to increase the system agility in Design Time. At last, all the KPI calculated are moni-tored on a dashboard that provides a report to the crisis cell manager. Some decisions are too complex to be au-tomatically taken by the system. Indeed several parame-ters can not be modelled (e.g. media influence) and lead to take decisions that the system could not be able to choose (e.g. political decisions). Thus the user should be able firstly to manually defined rules for deduction or in the CEP and secondly to send events to the event cloud.
4 USE CASE
In November 2010, the North West of France was hit by heavy snowfalls. This event totally blocked the road traf-fic and people were blocked in their car during many hours. This major crisis was managed by the West CRICR (Centre Régional d’Information et de Coordina-tion Routière). It had to take decisions about traffic man-agement dealing with the real traffic situation. However it was not informed in real time of the situation evolution and as a result decisions were taken too late to be effec-tive. This lack of reactivity was damaging regarding the response to the crisis situation. For example the CRICR took too much time to forbid truck traffic on a motorway with high declivity where snow kept staying on the as-phalt. A feedback on this crisis has shown that there were two reasons for this lack of reactivity. A first rea-son was a too long data feeding of the cell crisis. Indeed the CRIRCR did not know immediately of the meteoro-logical forecast for this sensible motorway and so the lead-time to take decision was too long. On the other hand because of a lack of coordination, the application of the bylaw was too long. Thus, some trucks ran on this motorway and caused an accident cutting all the traffic even for cars. As a consequence people had to stay in their car all night long. Here we identify two reasons why
the system was not effective: firstly ignorance of the real
situation (information feedback too long) and on the other hand a slowness to take and diffuse decisions.
In order to be prepared to cope with a transport crisis situation, some plans are defined during the preparation phase. This plan is called PIZO (Plan Intempéries Zone de l’Ouest). This is divided in four levels depending of the crisis gravity. Each level is a step in a crisis response. Thus, level 1 means that the crisis cell is awake and vigi-lant to all events that could happen. It lasts from the 15th of November to the 15th of March. Level 2 corresponds to a pre-alert phase according to a future event. In level 3 some traffic management measures are taken in order to prevent a risk. In PIZO level 4 curative traffic manage-ment measures are taken.
Now, let consider how our MIS system should have been helpful for the level 3 PIZO by supporting the crisis cell management in solving the situation.
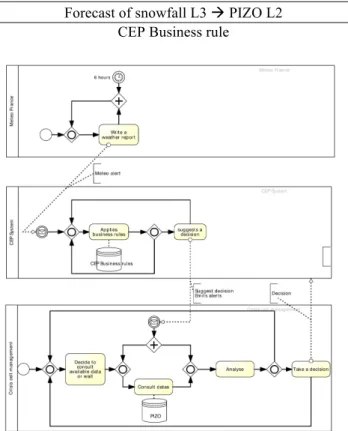
The 21st of November at 8 :00 A.M, Meteo France emits a new weather report that announced a meteorological alert. It forecasted snowfalls on cold asphalt for Manche and Calvados departments at a level of 3 on 4 (orange vigilance level). The CEP is an event subscriber for all weather report. This alert is retrieved and read by the CEP as an event. Then the CEP searches for a business rule to apply regarding the type and the value of this event. A rule for this kind of alert could be: forecast of snowfall level 3 implies the activation of the PIZO level 2 for the concerning departments.
Forecast of snowfall L3 à PIZO L2 CEP Business rule
The PIZO level 2 is a pre alert where all actors get ready to face the crisis. For example snowploughs are de-ployed alongside the roads by public works. The mecha-nism is described by the figure 2.
According to the PIZO level upgrade, new process car-tography needs to be deduced regarding the new situa-tion. This process concerns the activation of the level 2 and the coordination between actors. Firstly a conference call is organized between all actors involved in the crisis in order to ensure that they are prepared to face and an-ticipate the crisis. Once the level upgrade is validated the bylaw is written and signed by the prefect. Thanks to the new system designed, the lead-time between the event appearance and the process deduction is reduced, in-creasing the agility of the crisis response.
At 10 AM crisis cell gets two additional informations. Firstly snow is falling and staying on the asphalt in Manche and Calvados. Secondly traffic conditions are difficult on the A84 motorway (motorway with high slopes). Those events are retrieved by the CEP with a similar process described in figure 3. Then it analyses them applying business rules. The following rule is ap-plied: the combination of snow falls, difficulties to circu-late and risk associated with the geography of the
mo-torway implies that the road should be closed to traffic truck.
Snow falls && difficulties to circulate && slopes on motorway à close motorway to trucks.
CEP Business rule
The CEP is a decision support system. Thus it suggests forbidding truck traffic for the riskily part of A84 mo-torway where declivity is too important. This decision implies a new crisis characterization and the deduction of a new collaborative process.
Thanks to the new crisis situation (A84 should be closed to truck traffic) the system deduce new process cartog-raphy. Indeed in order to stop the traffic on a road, some prerequisites need to be done. Firstly upgrading the PIZO level from level 2 to 3 for the concerned depart-ments is required. Secondly truck storage areas need to be activated to « protect » the A84 motorway. Thirdly it is necessary to divert traffic truck to other itinerary. All that measures are written in bylaws submitted by the prefect and diffused to all concerned actors (police, pre-fecture, road managers).
Figure 4: New process cartography The crisis management cell is able to follow the situation
thanks to events emitted by actors and gathered by the CEP. Once all bylaws are set up, the crisis management cell can follow the situation evolution thanks to events from the CEP.
At 11 PM, the DIRNO (Direction Interdépartementale des routes du Nord Ouest), which is in charge of operat-ing and maintainoperat-ing motorways in North West, is alarmed that two trucks have collided on the A84 despite the bylaw. Circulation is now impossible on the motor-way until the two crashed trucks have been removed. Then DIRNO send an event to the CEP system indicat-ing that traffic conditions are very difficult on the A84.
The CEP system gathers this event and searches a busi-ness rule that could be applied for this kind of event. Then the CEP purposes a decision to upgrade the PIZO level and to close the highway between the two highway exits close to the truck accident and a proposition of an alternative route on the secondary road network. Then the crisis situation has changed. The model updat-ing service changes the crisis characterization. The mod-el comparison service compares the new modmod-el with the former. Changes are so important that a new collabora-tive process might be deduced. Indeed the accident im-plies that civil defence has to rescue injured people. The process is deduced from the crisis characterization fol-lowing business rules. The process is described in the next figure.
MOSIM’12 - June 06-08, 2012 - Bordeaux - France
Figure 5: New process cartography Thanks to the automatic adjustment system (model
up-dating, comparison and adaptation services), the system is able to redefine a new process quickly. It increases the flexibility of the system.
At 1 PM, the police inform the CEP that the truck storing zone is full at 80%. This value is a threshold. So the CEP searches for a business to apply in this case. Then it pur-poses to activate the storing zone upstream to this one in order to protect it. The activation is done through a bi-law.
Storing zone 80% full à activate the upstream zone
CEP Business rule
At 4 PM, Meteo France raises a new meteorological re-port forecasting that snowfalls will stop. The alert level for departments Manche and Calvados downgrades to level 2. In the same time, protection defence and police inform that the accident is ended on the motorway. Traf-fic conditions are now good and it is possible to circulate on the A84. All data are gathered by the CEP, which purposes the decision to downgrade the PIZO level and to restore circulation for all vehicles on the motorway by abrogating the former bylaws.
(meteo alert level 2)&&(accident ended)&&(traffic con-ditions good)à restore circulation && downgrade PIZO
level
CEP Business rule
Using this architecture increases the agility of the re-sponse to the crisis situation. The real situation is well-represented and analysed thanks to the CEP. The crisis cell gathers field data in quasi real time. On the other
hand thanks to business rules and process deduction the lead-time to take decision and coordinate actors is re-duced.
5 CONCLUSION
A new information decision support system has been defined for supporting transport crisis management. As a continuation of ISyCri project, it is based on a Mediation Information System and takes part in an Event Driven Architecture. The designed system is agile in Design and Run Time thanks to new services plugged in the bus. It also provides tools for making a real time assessment of the collaborative process in Design Time and Run Time. It purposes to make an assessment for the MIS design.
These concepts have been applied for a simple use case. Future works includes developing such a system and associated tools for a more complete use case study.
REFERENCE
Aligne F., “Which Information and Decision Support System for the Crisis Management”, Information
Sys-tems and Technology Panel (IST) Symposium,
Bu-charest, 11-12 May 2009
Altay N., Green W., “OR/MS research in disaster opera-tions management”, European Journal of
Operation-al Research, 2006, 175, p. 475-493.
Badeig F., Balbo F., “La gestion de crise dans les trans-ports, un simulateur multi-agent centré envi-ronnement”, Atelier Systèmes d’Information en
Transports, Inforsid’08, 2008.
Benaben F., Touzi J., Rajsiri V, Truptil S., Lorré J.P., Pingaud H., “Mediation Information System Design in a Collaborative SOA Context through a MDD Approach”, Model Driven Interoperability for
Sus-tainable Information Systems (MDISIS’08), 2008.
ISyCri Home Page. http://www.irit.fr/IsyCRI
Lagadec P., La Gestion Des Crises – Outils de réflexion
à l’usage des décideurs, Paris, Ediscience
Interna-tional, 1992.
Luckham D., Event Processing glossary – Version 2.0, Event Processing Technical Society (EPTS), 2011. Maréchaux J-L., Combining Service-Oriented
Architec-ture and Event-Driven ArchitecArchitec-ture using an Enter-prise Service Bus, IBM Software Group, 2006.
Panhaleux J., David D., Labia P., Picquand J-L., Rivière D., Terrié F., Leyrit C., Retour d’expérience à la suite de l’épisode neigeuc survenu le 8 décembre 2010 en Ile-de-France, Conseil général de l’Environnement et du développement durable, 2011.
Pingaud H., “Rationnalité du développement de l’intéropérabilité dans les organisations, Manage-ment des technologies organisationnelles”, Journées
d’études 2009, p19-30, 2009.
Rongier C., Galasso F., Lauras M., Gourc D., “A method to define a performance indicator system for the
control of a crisis”, 8th International Conference of
Modeling and Simulation MOSIM’10, Hammamet
(Tunisia), May 10-12, 2010.
Truptil S., Bénaben F., Couget P., Lauras M., Chapurlat V., Pingaud H., “Interoperability of Information Systems in Crisis Management : Crisis Modeling and Metamodeling”, I-ESA’08, Berlin, 2008. Truptil S., Etude de l’approche de l’interopérabilité par
médiation dans le cadre d’une dynamique de colla-boration appliquée à la gestion de crise, 2011, INP Toulouse.
Dolgui A. and M.-A. Ould Louly, 2000a. An Inventory Control Model for MRP Parameterization. Second
Conference IFAC on Management and Control of Production and Logistics (MCPL’2000), Grenoble,
France, vol. 3, p. 1001-1006.
Dolgui A. and M.-A. Ould Louly, 2000b. Optimization of Supply Chain Planning under Uncertainty.
Preprints of the IFAC Symposium on Manufacturing, Modeling, Management and Control (MIM’2000),
Patras, Greece, p. 291-296.
Durand, J.A., 1996. Ordonnancement dynamique et
réactif dans les ateliers flow-shop hybrides : une approche à base d’algorithmes évolutionnistes hybrides. Thèse de Doctorat, Université de Paris VI,
France.
Ellis, M., and B. Stroustrup, 1990. The annotated C++
reference manual, Addison-Wesley.
Houck, C. R., J. A. Joines, and M. G. Kay, 1996. Comparison of genetic algorithms, random restart, and two-opt switching for solving large location-allocation problems. Computers and Operations
Research, 23(6), p. 587-596.
Joines, J.A. and C.R. Houck, 1992. Genetic Algorithm
Optimization Toolbox for Matlab. Department of
Industrial Engineering, Technical Rapport No. 92-01, North Carolina State University, Raleigh, North Carolina.