HAL Id: hal-02364786
https://hal.archives-ouvertes.fr/hal-02364786
Submitted on 1 Dec 2020HAL is a multi-disciplinary open access archive for the deposit and dissemination of sci-entific research documents, whether they are pub-lished or not. The documents may come from teaching and research institutions in France or abroad, or from public or private research centers.
L’archive ouverte pluridisciplinaire HAL, est destinée au dépôt et à la diffusion de documents scientifiques de niveau recherche, publiés ou non, émanant des établissements d’enseignement et de recherche français ou étrangers, des laboratoires publics ou privés.
Impact of underhood leakage zones on the aerothermal
situation – Experimental simulations and physical
analysis
Mahmoud Khaled, Jalal Faraj, Elias Harika, Fabien Harambat, Cathy
Castelain, Mohamad Ramadan
To cite this version:
Mahmoud Khaled, Jalal Faraj, Elias Harika, Fabien Harambat, Cathy Castelain, et al.. Impact of underhood leakage zones on the aerothermal situation – Experimental simula-tions and physical analysis. Applied Thermal Engineering, Elsevier, 2018, 145, pp.507-515. �10.1016/j.applthermaleng.2018.09.077�. �hal-02364786�
1
Impact of underhood leakage zones on the aerothermal
situation - Experimental Simulations and physical analysis
Mahmoud Khaled
1,2,*, Jalal Faraj
1, Elias Harika
1, Fabien Harambat
3, Cathy
Castelain
4, and Mohamad Ramadan
1,51Energy and Thermo-Fluid group –International University of Beirut BIU – Beirut – Lebanon 2University Paris Diderot, Sorbonne Paris Cité, Interdisciplinary Energy Research Institute
(PIERI), Paris, France
3Research and Development Department, PSA Peugeot Citroën – Velizy A Center – France 4Heat Transfer and Energy Group, Polytech’Nantes, University of Nantes, Nantes–France 5Associate member at FCLAB, CNRS, Univ. Bourgogne Franche-Comté, Belfort cedex, France
*Corresponding author: mahmoud.khaled@liu.edu.lb. Tel.: +961 71 33 43 46 - School of Engineering, International University of Beirut BIU, PO Box 146404 Beirut, Lebanon
Abstract
The present manuscript deals with experimental investigations on thermal effects of air leakage zones at the boundaries of the vehicle hood. Measurements are carried out on a Peugeot 207 (Front Wheel Drive) in wind tunnel. The front wheels are activated by the car’s engine and rolling on controlling rollers built in the wind tunnel. In parallel, the wind velocity is well controlled in order to simulate real conditions of driving. The underhood compartment is equipped with 80 thermocouples distributed on different components. Three operating conditions are studied according to the engine’s rpm, to the wind and wheels velocities. The leakage zones are purposely clogged with five different configurations. The effect of the leakage zones has shown significant impact on the temperature field and has been physically analyzed.
Keywords:
Underhood, Leakage zones, Aerothermal Situation, Experiments, Physical analysis2
1. Introduction
In the last two decades cars’ business is facing several constraints of a very high level as never known before. This is directly related to the latest economic crises, to demographic growth and to the depletion of the biggest amount of petrol on Earth combined to the environment impact with its resulting effects like earth worming and ecological disturbances [1-2]. Consequently, it can be observed that product development period has been reduced to less than two years in almost all cars manufactories [3-6]. We can also realize the severity of specifications required by the international standards in order to protect environment (like euro standards) [7-8]. One can see the positive results of this state reflected by the excellent performance like the exceptionally high power/consumption ratios or the particular low contaminants propagation of nowadays cars [9-11]. On the other hand cars constructors have shown a great example of advanced engineering skills able to satisfy both natural and human requirements simultaneously.
The aforementioned facts formed components’ congestions in vehicles underhood compartments, and therefore creating complex airflows and difficult air paths to take place within the compartments [12-14]. In [12], a numerical study of the underhood flow shows recirculation regions formed in relation with the complex underhood. In [13] and for simplification reason, the entire flow domain in underhood was broken into various air flow passages. Due to the underhood geometry complexity, a model radiator was included in the numerical simulations presented in [14] to take account of the pressure drop in the under-hood compartment since numerical representation of the radiator geometry is very difficult. The air flow entering from the front grille is influenced by many components obstructing its path. Even small geometry details affect the flow direction and can easily impact the underhood cooling
3
situation [15-17]. As illustration in [16], the front end cooling module configuration (fan, fan shroud, heat exchangers) was shown to have a considerable impact on the underhood overall cooling airflow and fan torque. On the other hand in [17], it was shown that down-hill and up-hill slight inclinations (of 0.5 to 1.5 cm differences between rear and front elevations of the vehicle) increase temperatures of components, air zones and engine parameters in the underhood up to 20% at some locations. The complex underhood airflow along with the external airflow and the underhood thermal requirements, have raised a concern about the complex aerothermal phenomena which had to be studied [18-19]. These aerothermal phenomena involving airflow, heat transfer, and fluid dynamics are coupled. Consequently, the main objective is to review the behavioural aerothermal management systems taking aerothermal phenomena into consideration [20-21]. The aerothermal phenomena continue to present demanding aerothermal management challenges in the design of the air intakes and the layout of the front-end cooling module in combination with the complex geometry of the underhood [22].
To increase engine efficiency, much previous work has suggested that one must reduce the energy lost in the exhaust system or use some of it [23–25] to increase and/or control cooling-system efficiency [26–27], reduce the energy consumption of the HVAC system, or improve the underhood (engine) design [28–29] and/or combustion issues in order to increase the chemical energy and relative net brake power [30–34]. However, little work has been done on aerothermal effects that could improve energy-balance management in a well-controlled vehicle. In this context, the present study highlights the relation between an important kind of aerothermal effect, the leakage zones, and the thermal management of the underhood.
For many purposes of design, manufacturing and maintenance, cars cannot have a perfectly closed engine compartment. Small clearances always exist between the hood and its
4
surrounding (i.e. the front end, the optical, wings, and the front windshield). The literature shows that the effect of these gaps is negligible on the aerodynamics in real conditions of driving [35-36]. Nevertheless, the effect on heat exchanges and temperature field has never been quantified. However, despite the small size of these gaps, they can have important effect on the underhood temperature especially when they permit important airflow rates at relatively high temperatures [35-36]. For instance, when a car is shut down after a certain trip, many of the underhood components are significantly hot and must be cooled, even after the engine’s shutdown. The only way to ensure this “static” cooling is the natural convection which is well promoted with the presence of these gaps. The effect of gaps could be significant when the car is running too, even though the cooling is ensured by forced convection. In fact, the air leakage through these gaps ensures a well condition for air swiping and avoids the formation of dead zones in terms of airflows. Based on these hypotheses the investigation on the thermal effects of the gaps becomes primordial.
The presented experiments were achieved with closing the gaps in a degradable manner. Temperature was measured at many underhood levels whether in transient or steady states. Many scenarios were simulated according to real conditions of driving. The following paragraph describes the testing equipment and configurations. The results are presented in the last 2 paragraphs, according to qualitative and quantitative analysis respectively.
5
2. Experimental details
2.1. Instrumentation
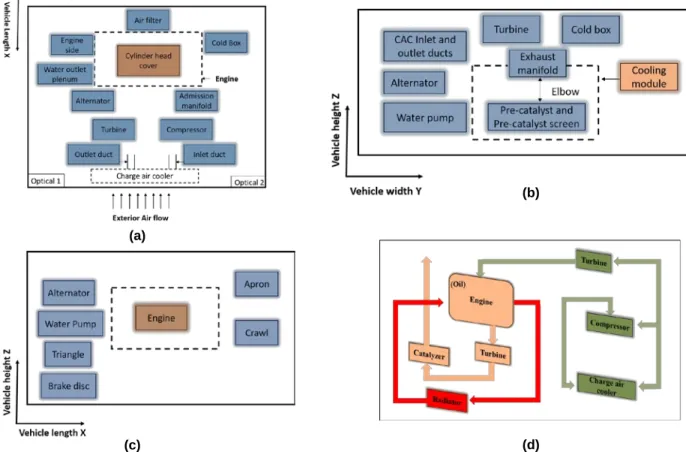
Experiments are carried out on a Peugeot 207 which was equipped with 80 thermocouples placed at different locations in the underhood compartment (Figure 1). These thermocouples of types T and K are intended to measure the temperature of engine fluids, of underhood components and within the airflows. K thermocouples are used when easiness of installation is present and when high temperatures are expected. T thermocouples are installed in complex access areas (T thermocouples are much easier to install than K thermocouples).
Figure 1: (a) Top view, (b) side view from the front of the vehicle, (c) side view from the side of the vehicle and (d) locations of temperatures related to the engine parameters.
(a)
(b)
6
The targeted components and corresponding thermocouple locations are as follows: • Exhaust manifold (One K thermocouple at the external surface) • Turbine (Three K thermocouples at the top surface)
• Turbine Screen (Two K thermocouples at the external surface) • Pre-Catalyst (One K thermocouple at the external surface)
• Pre-Catalyst Screen (Two K thermocouples at the external surface)
• Elbow joining the exhaust manifold and the pre-catalyst (Two K thermocouples at the external surface)
• Compressor (One K thermocouple at the external surface and three thermocouples at the external surface of the oil pipe)
• Cold box: zone comprising the computer and battery (two T thermocouples at the sides and one T thermocouple at the top surface)
• Apron (One T thermocouple the external surface) • Crawl (One T thermocouple the external surface)
• Water Outlet Plenum WOP (One K thermocouple at the top surface) • Alternator (One K thermocouple at the top surface)
• Air filter (One T thermocouple the external surface)
• Cylinder head cover (Three K thermocouples at the top surface)
• Inlet and outlet pipes of the charge air cooler CAC (Two T thermocouple at the external surfaces of the inlet and outlet pipes)
• Engine side (One T thermocouple at the external surface) • Triangle (One T thermocouple at the external surface)
7
• Brake Disk (One T thermocouple at the external surface)
• Steering junctions (Two K thermocouples at the top surface of each joint) • Optical (One T thermocouple at each side)
The targeted zone of airflows corresponding thermocouple locations are as follows:
• Cold box (Two T thermocouples at the sides and one T thermocouple at the top surface)
• Apron (Two T thermocouples near the external surface) • Crawl (Two T thermocouples near the external surface) • Air filter (One T thermocouple near the external surface)
• Cylinder head cover (Three T thermocouples near the top surface)
• CAC inlet and outlet pipes (One T thermocouple near the inlet pipe and one T thermocouple near the outlet pipe)
• Engine side (One T thermocouple near the top surface)
• Engine downstream (One T thermocouple at the downstream of the engine) • Fan downstream (Three T thermocouples downstream of the fan)
• Radiator (One T thermocouple near the downstream vertical surface of the radiator)
• Charge air cooler (One T thermocouple near the top surface) • Brake Disk (One T thermocouple near the external surface)
• Vehicles Sides (One T thermocouple near the external surface of each side) • Steering junctions (One T thermocouple near the top surface of each junction) • Optical (Two T thermocouples near the top surface of each side)
8
And the main points of measure related to the engine parameters are:
• Inlet / Outletof the radiator (to measure water temperatures, K thermocouples) • Inlet / Outlet of the charge air cooler (to measure air temperatures, K
thermocouples)
• Inlet / Outlet of the compressor (to measure air temperatures, K thermocouples) • Inlet / Outlet of the air filter (to measure air temperatures, K thermocouples) • Inlet / Outlet of the turbine (to measure gas temperatures, K thermocouples) • Inlet / Outlet of the catalyst (to measure gas temperatures, K thermocouples) • Upstream of the engine (to measure air temperature, K thermocouple) • Inlet / Outlet engine oil (to measure oil temperatures, K thermocouples)
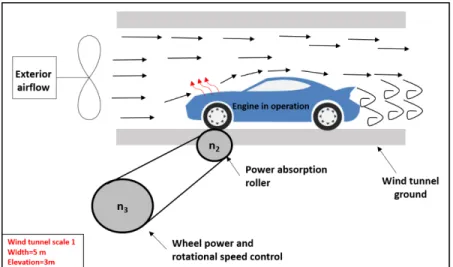
Experiments are performed in the wind tunnel “S4” at Saint-Cyr l’Ecole (France) which is customized for car testing. It is equipped with a couple of underfloor rollers flush with the ground. The tested car has its front wheels on these rollers (Figure 2). The engine is turned on and a driver is controlling the car during the tests. When the car’s front wheels roll due to the engine power, the rollers also run with the same linear velocity ensuring a no slip condition. The rollers are equipped with an electrical break system which ensures two functions simultaneously: measuring the velocity of the wheels and creating a mechanical load which simulates a real trip of the car.
9
Figure 2: Test facility rollers permitting control of wheel power and rotational speed.
2.2. Plan of Experiments
Measurements are performed for three different wind velocities and for three different combinations of rpm and transmission ratio. Table 1 gives a brief description of these combinations which are referred as “thermal functioning points” TFPs.
Table 1: Measurement parameters simulating the different thermal functioning points
Wheel Speed (km.h-1)
Wind Speed (km.h-1)
Speed Ratio Engine Speed (rpm)
TFP-1 90 90 5 2600
TFP-2 110 55 4 3800
TFP-3 130 130 5 3780
In order to emphasis the thermal effects of the leakage zones, different configurations of partial clogging are designed. Thus a first set of tests are made with no alteration of the manufactory design. This configuration is referred by “configuration 0”. Four other sets were afterwards accomplished by clogging regularly a part of the leakage zones in an incremental manner. The concerned gaps for this study were only the surroundings of the hood (Figure 3).
10
Figure 3: Different leakage zones concerned in the study.
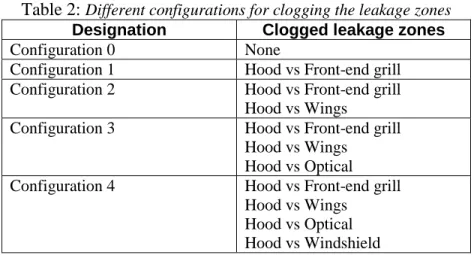
The clogging was performed with an adherent tape with plastic layer to ensure a perfect sealing against air. Table 2 describes the different clogging configurations named “configuration 0” to “configuration 4”. It should be noticed that in each configuration, the additional clogged leakage zone is fully clogged.
Table 2: Different configurations for clogging the leakage zones
Designation Clogged leakage zones
Configuration 0 None
Configuration 1 Hood vs Front-end grill Configuration 2 Hood vs Front-end grill
Hood vs Wings
Configuration 3 Hood vs Front-end grill Hood vs Wings
Hood vs Optical Configuration 4 Hood vs Front-end grill
Hood vs Wings Hood vs Optical Hood vs Windshield
2.3. Different stages of one test
In summary 15 different testing configurations were made: (3 thermal points) × (5 clogging levels).For each configuration a complete test is accomplished into 3 different stages:
11
1- A rolling phase: it consists in starting the engine relatively cold and making the wheels running for a certain period of time at the required thermal functioning point. Temperature measurements are accomplished during this phase covering both transient and steady states.
2- A phase of slowing down which succeeds directly the rolling phase. In this phase the transmission is set at the neutral gear and the engine at idle mode while the wind is shut down.
3- A phase of thermal soak: This phase simulates the shutdown of a car after a certain trip during which the underhood components have been thermally loaded. In fact, these components can maintain high temperatures even after the engine shutdown due to their thermal inertia. This heat is afterwards transmitted to other components which experience particular high temperatures especially that the forced convection cooling is stopped. Thus the only way for cooling these parts in the phase of thermal soak is by natural convection.
An external computer was connected to the car’s computer during the experiments which made it possible to control some elements of the car. Particularly, the fan was forced to run at his high speed during the rolling but kept in full autonomy mode during the phase of slowing down.
2.4. Data acquisition
For each test the driver starts up the engine and sets the car at the required thermal functioning point. The acquisition starts at this moment and continues to the end of the third phase (thermal soak). After a period of rolling the temperature shows certain stabilization which announces the end of the rolling phase. The driver is informed at this stage and is asked to let the engine in idle mode. The wind tunnel is also shut down at the same moment. Once the wind
12
velocity becomes zero the driver turns off his engine and the phase of thermal soak starts. The starting moment of each phase is saved with the data for each temperature curve.
2.5- Uncertainties
Since the present study is based on experimental data measured for temperature, uncertainty analysis will be established based on temperature data. The experiments were repeatedly done to get correct measurements. For the same operation conditions (Thermal functioning points), the average of the relative mean temperature differences was found to be 0.9 % between the tests. In addition to that, it was found that the error of placing the thermocouples at the different surfaces is 0.4 °C. Then based on the different temperature ranges, it was found that the relative difference was below 1.7 % at the different measurement locations. Then, for a 0.9 % repeatability and 1.7 % precision error, the uncertainty was found to be 1.9%, leading to 98.1 % reliance on the data measured.
3. Results - Qualitative analysis
In this paragraph only the trends of temperature are presented and analyzed. The curves which correspond to the 5 configurations are superposed in 1 graph for each underhood element and for each test stage. The most interesting stages in our study are the rolling phase (in steady state) and the phase of thermal soak. In the first one (rolling phase) the x axis i.e. the time axis, is set for each curve in order to have a same moment of stabilization for the 5 curves. In the graph of thermal soak the curves have a same moment of engine’s shutdown.
13
A quick observation through the entire results leads to the following conclusions:
• Clogging the joints hood/front-end grill, hood/wings and hood/windshield increases significantly the temperature of several elements and underhood zones, in addition to the engine temperatures. This is true in thermal soak as well as in rolling phase.
• These effects are more relevant for the case of hood/front-end grill and hood/windshield and less significant for the hood/wings clogging.
• Clogging the joint hood/optical results in a decrease of the temperature which was not expected.
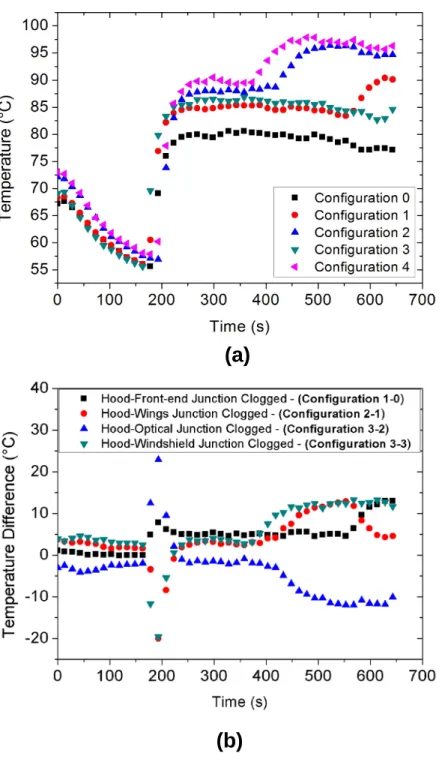
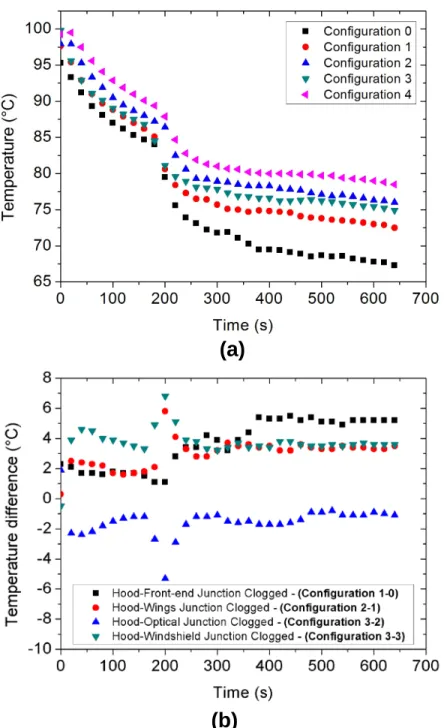
Figures 4 and 5 show these trends during the phase of thermal soak respectively in the cases of water outlet plenum WOP and the air zone near to the crawl. Figures 4-a and 5-a show the measured temperature in function of the time while figures 4-b and 5-b show the change in temperature for each configuration relatively to the previous configuration which is an additional clogging every time.
14
Figure 4:(a) Temperature and (b) Temperature difference for different configurations of clogging in thermal soak phase and at the surface of the water outlet plenum.
(a)
15
Figure 5: (a) Temperature and (b) Temperature difference for different configurations of clogging in thermal soak phase and in the air zone near to the crawl.
A quick look at these figures shows that the thermal soak has adverse effects on either WOP or air zones for all configurations. Indeed the WOP temperature shows an abrupt rise just after stopping the ventilation (figure 4-a) while the temperature of the air zone decreases
(a)
16
suddenly at this same instant (figure 5-a). Moreover the curves corresponding to the thermal soak are generally increasing in figure 4-a but decreasing in figure 5-a. The reason for temperature increase in the case of WOP is the heat absorption of the cooling liquid from the hot metal constituting the engine. The latter stores a huge quantity of thermal energy even after the engine shut down due to its high thermal inertia. Since the cooler pump is shut down with the engine the liquid is utmost stagnant and its temperature increases quickly. Furthermore some of the curves in figure 4-a show a second phase of abruptly increasing temperature i.e. configurations 2 and 3 at around 400s. This behavior result from a probable locking of the cooler valve especially that it happens after several minutes from turning off. On the other hand the behavior of temperature shown in figure 5-a is much easier to explain since the corresponding thermocouple has its tip in the air which shows a cooling phenomenon of the relatively stagnant air near to the crawl proving the absence of any heat transfer from the hot parts into this zone.
Concerning the effect of clogging the gaps it can be deduced by comparing the different curves in each figure. Starting by Figure 4 it is clear that the curve corresponding to the “configuration 0” is distinctly separated from the others, which proves the cooling effect of the leakage zones. For instance, at the end of the thermal soak (Figure 4-a), the temperature for “Configuration0” is around 77°C while for “Configuration4” the measured temperature is 96°C, which corresponds to a temperature rise due to the clogging of around 19 0C.
This behavior was expected especially that clogging the gaps reduces the natural convection which is the only way for cooling the engine compartment in phase of thermal soak. In “configuration 4” all the gaps are clogged which is resistant to any vertical air flow and thus the natural convection is completely blocked which leads to a maximum increase of temperature.
17
One can also conclude that despite any interaction between the effects of the different configurations, “Configuration1” corresponding to clogging the junction between the hood and the front-end grill has the most important effect on the cooling: at the end of the thermal soak phase, an increase of 14°C for this configuration is noticed compared to the maximum rise of 19°C for “Configuration 4” where all leakage zones are clogged.
These trends are also visible on the graphs of air zone near to the crawl (Figure 5-a) and were detected on the temperature measured in the entire underhood compartment.
Moreover, the results show that the incrementing clogging of the gaps leads to an incrementing increase in temperature (Figures 4-b and 5-b). This is true for all curves except for the curve of “Configuration 3” where clogging the joint hood/optical decreases slightly the temperature (Negative curves in Figures 4-b and 5-b). This phenomenon can be explained by the interference of the airflows coming from the front-end opening and passing through this joint. In fact this joint sucks the fresh air passing in its neighborhood due to a negative pressure in it. Clogging this gap leads to ensure much more fresh air for the engine and contribute in improving the cooling.
Concerning the results obtained in the phase of rolling the trends are the same but the differences in temperature are less important (Figure 6). This leads to some confusion during the analysis especially in transient state, because the initial temperature is never the same for all tests.
In order to overtake the uncertainty due to the initial temperature, a method of analyzing named “Quantitative Analysis” is presented in the next section.
18
Figure 6: Effect of clogging leakage zones on the surface temperature of the triangle in the rolling phase and for TFP-3.
4. Results – Quantitative analysis
In practice, it is quite impossible to have a same initial temperature for all the car components and underhood locations just before the testing. Moreover, just before the phase of thermal soak, the fan is left running for a period of time (around 2 minutes) which is not the same for all tests. Therefore, in order to make fair comparisons through the results, a particular procedure of analysis is used. This procedure consists in:
(1) Separating the different phases of each experimental curve (rolling, slowdown, thermal soak),
(2) Separating the strictly monotonic parts of the thermal soak phase (this permits to eliminate the effect of the period of the ventilation at low rotational speed at the beginning of the thermal soak),
(3) Equating the initial temperature for all monotonic curves and setting the time abscissa for each one in order to get all the initial temperatures at the same initial instant t = 0. This action
19
results in one common time abscissa for all curves and ensures a fair comparison between 2 points of 2 different curves referring to one given instant.
Before proceeding with the three steps mentioned above, one should ensure that the time setting procedure eliminates the effect of the initial temperature and preserves only the effect of modifying the configuration. This is done respectively for the case of rolling first and then for the case of thermal soak separately.
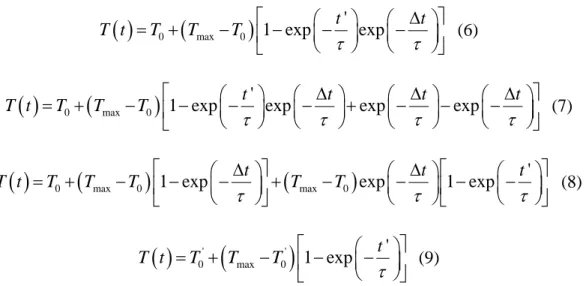
In the rolling phase, characteristic temperature trends of exponential form for almost all
components, air zones, and engine parameters are observed. These exponential tendencies can be modeled as follows:
( )
0(
max 0)
1 exp t T t T T T τ = + − − − (1)The temperature Tmaxis the maximum temperature obtained in each component or air zone (steady-state temperature) and τ is the time constant representing the thermal inertia of each component or air zone. Tmaxand τ are essentially functions of the thermal functioning point and, in the present study, of the leakage clogging arrangement.
To prove that time setting in the rolling phase eliminates the effect of initial temperatures and conserves only the effect of geometrical configuration, two temperature-time acquisitions corresponding to 2 repetitions of a same random test are considered. These acquisitions have purposely different initial temperatures but must provide exactly the same curve since it is a
20
repetition of a same test: the first one is described by equation 1 while the second one which has a different initial temperature '
0 T is described by equation 2:
( )
0(
max 0)
1 exp t T t T T T τ = + − − − (2)( )
'(
')
0 max 0 ' ' 1 exp t T t T T T τ = + − − − (3)In this case, one should prove that equations 2 and 3 correspond to the same curve. To do that, ' 0
T
is considered the initial temperature corresponding to the initial time ' 0 0
t = + ∆t t. In this case and
based on equation 2, the following relation can be written:
(
)
' 0 0 max 0 1 exp t T T T T τ ∆ = + − − − (4)And the temperature history of equation 2 can also have the following form:
( )
0(
max 0)
' 1 exp t t T t T T T τ + ∆ = + − − − (5)Where t'is the time counted starting from ' 0
t and nott . Then, equation 5 can be developed as 0
21
( )
0(
max 0)
' 1 exp t exp t T t T T T τ τ ∆ = + − − − − (6)( )
0(
max 0)
'1 exp t exp t exp t exp t
T t T T T τ τ τ τ ∆ ∆ ∆ = + − − − − + − − − (7)
( )
0(
max 0)
(
max 0)
'1 exp t exp t 1 exp t
T t T T T T T τ τ τ ∆ ∆ = + − − − + − − − − (8)
( )
'(
')
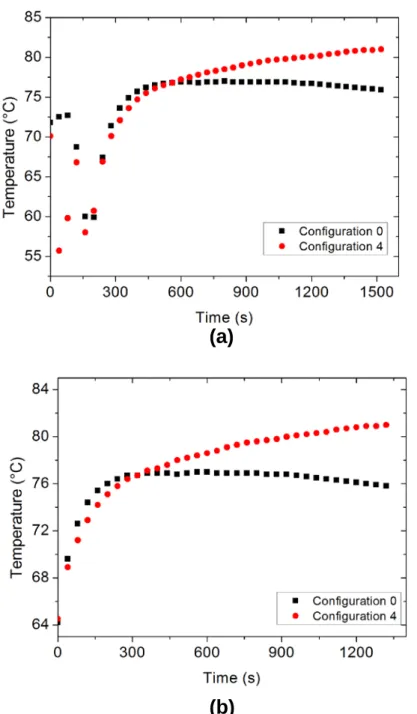
0 max 0 ' 1 exp t T t T T T τ = + − − − (9)One can conclude that equation 8 is exactly the same as equation 2. Therefore, the proposed time setting can be used in order to eliminate the effect of initial temperatures and to compare fairly the results. Figure 7 is an illustration of the application of the quantitative method on the temperature trends of Figure 6 on the car’s triangle in the rolling phase and for TFP-3.
Figure 7: Quantitative method applied on temperature variation at the triangle on the rolling phase for TFP-3.
22
on the changes in the convection regime and also in the thermal environment of each points of measurement. In general, the thermal behavior of components, air zones and engine parameters in the thermal soak phase have one of the following forms:
( )
0( )
0; T t = +T f T t (10)( )
0( )
T t = +T f t (11)( )
( )
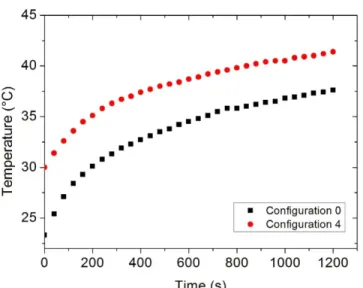
T t = f t (12)In order to be sure about the most suitable type of temperature modeling, series of experiments in wind tunnel were performed keeping the same leakage clogging configuration (all leakage zones are open) but starting from different initial temperatures. Then the temperature curves obtained at different locations in the car were analyzed and it was proved that temperature variations in thermal soak follow equation 10 [17]. Therefore and in the same manner proved above for the rolling phase, equating the initial temperatures in the thermal soak eliminates the effect of initial temperatures and only the effect of geometrical configuration is studied. Thus the quantitative method can be applied in thermal soak phase too. Figure 8 is an illustration of the application of the quantitative method on the temperature trends at the cold box side for TFP-3.
23
Figure 8: Illustration of the application of the quantitative method on the temperature trends at the cold box side for TFP-3.
Applying the quantitative method for all measurements allows a quantification of the gaps’ effect on each temperature. In this paper, a comparison between “configuration0” and “configuration4” only is shown in order to emphasis the effect of the entire gaps. Thus, Figure 9
(a)
24
shows these effects in both rolling and thermal soak phases for the different components in the engine compartment.
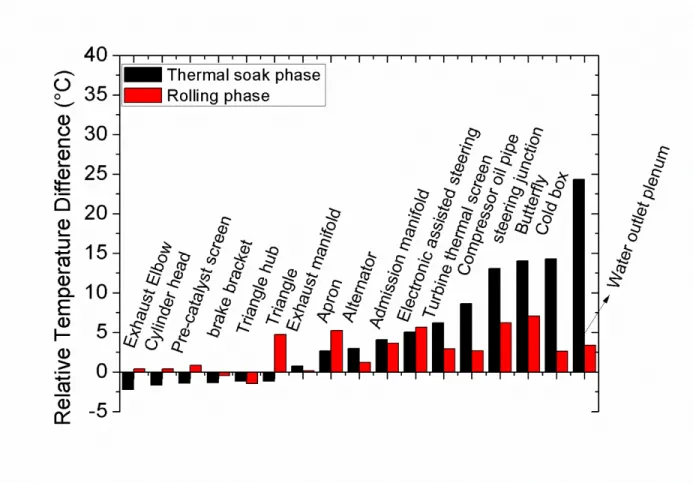
Figure 9: Relative temperature differences due to clogging all leakage zones for the different components in TFP-2.
According to Fig 9, clogging all gaps shows remarkable impact on the temperature of many components and less important effects on other components. For instance the admission manifold, the steering junction and the WOP are severely affected by the gaps’ clogging while the Cylinder Head and the triangle hub are very slightly affected. Thus, it is obviously wise to divide the measurements into 2 categories with respect to the influence of clogging the gaps according to either major or minor temperature change.
In general, the highly affected temperatures belong to components which are directly exposed to the engine heat and rather placed at the upper level in the underhood compartment.
25
This is in harmony with the natural convection flows which naturally push the heat up and warm up these locations. When the gaps were free these components were better cooled. This is true in both rolling phase and in thermal soak because the gaps ensure more airflow to swipe around these components whether the airflow comes from natural convection in the case of thermal soak or from the ventilation and the car’s speed in the case of rolling.
Another kind of comparison must be done for the highly affected organs, one by one, between the rolling phase and the thermal soak. For the most of these components clogging the gaps has an abrupt rise of temperature in the case of thermal soak where the most affected temperature is the WOP’s temperature with an increase of 24°C. In the rolling phase these components have been less warmed out. This behavior can be explained by the fact that in the rolling phase the forced convection is dominant and the airflow is not necessarily vertical. Indeed the main airflow is directed from the air inlet at the front of the car towards the wheels windows or to the downside of the vehicle. Thus the airflows through the hood’s gaps have secondary effect in cooling contrarily to the thermal soak phase where the natural convection is the only way to cool the parts and the gaps are mandatory for this convection.
On the other side, the slightly affected components can also be divided into 2 categories according to the reason which explains their low temperature variation:
1- Some of these parts are less exposed to the engine’s heat and have already low range of operational temperature as in the case of the “break bracket” or the “triangle’s hub”. For these components a higher or lesser natural convection doesn’t really affect their temperature decrease with the time which is slow in all cases.
2- Other parts are also less sensitive to the gaps’ effects but the reason is their very high thermal inertia. Indeed the high inertia results in slow cooling curves with or without natural convection
26
making it very hard to detect any differences between the clogged or the non clogged configurations. This is the case of the exhaust elbow or the cylinder head.
For the most of these parts clogging the gaps’ leads to a temperature increase in the case of rolling and have a cooling effect in the thermal soak. Nevertheless, these effects are not very clear and cannot be easily analyzed. Sometimes they are confused with the measurements uncertainties and in other cases they can be explained by some changing of airflows’ directions which yields a cooling of some zones as they have never been cooled.
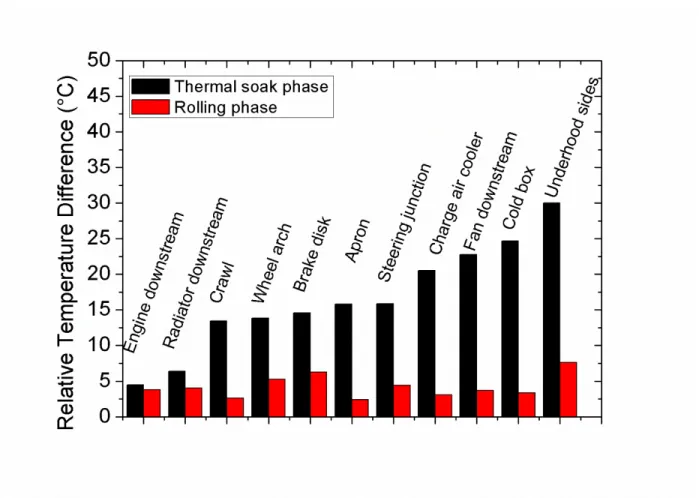
Concerning the measured temperatures in the different air zones, the effect of clogging all the gaps is shown in figure 10 which shows the relative increase of temperature in both thermal soak and rolling phase. Once more, clogging the gaps seem to have a major effect in the case of thermal soak where the most temperature rises are between 15°C and 29°C. The reason for that is again the fact that in thermal soak the natural convection is the predominant way to release heat from the underhood compartment and the gaps are the only way to ensure the flows. In the rolling phase the additional heat is lower but still important since it can reach 7°C as in the case of “AZ11” which means lower cooling capacity for the car’s parts.
27
Figure 10: Relative temperature differences due to clogging all leakage zones for the different air zones in TFP-2.
The results presented in figure 9 and figure 10 show a brief description of the effects of the gaps on the temperature field in the underhood compartment. These results are a real proof of the role of the gaps in cooling different zones and components inside the car. Designing new cars without gaps can surely enhance the aerodynamic performance while driving but this could be very dangerous for the components lifetime since they will experience higher temperature than usual especially in the phase of thermal soak. Many sensitive parts especially seals and electronics have to be much more insulated or displaced in order to be protected from the engine’s heat. The authors encourage car designers to find some innovative solutions as making
28
a new dynamic system which ensure the clogging while driving and open back the gaps whenever the car is stopped.
5. Conclusion
The present study concerned experimental simulations and physical analysis of the impact of underhood leakage zones on the aerothermal situation. The following conclusions can be drawn:
1- It was experimentally shown that the gaps surrounding the hood of a car have a significant effect on the temperature of the engine compartment. This is true during the car rolling as well as in the thermal soak. Temperature raises can reach 29°C in the air zones and 24°C in some components.
2- In the case of thermal soak, the gaps effect is much more important than in the case of rolling (a temperature raise of 24°C in thermal soak corresponds to an increase of 7°C in rolling phase). This could be explained by the airflow direction in natural convection phenomena.
3- On the other hand, the gap Hood/optical shows an inverse effect comparing to all other gaps. Indeed, clogging this gap leads to a decrease in temperature rather than an increase. This phenomenon was explained by the interference of the airflows coming from the front-end opening and passing through this joint. In fact this joint sucks the fresh air passing in its neighborhood due to a negative pressure. Clogging this gap leads to ensure much more fresh air for the engine and contribute in improving the cooling.
The results presented here were obtained on a specific commercial car (Peugeot 207) by simulating the different trips and loads the car can experience. The temperature raises may not be
29
the same for other automobiles, nevertheless the trends must be reproduced especially when they are explained with physical phenomena. Finally, these results must be treated much deeper in order to ensure relevant benefits for the airflow modeling inside cars.
30
References
[1] J. Jaguemont, N. Omar, P. Van den Bossche, and J. Mierlo, Phase-change materials (PCM) for automotive applications: A review, Applied Thermal Engineering, 132 (2018) 308-320. [2] A. Kumar and K. A. Subramanian, Control of greenhouse gas emissions (CO2, CH4 and N2O) of a biodiesel (B100) fueled automotive diesel engine using increased compression ratio, Applied Thermal Engineering, 127 (2017) 95-105
[3] J. Galindo, A. Tiseira, R. Navarro, D. Tarí, and C. M. Meano, Effect of the inlet geometry on performance, surge margin and noise emission of an automotive turbocharger compressor, Applied Thermal Engineering, 110 (2017) 875-882.
[4] J. Javier López, S. Molina, A. García, J. Valero-Marco, and F. Justet, Analysis of the potential of a new automotive two-stroke gasoline engine able to operate in spark ignition and controlled autoignition combustion modes, Applied Thermal Engineering, 126 (2017) 834-847. [5] K. Darcovich, D. D. MacNeil, S. Recoskie, and B. Kenney, Coupled electrochemical and thermal battery models for thermal management of prismatic automotive cells, Applied Thermal Engineering, 133 (2018) 566-575
[6] X. Tauzia, H. Karaky, and A. Maiboom, Evaluation of a semi-physical model to predict NOx and soot emissions of a CI automotive engine under warm-up like conditions, Applied Thermal Engineering, 137 (2018) 521-531.
[7] Fabio Fatigati, Giuseppe Bianchi, Roberto Cipollone, Development and numerical modelling of a supercharging technique for positive displacement expanders, Applied Thermal Engineering, 140 (2018) 208-216.
[8] M. Ramadan, M. Khaled, H. El Hage, F. Harambat, and H. Peerhossaini, Effect of air temperature non-uniformity on water-air heat exchanger thermal performance – Towards new control approach for energy consumption reduction, Applied Energy, 173 (2016) 481-493.
[9] M. Khaled, M. Ramadan, and H. El Hage, Innovative approach of determining the overall heat transfer coefficient of heat exchangers – Application to cross-flow water-air types, Applied Thermal Engineering, 99 (2016) 1086-1092.
[10] M. Khaled, F. Harambat, and H. Peerhossaini, Towards the control of car underhood thermal conditions, Applied Thermal Engineering, 31 (2011) 902-910.
[11] M. Khaled, F. Harambat, and H. Peerhossaini, Underhood Thermal Management: Temperature and Flux Measurements and Physical Analysis, Applied Thermal Engineering, 30 (2010) 590-598.
31
[12] A. Alajbegovic, R. Sengupta, and W. Jansen, Cooling Airflow Simulation for Passenger Cars using Detailed Underhood Geometry, SAE World Congress, SAE Technical Paper 2006-01-3478, 2006.
[13] V. Kumar, S. Kapoor, G. Arora, S. Saha, et al., A Combined CFD and Flow Network Modeling Approach for Vehicle Underhood Air Flow and Thermal Analysis, SAE World Congress, SAE Technical Paper 2009-01-1150, 2009.
[14] D. Baeder, T.Indinger, N. Adams, and F. Decker, Comparison of Numerical Simulations with Experiments of Bluff Bodies Including Under-Hood Flow, SAE World Congress, SAE Technical Paper 2011-01-0171, 2011.
[15] A. Alajbegovic, B. Xu, A.Konstantinov, J. Amodeo et al.,Simulation of Cooling Airflow under Different Driving Conditions, SAE World Congress, SAE Technical Paper 2007-01-0766, 2007.
[16] T. Juan, Investigation and Assessment of Factors Affecting the Underhood Cooling Air Flow Using CFD, SAE World Congress, SAE Technical Paper 2008-01-2658, 2008.
[17] M. Khaled, A. Al Shaer, F. Hachem, F. Harambat, and H. Peerhossaini, Effects of ground vehicle inclination on underhood compartment cooling, International Journal of Automotive Technology, 13 (2012) 895-904.
[18] M. Khaled, F. Harambat, H. Peerhossaini, Temperature and Heat Flux Behavior of Complex Flows in Car Underhood Compartment, Heat Transfer Engineering, 31 (2010) 1-11.
[19] W. Dawes, W. Kellar, S. Harvey, and N. Eccles, Automated Meshing for Aero-Thermal Analysis of Complex Automotive Geometries, SAE World Congress, SAE Technical Paper 2011-01-0523, 2011.
[20] F. Fortunato, F.Damiano, L. Matteo, and P. Oliva,Underhood Cooling Simulation for Development of New Vehicles, SAE World Congress, SAE Technical Paper 2005-01-2046, 2005.
[21] F. Varlet, and G. Millot, Aerothermal Coupling with Integrated Exchange Surfaces, SAE World Congress, SAE Technical Paper 2011-01-2508, 2011.
[22] A. Denaro, E. Prever, C. Chiarelli, and M. Antonacci, Expert Thermal Management Architecture and Aerothermal Aspects, SAE World Congress, SAE Technical Paper 2005-01-2900, 2005.
[23] I. Jeong-Guon, C. Choi, T. Kim, S. Jang, and H. Kim, Optimal design of the exhaust system layout to suppress the discharge noise from an idling engine, International Journal of Automotive Technology, 12 (2011) 617–630
32
[24] G. Zamboni and M. Capobianco, Experimental study on the effects of HP and LP EGR in an automotive turbocharged diesel engine, Applied Energy, 94 (2012) 117–128.
[25] A. Manzela, S. Hanriot, L. Cabezas-Gomez, and J. Sodre, Using engine exhaust gas as energy source for an absorption refrigeration system, Applied Energy, 87 (2010) 1141–1148. [26] S. Kim, J. Park, and M. Kim, Performance characterization of a supplementary stackcooling system for fuel-cell vehicles using a carbon dioxide air-conditioning unit,International Journal of Automotive Technology, 11 (2010) 893–900.
[27] M. Kader, Y. Youn, Y. Jun, and K. Lee, Characterization of the HVAC performance with defroster grillers and instrument panel registers, International Journal of Automotive Technology 10 (2009) 305–312.
[28] R. Palmisano and H. Ng, Design analysis and comparison between standard and rotary porting systems for IC engine,International Journal of Automotive Technology, 13 (2012) 175– 191
[29] D. Jung, K. Kwak, and D. Assanis, Integration of a single cylinder engine model and a boost system model for efficient numerical mapping of engine performance and fuel consumption, International Journal of Automotive Technology, 13 (2012) 1–7.
[30] J. Deng, Q. Fan, J. Bian, H. Lu, and L. Li, Effect of the fuel injection strategy on first-cycle firing and combustion characteristics during cold start in a TDSI gasoline engine,International Journal of Automotive Technology, 13 (2012) 523–531.
[31] H. Wei, Z. Li, X. Liang, and G. Shu, Influence of the accelerating operation mechanism on the combustion noise in DI-diesel engines,International Journal of Automotive Technology, 13 (2012) 373–388.
[32] T. Lee and Z. Filipi, Improving the predictiveness of the quasi-d combustion model for spark ignition engines with flexible intake systems,International Journal of Automotive Technology, 12 (2011) 1–9.
[33] A. Hassaneen, S. Samuel, and I. Whelan, Combustion instabilities and nanoparticles emission fluctuations in GDI spark ignition engine,International Journal of Automotive Technology, 12 (2011) 787–794.
[34] U. Azimov, K. Kim, D. Jeong, Y. and Lee, Instantaneous 2-D visualization of spray combustion and flame luminosity of GTL and GTL-biodiesel fuel blend under quiescent ambient conditions, International Journal of Automotive Technology, 12 (2011) 159–171.
[35] M. Khaled, M. Ramadan, H. El Hage, A. Elmarakbi, F. Harambat, and H. Peerhossaini, Review of underhood aerothermal management: towards vehicle simplified models, Applied Thermal Engineering, 73 (2014) 840-856
33
[36] M. Khaled, C. Habchi, A. El Marakbi, F. Harambat and H. Peerhossaini, Leakage effects in car underhood aerothermal management: temperature and heat flux analysis, Heat and Mass Transfer, 50 (2014) 1455-1464.