HAL Id: hal-01693539
https://hal.archives-ouvertes.fr/hal-01693539
Preprint submitted on 26 Jan 2018
HAL is a multi-disciplinary open access archive for the deposit and dissemination of sci-entific research documents, whether they are pub-lished or not. The documents may come from teaching and research institutions in France or abroad, or from public or private research centers.
L’archive ouverte pluridisciplinaire HAL, est destinée au dépôt et à la diffusion de documents scientifiques de niveau recherche, publiés ou non, émanant des établissements d’enseignement et de recherche français ou étrangers, des laboratoires publics ou privés.
Intellectual property rights protection and the
international transfer of low-carbon technologies
Damien Dussaux, Antoine Dechezleprêtre, Matthieu Glachant
To cite this version:
Damien Dussaux, Antoine Dechezleprêtre, Matthieu Glachant. Intellectual property rights protection and the international transfer of low-carbon technologies. 2017. �hal-01693539�
Intellectual property rights
protection and the international
transfer of low-carbon
technologies
SOUS-TITRE SOUS-TITRE SOUS-TITRE SOUS-TITRE
Damien DussauxCERNA, i3 UMR CNRS
Mines ParisTech, PSL Research University damien.dussaux@mines-paristech.fr Antoine Dechezleprêtre
Grantham Research Institute on Climate Change and the Environment London School of Economics and Political Science
a.dechezleprêtre@lse.ac.uk Matthieu Glachant
CERNA, i3 UMR CNRS
Mines ParisTech, PSL Research University matthieu.glachant@mines-paristech.fr
Working Paper 17-CER-05 Décembre, 2017
Pour citer ce papier / How to cite this paper : Dussaux, D. & Dechezleprêtre, A. & Glachant, M. (2017) Intellectual property rights protection and the international transfer of low-carbon technologies. i3 Working Papers Series, 17-CER-05.
We thank Geoffrey Barrows and Arlan Brucal for very helpful comments on a previous version. Amadou Fall Ndoye provided excellent research assistance. The research leading to these results was supported by the Swiss National Science Foundation under the Sinergia programme, Project No CRSII1_147612; the Centre for Climate Change Economics and Policy; the Grantham Foundation for the Protection of the Environment.
2 L’institut interdisciplinaire de l’innovation
(UMR 9217) a été créé en 2012. Il rassemble :
• les équipes de recherche de MINES ParisTech en économie (CERNA), gestion (CGS) et sociologie (CSI), • celles du Département Sciences Economiques et Sociales (DSES) de Télécom ParisTech,
• ainsi que le Centre de recherche en gestion (CRG) de l’École polytechnique, soit plus de 200 personnes dont une soixantaine d’enseignants chercheurs permanents.
L’institut développe une recherche de haut niveau conciliant excellence académique et pertinence pour les utilisateurs de recherche. Par ses activités de recherche et de formation, i3 participe à relever les grands défis de l’heure : la diffusion des technologies de l’information, la santé, l’innovation, l’énergie et le développement durable. Ces activités s’organisent autour de quatre axes :
• Transformations de l’entreprise innovante • Théories et modèles de la conception • Régulations de l’innovation
• Usages, participation et démocratisation de l’innovation
Pour plus d’information : http://www.i-3.fr/
Ce document de travail est destiné à stimuler la discussion au sein de la communauté scientifique et avec les utilisateurs de la recherche. Son contenu est susceptible d’avoir été soumis pour publication dans une revue académique. Il a été examiné par au moins un referee interne avant d’être publié. Les considérations exprimées dans ce document sont celles de leurs auteurs et ne sont pas forcément partagées par leurs institutions de rattachement ou les organismes qui ont financé la recherche.
The Interdisciplinary Institute of Innovation (UMR 9217) was founded in 2012. It brings together:
• the MINES ParisTech economics, management and sociology research teams (from the CERNA, CGS and CSI),
• those of the Department of Economics and Social Science (DSES) at Télécom ParisTech, • and the Management Research Center (CRG) at Ecole Polytechnique,
meaning more than 200 people, including 60 permanent academic researchers.
i3 develops a high-level research, combining academic excellence and relevance for the end users of research. Through its teaching and research activities, i3 takes an active part in addressing the main current challenges: the diffusion of communication technologies, health, innovation, energy and sustainable development. These activities are organized around four main topics:
• Transformations of innovating firms • Theories and models of design • Regulations of innovation
• Uses, participation and democratization of innovation
For more information: http://www.i-3.fr/
This working paper is intended to stimulate discussion within the research community and among research users. Its content may have been submitted for publication in academic journals. It has been reviewed by at least one internal referee before publication. The views expressed in this paper are those of the author(s) and not necessarily those of the host institutions or funders.
3 ABSTRACT :
We examine the effect of intellectual property rights (IPRs) protection on the two main channels of international transfer of low-carbon technologies i.e. trade in low-carbon capital goods, and foreign direct investments (FDI) by firms producing low-carbon technologies. Our data describes cross-country transfer through these channels between developing and developed countries in eight climate-related technology fields from 2001 to 2011. At the world level, we find that strengthening IPRs protection increases transfer in six technology fields (hydro power, solar PV, solar thermal, heating, lighting, and cleaner vehicles), while the effect is statistically insignificant in the others. The results slightly change when focusing on non-OECD countries. In particular, we find that a stricter IPRs regime may reduce their imports of solar equipment. These results have important implications for climate negotiations on North-South technology transfer.
KEYWORDS :
Climate change; Technology transfer; Intellectual property rights; International trade; Foreign direct investment.
4
Wide access to clean technologies is crucial to meet the Paris Agreement goal of limiting the increase in global temperatures to well below 2 degrees Celsius.1 This requires considerable
technology transfers, in particular from North to South, as 90% of the increase in global carbon emissions until 2050 is expected to occur in the developing world (OECD, 2012) while the vast majority of low-carbon technologies are still invented in developed countries. As an illustration, Japan, USA, Germany, South Korea, and France together account for 75% of the low-carbon inventions patented from 2005 to 2015.2 Technology transfer is also key to reducing the total
abatement costs of climate change policies.
The importance of technology transfer in global climate change mitigation efforts explains why the international diffusion of low-carbon technologies has been a cornerstone of international climate negotiations since the adoption of the United Framework Convention on Climate Change (UNFCCC). In practice, green technology transfer mostly takes place through two channels, i.e. international trade in capital goods that are used to reduce emissions (e.g. wind turbines, energy efficient furnaces, electric vehicles), or foreign direct investment (FDI) by multinational enterprises that own low-carbon technologies (Glachant and Dechezleprêtre, 2017). The flows of technology transfer through these channels have many determinants and are influenced by different sets of policies, e.g. trade and investment policies, environmental regulation, etc. Nonetheless, international negotiations have extensively revolved around the role of intellectual property rights (IPRs).3
International discussions over IPRs are contentious. On the one hand, developed countries see a strong IPRs regime as a necessary condition for technology transfer. In their view, technology owners would not transfer technologies if they could not appropriate the related benefits. On the other hand, some developing countries (e.g. India) consider that strong IPRs protection may hinder technology transfer (Abdel-Latif, 2015; Glachant and Dechezleprêtre, 2016). The argument is that strong IPRs would prevent developing countries from accessing green technologies at an affordable price since monopoly rights associated with IPRs provide innovators with important market power. This debate echoes the theoretical analysis by Maskus (2000) who identifies two countervailing effects of strong IPRs protection, i.e. a positive market expansion effect because stronger IPRs create a market for foreign firms whose intellectual assets are secured; and a negative market power effect because stronger IPRs leads to higher prices. Given these two opposing effects, the net impact of stronger IPRs protection is an empirical question.
1 The agreement is the result of the United Nations Framework Convention on Climate Change (UNFCCC)
Conference of the Parties (COP) held in Paris in 2015.
2 Authors’ calculations based on the PATSTAT database. The concentration of climate mitigation R&D in a
handful of countries is well established (see e.g. Dechezleprêtre et al., 2011).
3 The other main subject has been the financing of technology transfer. To a lesser extent, other policy
rules have also been discussed, such as tariffs and non-tariff barriers to trade and to FDI, climate regulation stringency and technological capacity buildings. Outside of the UNFCCC framework, since 2014, 17 WTO members have been negotiating an Environmental Goods Agreement (EGA) that aims to remove or drastically reduce tariff barriers applied to environmental goods.
5
The necessity of greater international technology transfer has led to the creation of the Technology Mechanism, which organizes UNFCCC efforts related to technology issues. Though the Technology Executive Committee, the policy arm of the mechanism, acknowledged during the 2012 Doha Conference of the Parties (COP) that the role of IPRs should be clarified, it has not delivered any policy recommendations on the design of a climate-friendly IPRs regime (de Coninck and Sagar, 2015).4 During preparations for the Paris COP-21, some countries made
suggestions, such as making specific technologies available at concessional terms to developing countries.5 However, ultimately, the Paris Agreement did not make any mention of intellectual
property rights, indicating the lack of consensus on this subject.
Against this background, the main objective of this paper is to inform the policy debate with empirical evidence on the effect of IPRs on the international transfer of low-carbon technologies. More specifically, we carry out a country-level panel data analysis to estimate whether increasing the level of IPRs protection in recipient countries increases or decreases (i) international trade in low-carbon capital goods and (ii) foreign direct investment by firms owning low-carbon technologies.6 The level of IPRs protection is measured by a synthetic index initially
created by Park (2005) and recently updated, which aggregates several components of intellectual property protection such as extent of coverage, membership in international IP-related treaties, duration of protection, absence of restrictions on rights, and statutory enforcement provision (see also Park and Lippoldt, 2008).
In addition, we examine how the impact of IPRs varies between OECD and non-OECD countries and how the absorptive capacities of the recipient country influence the marginal effect of IPRs on technology transfer.7 In the economic literature, these capacities are defined as the ability of
the recipient country to successfully absorb foreign technologies and they include various factors such as the availability of skilled technical personnel and information on available technologies (Fagerberg, 1994; Keller, 1996; Worrell et al., 1997; Griffith et al., 2004; Kneller and Stevens, 2006). Weak capacities are predicted to decrease the market expansion effect of strong IPRs, the intuition being that if domestic firms have weak technical capabilities, they will not be able to imitate the technologies, even if IPRs protection is weak (Maskus and Penubarti, 1995). In our context, this theoretical assumption may have crucial policy implications. If valid, it implies that developing countries, which typically have weaker absorptive capacities, would benefit less from strengthening IPRs. We use our data to directly test this prediction.
Methodologically, we adopt a fixed-effects panel data approach where we exploit annual variations in technology-specific trade or FDI flows within a given country pair to identify how the level of IPRs protection in the recipient country affects technology transfer. Data on cross-country trade flows are extracted from the CEPII’s international trade BACI database. The
4 The mandate of the TEC is to facilitate collaboration on technology transfer between governments, the
private sectors, non-profit organisations, and the academic world.
5 Other proposals were made in the July 2015 Ad hoc Working Group on the Durban Platform for Enhanced
Action (ADP) draft negotiation text.
6 A third channel of technology transfer is licensing. We do not cover it here, mainly because data on the
international flow of royalty payments are lacking. We argue that this is not highly problematic given that the significance of licensing in global GDP is tiny (0.4%) compared with international trade (23.7%) and FDI (2.6%) over the 2010-2014 period (World Bank Indicators, 2016).
7 As pointed out by Forero-Pineda (2006), some studies fail to account for the differences between
6
database provides information on annual product-level shipments from exporters to importers at the 6-digit level of the harmonized system nomenclature. We exploit this high level of detail to precisely identify traded equipment corresponding to eight low-carbon technologies, i.e. hydroelectricity, solar PV, solar thermal, wind power, energy-efficient heating, insulation, energy-efficient lighting, and cleaner vehicles. We cover yearly trade flows from 2001 to 2011 between up to 92 countries accounting for 92% of global trade in low-carbon goods.8
Importantly, the data set includes both industrialised countries and emerging economies such as India and China.
To measure FDI flows in low-carbon technologies, we rely on firm-level data on investment deals from Bureau Van Dijk’s Zephyr database. The main challenge is that the data do not indicate whether a particular deal entails a transfer of low-carbon technologies. We only know the investing firm, the target firm, and their industry. We implement a two-stage procedure to identify deals that are likely to involve low-carbon technology transfers. In the first step, we match our FDI data with the World Patent Statistical Database (PATSTAT), a database which includes close to the population of patents filed in the world over recent decades. A useful characteristic of PATSTAT is its very detailed patent classification system, which allows us to identify patents protecting low-carbon technologies. We then identify FDI deals in which the investing firm owns at least one low-carbon patent. In the second step, we exclude deals where the target firm belongs to an industry that is unambiguously unrelated to the low-carbon technology considered.9 Ultimately, we obtain data on the 8 technologies covered by the trade
data and up to 67 countries observed yearly between 2001 and 2011.10
A first result is that strengthening IPRs protection has a statistically significant positive effect on the transfer of most low-carbon technologies. This applies to the imports in hydro and cleaner vehicles and to FDI in solar PV, solar thermal, heating, lighting, and cleaner vehicles. However, this average effect hides important heterogeneity across countries. The effect of IPRs stringency on FDI towards non-OECD countries is positive and significant for several technologies (solar PV, wind power, and cleaner vehicles), and not statistically significant for the others. However, we also find contrasted impacts on trade. In particular, our estimates suggest that increasing the strictness of IP regimes could reduce imports of solar PV and solar thermal equipment toward non-OECD countries. Note that this is not necessarily bad news if this indicates that the recipient country is able to substitute imported technologies with domestic innovation. In general, we find that the marginal effect of IPRs is higher when the recipient country has larger absorptive capacities, indicating lower effectiveness of strengthening IPRs on technology transfer in countries with low technical capabilities.
To get a sense of the magnitude of these effects, we perform a simulation predicting the impact of an increase in IPRs protection to reach the global median level, which roughly corresponds to the level of IPRs protection in China in 2010. Focusing on technologies that are statistically
8 More precisely, the estimation sample differs for each technology and contains up to 92 exporting
countries and 62 importing countries.
9 For instance, if the investing firm owns a patent related to solar PV, we exclude target firms operating in
industries such as “Manufacture of perfumes and toilet preparations” or “Manufacture of bodies for motor vehicles” but retain target firms operating in the energy production sector.
10 More precisely, the estimation sample differs for each technology and contains up to 67 investing
countries and up to 43 recipient countries. These pairs of countries account for 94% of the deals reported in the entire Zephyr database.
7
significantly sensitive to changes in IPRs protection, we show that imports of equipment to India are predicted to grow by 17% for insulation materials. The effect is greater for FDI, with a predicted increase of 45% for solar PV, 62% for wind, and 47% for cleaner vehicles. There is also a substantial negative effect equal to -31% for heating, due to India’s weak absorptive capacities in this domain.11 In short, if big emitters like India and Mexico were to converge to the Chinese
level of IPRs protection, it would make a significant difference in terms of technology inflows. Given that the effect of IPRs may go in either direction, the policy implication here is that any potential adjustment of the level of IPRs protection should be made on a case-by-case basis. Our paper makes a significant contribution to the limited literature on the relationship between IPRs protection and low-carbon technology transfer. Most of this literature provides anecdotal evidence and descriptive statistics on the issue (e.g. Barton, 2007; Kirkegaard et al., 2009; Dechezleprêtre et al., 2011; Ockwell et al., 2008; Glachant et al. 2013). To the best of our knowledge, Dechezleprêtre et al. (2013) is the only existing econometric study dealing with the impact of IPRs (among other drivers) on the international diffusion of low-carbon technologies. The authors rely on a different measure of technology transfer, i.e. the size of technology flow from country i to country j is measured by the number of patents protecting inventions developed in country i and filed in country j. The main limitation of this patent-based measure is that inventors do not only rely on patents to protect innovation. Existing surveys even show that they prefer trade secrecy when feasible (Cohen et al., 2000). It is then expected that reinforcing IPRs will increase patenting, but this result may not necessarily reflect higher technology flows. It might simply correspond to inventors switching from trade secrecy to patenting as a way to protect their knowledge, even if there is evidence that outbound international patenting for a specific country is positively correlated with the magnitude of exports and outward foreign direct investments toward the destination country (Yang and Kuo, 2008). Similarly, while a patent grants the exclusive right to use a technology in a given country, it does not imply that the patent owner will actually use the technology in that country. Compared to patent-based measures, our unique dataset on cross-country flows of trade and FDI are arguably a better measure of the actual volume of low-carbon technology transfer between countries.
Our paper also relates more generally to the vast literature on the role of IPRs in international technology transfer. We contribute to this literature by focusing on an array of previously unstudied sectors and by considering both trade and FDI as channels for technology transfer. With a few recent exceptions (e.g. Ivus, 2010; Boring, 2015; and Campi and Dueñas, 2016), the majority of existing studies cover the entire manufacturing sector (Bosworth, 1980; Ferrantino, 1993; Maskus and Penubarti, 1995; Maskus, 1998b, Braga and Fink, 1998, 1999; Smith, 1999, 2001; Co, 2004; Nunnenkamp and Spatz (2004); Delgado, Kyle, and McGahan, 2013) and usually consider only one channel – either trade or FDI. However, it is not possible to extrapolate their results to climate mitigation technologies, as the trade-off highlighted by Maskus (2000) between market expansion and market power is fundamentally determined by industry- and technology-specific variables. From a methodological point of view, our paper presents several strengths compared to most of the existing literature. We estimate technology-specific gravity models with country-pair fixed effects, which control for many unobserved determinants of trade and for technological specificities. On this methodological ground, the present study only compares to the most recent works by Boring (2015) and Campi and Dueñas (2016).
8
The paper is organised as follows. Section 2 presents the conceptual framework on property rights and the international transfer of technologies. In Section 3, we explain our empirical strategy. We provide the data sources and descriptive statistics in Section 4. Econometric results are described in Section 5. We conclude in Section 6.
2.1. The channels of international technology transfer
The term “technology transfer” is somewhat confusing, for it may refer to either the transfer of intangible knowledge or the transfer of certain tangible goods in which knowledge is embedded.13 These two categories ultimately relate to two levels of access to a technology, i.e.
(i) purchasing and using tangible goods, which enable the buyer to reap the benefit provided by the technology, (ii) possessing the specific knowledge to reproduce or repair tangible goods. The latter obviously corresponds to a higher amount of technology transfer.
The diversity of channels through which knowledge crosses borders is the second reason why technology transfer is inherently difficult to measure. In many cases, transfer is mediated by markets. It is then usual to distinguish between three main market channels, which include international trade in intermediate goods, and FDI (see Table 1). Importing capital goods, such as machines and equipment, entails technology transfer because they embody technologies that yield productivity benefits to the recipient countries. As mentioned above, international trade however induces little cross-border transfer of knowledge as such, simply because the knowledge remains in the originating country and is directly exploited there. Nonetheless, there is evidence that trade generates knowledge spillovers through reverse engineering and business relationships within the recipient economy (Rivera-Batiz and Romer, 1991). As a consequence, trade in pollution control equipment has long been used in the literature to analyse technology transfer for environmental technologies (see e.g. Lanjouw and Mody, 1996).
Foreign direct investment is a second market channel, as multinational enterprises typically transfer firm-specific technology to their foreign affiliates or partners in joint ventures. FDI conveys more knowledge than trade since the local production of goods or services by the subsidiary requires having access to know-how and coded knowledge. As a consequence, FDI also generates a larger amount of spillovers, especially via the domestic circulation of skilled labour. There is strong empirical evidence that FDI causes the diffusion of technology and productivity growth in recipient countries (Lee and Mansfield, 1996; Xu, 2000; Branstetter et al., 2001, 2006; Görg and Strobl, 2005; Griffith et al., 2006; Haskel et al., 2007; Blalock and Gertler, 2008; Keller and Yeaple, 2013).
12 This section draws heavily on Glachant et al. (2013) and Ménière et al. (2017). See also Keller (2004) for
a review on international technology diffusion.
13 While we adopt the definition of technology transfer used in economics, it is important to note that this
9
The last channel of technology transfer14 – and the most direct – is technology licensing, when
corporations or public research bodies grant a patent licence to a company abroad that uses it to upgrade its own production. This is the most knowledge-intensive form of transfer, as turnkey information is transmitted to an entity in exchange for royalty payments.
Table 1: Characteristics of international technology transfer market channels
Transfer channel Knowledge location Spillover mechanisms in the recipient country
Knowledge intensity and imitation threat Legal Geographical
Export of
intermediate goods
Source company
Source country Reverse engineering Business relationships + Foreign direct investment Source company
Recipient country Reverse engineering Business relationships Labour circulation
++
Licensing Customer Recipient country Reverse engineering Business relationships Labour circulation Customer opportunism
+++
Source: Glachant et al. (2013)
In this paper, we deal with the two largest channels of technology transfer, i.e. trade in intermediate goods and FDI. However, this is not very restrictive. In practice, licensing mostly concerns three sectors – chemicals, drugs, and electronics and electrical equipment (Anand and Khanna, 2000) – which do not contribute significantly to carbon emissions abatement. Moreover, evidence shows that technology transfers via licensing are of a much smaller magnitude than trade and foreign direct investment. Flows (sum of revenue and expenditure) of "technology balance of payments" for the period 2010-2014 represented about 0.4% of global GDP, against 2.6% and 23.7% respectively for FDI and exports of goods and services (World Bank Indicators, 2016).15
Another restriction of the present study is that we do not deal with transfers that take place without any market transaction. These spillovers arise for example when a manufactured good is reverse engineered or when researchers examine a published patent. This does not pose a problem if one assumes that non-market transfers are positively correlated with market transfers. This assumption is reasonable: reverse engineering, for instance, is likely to be positively correlated to trade volumes.
14 Circulation of skilled labour between firms is another frequently mentioned market channel of
technology transfer, but data on international movement of skilled workers do not exist at a disaggregated sector level to our knowledge.
15http://data.worldbank.org/. However this indicator should be considered as an upper bound of the
magnitude of technology licensing. Indeed, it also includes items that are not related to technology, such as royalties on trademarks or copyrights. Moreover, part of the patent royalties reflects intra-group transfers between entities of the same corporations in different countries: they are likely to proceed from tax optimisation strategies rather than actual technology transfers.
10
2.2. The impact of intellectual property rights on international technology
diffusion
The primary role of intellectual property rights is obviously to provide innovators with greater incentives to innovate, as knowledge has public good features. IPRs are not fully excludable in the sense that other economic agents may imitate the new technology, or at least learn from it, thereby appropriating a share of the innovation benefits. Trade secrecy is the most natural strategy for innovators to prevent imitation, and the most widely used in practice (Cohen et al., 2000). It is however not perfect. In particular, imitators can rely on reverse engineering when the technology is embodied in a product. Skilled workers can circulate between firms, taking their knowledge with them. The cost of maintaining trade secrets can also be high.
Granting intellectual property rights provides a policy solution to partly internalise these knowledge externalities. A patent ensures the exclusivity of the commercial use of the invention for a determined period of time (typically 20 years). However, in order to compensate for the detrimental impact of market power, the patent owner must disclose information about the invention that then becomes available to all. The objectives here are to secure benefits for innovators, but also to give other innovators the possibility to use the patented inventions as inputs to generate new inventions before the patent terminates.
The role of patents in easing the commercialisation of new technologies can be especially strong in foreign markets, thereby promoting international technology diffusion. Appropriation is indeed more difficult abroad due to differences in legal systems and other factors. Foreign suppliers of technologies incur additional costs to monitor how partner firms and licencees use their technology (Keller and Yeaple, 2013). Contractual problems are also likely to be greater if the supplier and buyer of the technology operate in different countries. For instance, Antras and Rossi-Hansberg (2009) suggest that weak contract enforcement lowers the amount of technology transfer through outsourcing.
As a result, the effect of IPRs protection on international technology transfer is ambiguous (Maskus, 2000): stronger IPRs have a negative market power effect, giving innovators the possibility to raise price barriers; but also a positive market expansion effect because stronger IPRs ease the commercialisation of technologies in foreign markets. With these two effects going in opposite directions, the net impact of stronger IPRs on technology transfer is an empirical question. The size (and sign) of the net impact is likely to vary across technologies because it is determined by industry-specific and technology-specific variables, such as the degree of competition and the practical methods to imitate the technology. This justifies our methodological choice of estimating technology-specific equations. More generally, it also justifies a specific study of low-carbon technologies, as the results obtained in different sectors are not transferable. For similar reasons, the net impact has no reason to be identical across different transfer channels.
The characteristics of recipient countries can also generate heterogeneity in the effect of stronger IPRs. In particular, Maskus and Penubarti (1995) argue that it is likely that the market expansion effect is greater in economies with stronger absorptive capacities. The ability of countries to recognise, assimilate and apply new knowledge depends on factors such as the availability of researchers and engineers, a high number of past innovations, and high private and public R&D expenditures (Fagerberg, 1994; Keller, 1996; Worrell et al., 1997; Griffith et al., 2004; Kneller and Stevens, 2006). Strong absorptive capacities de facto mean strong imitation
11
capabilities. This implies that IPRs are more effective in securing innovation returns, and thus in providing incentives to transfer technologies, in countries with high capacities. Maskus and Penubarti (1995) arguably find some empirical evidence that the effect of IPRs is greater in developed economies than in developing countries for most of the manufacturing industries they cover.2.2.
Because low-carbon technologies are highly heterogeneous, we perform regressions at the level of each technology. To estimate the effect of IPRs protection on bilateral trade in low-carbon goods and FDI in a given low-carbon technology, we estimate the following gravity model:
= exp + + + + + (1)
where denotes either the shipment value of low-carbon goods embedding technology k exported from country i to country j during year t or the number of FDI deals in low-carbon technology k made between parent companies located in country i and target companies located in country j in year t. is the index of intellectual property rights protection in the importing country j, which we describe in detail below.
Following Anderson and van Wincoop (2003), we exploit the panel structure of our dataset by using a fixed-effects estimator. This allows us to control for any time-invariant characteristics denoted by that could be correlated with both and our dependent variables. includes all time-invariant country-pair characteristics typically used in gravity models, i.e. distance between the two countries, contiguity, common language, colonial ties, etc. as well as importer characteristics such as type of institutions, type of regulations, industrial structure of the economy, development level, etc. In addition, we include a comprehensive set of year dummies to account for shocks common across all countries. As a result, we rely on annual variations in technology-specific trade or FDI flows within a given country pair for identification. Using a fixed-effects estimator, there might still be factors that vary over time and that could be correlated with both and the dependent variable. Therefore, we include a set of time-varying control variables in . Some controls are common to the trade model and the FDI model. First, we control for the size and income of the exporting/investing country and the recipient country using GDP and GDP per capita, which is standard in gravity equations. Second, we control for the recipient country’s absorptive capacities, since this can influence the transfer of technologies and is likely correlated with IPRs protection. These capacities are measured by a composite index aggregating four indicators, i.e. enrolment in tertiary education, share of GDP allocated to R&D, share of researchers in the population, and the (discounted) stock of patented inventions per unit of GDP. We provide more details on this index in subsection 4.4. Third, we add the IPRs protection of the exporting/investing country because exporting/investing firms may react differently to recipient countries’ IPRs protection depending on the IPRs protection in their country of origin. Finally, we control for whether the two countries have a free trade agreement in place or whether they belong to the same custom union in year t.
We also use control variables that are specific to each model. In our trade model, we control for the importer’s effectively applied tariff rate and the number of non-tariff measures for the
low-12
carbon technology considered.16 In our FDI model, we include traditional determinants of
inward FDI, which include the flexibility of business and labour regulations and the intensity of border regulations on the movement of capital and people. Table 15 in the Appendix provides the definition and the source of all variables.
Because trade flows are included in GDP, some of the controls may be endogenous. Consequently, we lag all regressors by one year. This mitigates endogeneity since
should be less correlated with than .
In subsection 2.2, we explained that the impact of IPRs protection could vary depending on several characteristics of the recipient countries. To test for the existence of heterogeneous effects, we augment model (1) by introducing an interaction term between the recipient country’s IPRs protection and a dummy variable as follows:
= exp + + ! × + + + + #
(2)
where denotes either OECD membership, or strong absorptive capacities in technology k. The distinction between non-OECD and OECD countries is relevant here because technology transfer matters more for developing countries, which have high GHG abatement potential, than it does for developed countries, which produce most climate mitigation technologies. Following on from the theoretical insights mentioned above, a look at absorptive capacities indicates that the effectiveness of IPRs increases with recipient countries’ imitation capacities.
Following Silva and Tenreyro (2006), models (1) and (2) are estimated by the Pseudo Poisson Maximum Likelihood (PPML) estimator for two reasons. First, the PPML estimator is less biased than the log-log OLS estimator under different assumptions regarding the data-generating process of the error term. Second, PPML, unlike OLS, accounts for outcomes equal to zero, which is a natural result of the Poisson distribution. These observations are dropped when a log-log transformation of model (1) and (2) is applied.
16 We use effectively applied tariff rates, which take into account the existence of bilateral trade
agreements, as opposed to most favoured nation tariff rates, which are the maximum tariff rate applied by one WTO member to another WTO member.
13
4.1. Bilateral trade in low-carbon goods
We use shipment value between countries as a measure of technology transfer. Trade data come from the BACI database developed by the Centre d’Etudes Prospectives et d'Informations Internationales (CEPII), which reports bilateral trade between countries at a highly disaggregated product level.BACI is based on the United Nations COMTRADE database. BACI's major advantage over the original COMTRADE is its ability to provide harmonised and more reliable bilateral trade data by matching declarations between exporting and importing countries.17We use the description provided by the 6-digit level of the harmonised system
classification of products in BACI to identify equipment goods that incorporate technologies mitigating greenhouse gas emissions. 18
We cover eight low-carbon technology classes across different sectors of the economy. Table 2 lists these technology classes. In the power generation sector, we cover hydro power, solar PV, solar thermal, and wind power. The dataset also includes energy efficiency technologies used in the residential sector, such as heating, insulation, and lighting. In the transportation sector, we cover electric and hybrid vehicles hereafter referred to as cleaner vehicles. Appendix A includes a detailed description of these technologies (see Table 12) as well as their harmonised system codes and their description (see Table 13).
Although the dataset is representative of a variety of technologies and sectors, it is by no means comprehensive. An important restriction is the absence of carbon mitigation technologies used in agriculture or forestry (e.g. soil restoration, reforestation, grassland management). The main reason is that their transfer is not associated with trade in equipment goods. Process-integrated energy-saving technologies used in the manufacturing sector are also missing. These technologies are arguably embedded in equipment goods, but the product classification is not detailed enough to identify them in BACI data. For instance, the code 841780 corresponds to “industrial/laboratory furnaces & ovens” but no difference is made between energy-efficient and inefficient ovens.
Lastly, due to missing data on our main explanatory variables, our final sample covers trade data for 62 countries between 2001 and 2011.19 This accounts for around 92% of global trade in the
selected technologies.
4.2. Foreign direct investment in low-carbon goods
In contrast with trade data, accessing reliable FDI data at a disaggregated sectoral level is much more complicated, particularly when they are required for developing countries, like in the present study. The construction of this data set is thus an important contribution of our paper.
17 See Gaulier and Zignago (2010) for more details.
18 We choose the 1996 version of the Harmonized System to maximise the number of years for which
low-carbon goods are reported in the data.
14
We extract foreign direct investment data from the financial database Zephyr, provided by Bureau Van Dijk under a commercial licence.20 Zephyr provides information on investment deals
between acquiring companies and target companies. We use the number of investment deals between companies in the source country and companies in the recipient country in year t as an indicator of the intensity of FDI between country pairs. In theory, we would prefer using the volume of investments, but this information is often missing, particularly for non-OECD countries. We use only completed deals of any kind including acquisitions, capital increases, minority stakes and share buybacks.
As mentioned in the introduction, the difficulty lies in identifying deals that presumably entail the transfer of a low-carbon technology. We apply two filters to select these deals. The first consists in selecting deals where the investing firm has filed at least one low-carbon patent in the recipient country. This is based upon the presumption that a firm only files a patent in a foreign country if it plans to commercially exploit the technology there.21
Low-carbon patents are extracted from PATSTAT, maintained by the European Patent Office. We select patents classified under the “Y02” category developed by the European Patent Office and applied to all patents in PATSTAT. The Y02 category provides the most accurate tagging method of climate change mitigation patents available today, and is the international standard for innovation studies in green technologies. We select patents that are related to the technologies included in the trade data. Table 2 provides the list of technology fields covered. The detailed description of the technologies is available in Table 12 of Appendix A. These low-carbon patents are then matched with Zephyr to identify the relevant investing firms. We thus obtain an indicator of FDI at the technology level, which makes it possible to compare the impact of IPRs on the two transfer channels.
The second filter applies to the target firms. We keep deals in which the target firms belong to an industry related to the technology. We match industry codes and low-carbon technologies based on the industry’s label and the description of the patent category in Table 12.22 For
instance, the description of the Solar PV category is “Solar photovoltaic (conversion of light radiation into electrical energy), including solar panels”. Target firms operating in industries such as “2611 - Manufacture of electronic components” or “3511 - Production of electricity” are included in the computation of FDI deals related to Solar PV, while firms operating in “2751 - Manufacture of electric domestic appliances” are not. Table 14 provides the list of industry codes selected for each low-carbon technology.
In Zephyr, there exist several country pairs exist with no deal in a given year. It is, however, risky to infer that zero deals take place in reality: although Zephyr is one of the most reliable data sources of its kind, it does not claim to cover every single deal. Our general strategy is therefore to assume that the value is missing. We do however introduce an exception: we assume a zero when we observe deals for the same country pair in the preceding and following years. For instance, if we observe deals between Hungary and Poland in 2009 and 2011, but not in 2010,
20 See http://www.bvdinfo.com/en-gb/our-products/economic-and-m-a/m-a-data/zephyr for more
information.
21 For a discussion of foreign patenting strategies and how they relate to technology transfer, see
Dechezleprêtre et al. (2013).
22 Zephyr provides the Statistical Classification of Economic Activities in the European Community (NACE)
15
then we assume that the value for this country pair is 0 for 2010. The intuition is that observing deals before and after 2010 implies that Zephyr has the capacity to monitor deals in these countries. Our regressions results are, however, not sensitive to this choice. The final FDI sample contains 37 recipient countries observed yearly between 2001 and 2011.23
Figure 1 plots the imports of low-carbon capital goods and the number of inward FDI deals in low-carbon technologies by recipient country. We see that the two channels of transfer are highly correlated. Unsurprisingly, larger countries receive more FDI and import more low-carbon equipment. Note also that the situation of emerging economies is heterogeneous: a significant amount of transfer already takes place towards China but much smaller transfers occur towards Mexico and India in spite of the size of their economies (but with a lower IPRs protection than China).
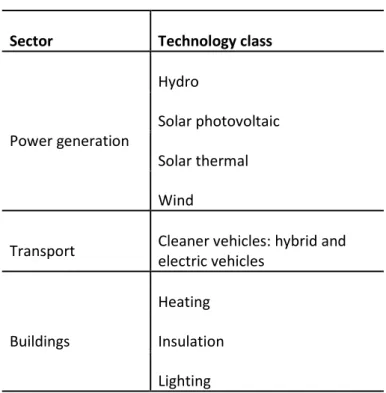
Table 2: List of low-carbon technologies covered
Sector Technology class
Power generation
Hydro
Solar photovoltaic
Solar thermal
Wind
Transport Cleaner vehicles: hybrid and electric vehicles
Buildings
Heating
Insulation
Lighting
Note: Table 12 provides a detailed description of these technology fields in Patstat and Table 13 provides a harmonized system list of low-carbon capital goods for each technology.
16
Figure 1: Amount of technology transfer by recipient and by channel
Notes: author calculation based on BACI, Zephyr, and Patstat. Values are summed over the
technologies and over 2001-2011.
4.3. Intellectual property rights protection
In order to measure the degree of intellectual property rights protection, we follow Maskus and Yang (2013) by combining two indices, i.e. the IPRs index by Park and Lippoldt (2008)and the Fraser Institute’s legal system index. We do so because a weak legal system de facto implies weak patent rights, regardless of a country’s IPRs strictness.
Park and Lippoldt (2008)’s index is an extension of Ginarte and Park (1997) and Park and Wagh (2002) that takes into account the patentability of new technological fields like software and biotechnology.24 It is widely used in the literature. It ranges from zero (weakest) to five
(strongest). This value is determined by the summation of five components: (i) extent of coverage, (ii) membership in international treaties, (iii) duration of protection, (iv) absence of restrictions on rights, and (v) statutory enforcement provision.
The legal systems index is extracted from the Fraser Institute’s annual reports on the economic freedom of the world.25 It is a composite index between 0 and 10 built from other indices and
including legal enforcement of contracts, judicial independence, impartial courts, and the
24 Note that Maskus and Yang (2013) use Ginarte and Park (1997)’s index. Park (2008) describes in detail
how the Ginarte and Park (1997) index has been extended.
25 See Gwartney et al. (2014) for more details.
ARG AUSAUT BEL BGR BRA CAN CHE CHN CZE DEU DNK EGY ESP EST FIN FRA GBR HKG HUN IDN IND IRL ISL ISR ITA JPN KOR LTU LVA MAR MEX MYS NLD NOR NZL PER PHL POL PRT ROU RUS SGP SVK SVN SWE TUR USA ZAF 1 2 1 3 1 4 1 5 1 6 1 7 1 8 1 9 2 0 Im p o rt s v a lu e o f lo w -c a rb o n c a p it a l g o o d s ( lo g s c a le ) 0 1 2 3 4 5 6 7
17
integrity of the legal system. In practice, we multiply the IPRs index by the legal systems – which are complements – and rescale the product from 0 to 10.
Figure 2 of Appendix B shows the variation in IPRs between countries by plotting the IPRs protection index against GDP per capita. As expected, on average richer countries have higher IPRs protection. We also observe much greater variation between developing countries than between developed countries.
Table 3 shows the distribution percentiles of the variation in IPRs within countries over time measured by the ratio between IPRs protection in 2010 and IPRs protection in 2000. 40% of countries exhibit a change greater than 13%, while 25% of countries reduce their IPRs protection by at least 8%. This variation is important because our fixed-effects approach only exploits this within-country variation for identification.
Table 3: Within-country variation in IPRs protection
5% 10% 25% 40% 50% 60% 75% 90 95%
-26% -22% -8% -3% 4% 13% 25% 47% 81%
Note: % change between IPRs protection in 2010 and IPRs protection in 2000.
4.4. Absorptive capacities
To estimate model (2), we classify countries into two groups, i.e. countries with weak and strong absorptive capacities. We proxy absorptive capacities by the stock of high-value patents filed by domestic inventors in each technology field. The stock equals the discounted sum of previously filed patents. We apply a 15% discount rate, as done in the literature. It seems reasonable to assume that the higher the stock, the more inventors there will be in the country familiar with the technology. The absorptive capacity dummy equals 1 when the country’s absorptive capacity is higher than the world median value. Data on patents and corresponding inventors come from PATSTAT. Table 11 provides the absorptive capacity dummies for all countries and all technologies.
In this section, we present the results of the different models. We start with the baseline models, which give the global average effect of IPRs on trade and FDI. The results of the models, which account for cross-country heterogeneity with interaction variables, are subsequently discussed.
5.1. Average effects of IPRs protection
Table 4 and Table 5 display the results of the estimation via PPML of model (1) for the trade of low-carbon goods and low-carbon FDI and by technology, respectively.26 In all regressions, the
18
coefficients of the control variables have their expected sign when statistically significant, suggesting reliable estimates. Increases in GDP or in GDP per capita lead to larger imports of low-carbon equipment27; increases in GDP per capita lead countries to export more and to invest
more capital abroad; increases in non-tariff measures reduce imports of equipment goods; signing a trade agreement increases trade between partners. Interestingly, this also reduces FDI. A likely explanation is that trade and FDI are substitutes: when trade barriers are high, firms are more likely to resort to FDI to reach a foreign market.
The net effect of IPRs protection on trade and foreign direct investments is never negative at conventional significance levels and is significantly positive for most technologies. This is true for the international trade of equipment for hydro and cleaner vehicles. In terms of magnitude, an increase in the IPRs protection index by 1 unit (corresponding to twice the within-country-pair standard deviation of the variable over our sample) is predicted to increase imports of hydro by 26%, and cleaner vehicles by 38%.28 The effect on FDI is statistically significant and positive
for five technologies, i.e. solar PV, solar thermal, heating, lighting, and cleaner vehicles. An increase in the IPRs protection index by 1 unit is predicted to increase FDI in solar PV by 64%, in solar thermal by 69%, in heating by 54%, in lighting by 45% and in cleaner vehicles by 44%. These numbers are higher than those obtained for trade in low-carbon capital goods. This difference is consistent with the theory that FDI is a more knowledge-intensive, and thus potentially more IP-sensitive, channel than international trade, as explained in Section 2. In section 5.4, we provide additional simulation results.
We perform three different checks to evaluate the sensitivity of these results. First, we estimate the model using exporter-year fixed effects instead of only year fixed effects, and report the estimation in Table 22 for trade and Table 23 for FDI.29 Second, we add different measures of
environmental policy stringency of the recipient country as new control variables. Our baseline estimates can potentially suffer from an omitted variable bias if the severity of environmental regulations – which increases domestic demand for low-carbon goods and investments, – correlates with the strictness of the IP-regime. We show in Tables 24 and 25 that the estimation coefficient of the IPRs protection index is not affected by including Yale University’s environmental performance index or the World Economic Forum’s index of environmental regulations stringency.30 Third, in Table 26 we use three alternative sets of controls, i.e. (i)
without trade policy variables, (ii) without exporter controls, (iii) without importer controls and retaining only GDP.31 For these three checks, we obtain coefficients that are highly similar to our
baseline estimates.
All in all, for most technologies, the positive impact of stricter IPRs protection through market expansion thus more than compensates the negative impact through enhanced market power, leading to more transfer through trade or FDI. Wind power and insulation are the only two
27 Solar PV and solar thermal capital goods are an exception. This might reflect the fact that countries that
become richer also produce more of these goods domestically, which diminishes their import demand.
28 In a Poisson regression model, the coefficients can be interpreted as semi-elasticities.
29 Note that the number of observations for insulation is not sufficient to estimate an exporter-year
fixed-effects model.
30 In our baseline, we do not control for the severity of environmental regulations because it drops at least
20% of the sample observations that potentially introduces a sizeable sample selection bias.
31 For clarity, we do not report all the estimates of the controls variables in the appendix, but the complete
19
exceptions: in these sectors, technology transfer is not responsive to patent protection. Although informative, these results do not specifically deal with the case of developing countries, which is the focus of current policy discussions. We now consider the results of models that address this specific issue.
5.2. OECD versus non-OECD countries
Table 6 shows the results of the estimation of model (2) in which IPRs protection is interacted with a dummy variable equal to 1 when the importing country is an OECD country. Policy relevance leads us to focus the discussion on the case of non-OECD countries in what follows. Results for the FDI models are broadly similar to those of the baseline models, that is, either a positive or a non-significant effect of IPRs protection on the transfer towards non-OECD countries. The technologies that show a positive effect are solar PV, wind power, and cleaner vehicles. In contrast, trade models yield ambiguous results that differ from the average effects estimated previously. In particular, we now obtain a statistically significant negative effect of IPRs protection for solar PV and solar thermal while the effect is significant and positive for hydro and cleaner vehicles.
How can we interpret these differences between technologies and between country groups? The theory mentioned in section 2.2 highlights a trade-off between market expansion and market power. The intensity of each of these mechanisms is determined by industry- and technology-specific characteristics. The net effect of IPRs protection can thus vary across countries and technologies, as observed in the results. In this respect, the primary policy lesson of our analysis is that potential adjustment of IP rules for climate change mitigation technologies should be made on a case-by-case basis.
A further complexity is that multiple technology transfer channels exist (two of which are studied in this paper). As a result, tightening or relaxing IPRs protection may influence not only the overall level of transfer, but also the allocation across channels. Consider the case of solar PV. Table 6 shows that increasing IP protection would shift the transfer of solar PV technologies from the trade channel to the FDI channel. However, we do not know whether this involves additional or fewer transfers, as the quantity of knowledge flowing through the two channels is not measured with a common metric.
5.3. Weak versus strong absorptive capacity countries
In Table 7, we present the results of models in which the IPRs variable is interacted with the absorptive capacity dummy described in subsection 4.4. Climate policy debates indeed commonly stress the low absorptive capacities of developing countries. We find results that are not completely in line with the OECD vs. non-OECD models. For instance, we now obtain a negative sign for the transfer of heating technologies through FDI in low-capacity countries, whereas the effect of IPRs protection on non-OECD countries is not significant. This simply indicates that the specificities of the developing world are not limited to the size of their technological capabilities. Other factors, such as the stringency of domestic climate policies, may be even stronger drivers.
Regarding imports of low-carbon equipment into countries with weak capacities, we find that stronger IPRs has a negative effect on solar PV but a positive effect on heating, insulation, and cleaner vehicles. The ambiguity of these results is at odds with the theory that IPRs facilitates
20
transfers when recipient countries are able to imitate imported inventions. A possible explanation is that absorptive capacities do not only measure the capacity to imitate but are also a proxy for domestic production of low-carbon inventions. Therefore, higher effectiveness of IP in weak-capacity countries may simply signal that these countries innovate less and are thus more dependent on technology imports.
5.4. A simulation exercise
Examining the marginal impact of a one-unit increase in the level of IPRs protection, as presented above, is useful when comparing different channels, but it tells us little about how IPRs protection impacts absolute levels of technology transfer. We thus conclude the discussion of our results with a simulation exercise in which we assume that countries below the median IPRs protection level experience an increase in IPRs protection to reach a global median IPRs level equal to 4.3. This median value roughly corresponds to the value of IPRs protection in China in 2010 and involves a relatively small 15% increase in IPRs for large emitters such as India and Mexico. Table 8 shows the impact of this change on imports of low-carbon equipment for each country, and Table 9 reports the value for FDI. We use the coefficients obtained from the estimation of the model with the interaction terms between IPRs protection and the absorptive capacities dummy because they take into account the specificity of the developing countries that we focus on in the simulation.
We find relatively large impacts. For instance, imports of equipment into India are expected to grow by 17% for insulation materials. The effect is even greater for FDI, with an increase of 45% for solar PV, 62% for wind, and 47% for cleaner vehicles. There is also a substantial negative effect equal to -31% for heating due to India’s weak absorptive capacities in this domain.32 In
short, if big emitters like India and Mexico were to converge to the Chinese level of IPRs protection, this would already make a significant difference in terms of international transfer of climate change mitigation technology, except in technologies where these countries have particularly low absorptive capacities.
In this paper, we have combined international trade and FDI data to analyze the impact of intellectual property rights protection on cross-border flows of climate change mitigation technologies. Our data cover up to 62 countries (both developed and developing) and include eight low-carbon technologies in the energy production, transportation, and building sectors. We exploit the fact that IPRs stringency has evolved differentially over time across countries in our dataset to identify the impact of greater IPRs protection, and to analyse how this impact varies between OECD and non-OECD countries and with the recipient country’s absorptive capacities.
At the global level, in the vast majority of cases stricter IPRs regimes are found not to impede the transfer of climate change mitigation technology. At best, strengthening IPRs can increase
21
the transfer of several low-carbon technologies, in particular, it can boost the imports of capital goods in hydro and cleaner vehicles, and foreign direct investments in solar PV, solar thermal, heating, lighting, and cleaner vehicles.
The policy discussion on this issue primarily focuses on North-South technology transfer towards developing countries. In this respect, the results are less clear-cut when we focus on the specific case of non-OECD countries. The effect of strengthening IPRs protection on FDI is never negative, and significantly positive for solar PV, wind power, and cleaner vehicles. It also increases imports of hydro power equipment and cleaner vehicles. However, we also find that a stricter IP regime reduces imports of solar PV and solar thermal equipment goods. This may be bad news if it indicates strong market power, implying higher technology prices, and thereby limiting the deployment of up-to-date solar equipment in non-OECD countries. It may also be good news if it reflects that non-OECD countries become less dependent on imports of solar technologies, assuming that a stricter IPRs regime induced more innovation in the first place.
Our study conveys an important policy message. Admittedly, on average, stricter IPRs protection promotes the transfer of climate change mitigation technologies through trade and FDI. However, this is not the case for some technologies and countries – although our analysis of cross-country heterogeneity remains superficial. As a result, potential adjustment of IP rules aiming at fostering technology transfer towards the South should be made on a case-by-case basis.
Our findings are in line with the previous literature looking at other commodities. Although our scope is more specific, we believe that our empirical strategy employing country-pair fixed effects relies on weaker identifying assumptions. However, it is important to note that our FDI data has one main caveat. We employ an ordinal, rather than cardinal, measure of FDI between country pairs. More comprehensive data, including data on other channels of technology transfer, such as labour circulation, could quantify international transfers more precisely. We also examine only one dimension of IP regimes, i.e. the level of IPRs protection. Other IP-related aspects are also debated, i.e. reinforcement of antitrust safeguards to limit potential market power abuse, development of patent landscaping to increase knowledge spillovers and help identify potential blocking patents33, and introduction of voluntary patent pools to reduce
transaction costs and limit the duplication of royalty payments.34 These aspects are left for
future research.35
33 Patent landscaping consists in the creation of patent databases and related visualisation software. 34 With voluntary patent pools, firms, universities and research institutions can pool all of their patents
related to a particular technology and so propose a single packaged licence to users.
35 See Maskus K.E. (2010) for a review of the economic logic of these differentiated IPRs for climate
22
Table 4: IPRs protection and trade in low-carbon capital goods
Hydro Solar PV Solar Thermal Wind power Heating Insulation Lighting Cleaner
vehicles
Importer IPRs protection 0.228** 0.180 0.045 -0.057 0.033 0.055 0.067 0.325*
(0.094) (0.210) (0.069) (0.194) (0.038) (0.058) (0.050) (0.187)
Importer Absorptive capacities -0.073 0.187 0.092 0.039 -0.130** -0.018 -0.046 0.512**
(0.184) (0.353) (0.076) (0.283) (0.057) (0.068) (0.086) (0.211)
Importer Log (GDP) 0.618* 3.013*** 1.665*** 0.545 0.530*** 0.855*** 0.654*** 2.270***
(0.357) (0.573) (0.279) (0.840) (0.170) (0.326) (0.188) (0.391)
Importer Log (per capita GDP) -0.728 -5.798*** -2.434*** 0.960 -0.465 -0.531 -0.091 -2.036*
(0.882) (1.766) (0.502) (1.216) (0.315) (0.614) (0.422) (1.232)
Importer Effectively Applied Tariff 0.018 -0.031 -0.008 -0.021 0.001 -0.005 0.000 -0.009
(0.018) (0.027) (0.012) (0.019) (0.009) (0.013) (0.009) (0.007)
Importer Nr. of Non-Tariff Measures -0.041** 0.064 -0.033* -0.310*** -0.007 -0.024*** -0.075*** -0.007
(0.019) (0.070) (0.020) (0.044) (0.009) (0.005) (0.017) (0.047)
Country pair in Trade Agreement (0/1) 0.091 -0.261 -0.13 1.501*** -0.003 0.192** 0.001 0.446
(0.294) (0.261) (0.129) (0.410) (0.094) (0.095) (0.168) (0.422)
Exporter Log (GDP) 0.077 0.855*** 0.012 -1.478*** 0.140 -0.657** 0.107 1.504*
(0.345) (0.277) (0.359) (0.520) (0.115) (0.278) (0.265) (0.860)
Exporter Log (per capita GDP) 1.306* 2.197*** 1.579** 2.419** 0.244 1.892*** 1.943*** -1.712
(0.754) (0.589) (0.790) (1.206) (0.426) (0.469) (0.691) (1.800)
Exporter IPRs protection -0.089 -0.005 0.114 0.462** 0.157*** 0.071*** -0.023 -0.007
(0.083) (0.088) (0.089) (0.193) (0.038) (0.027) (0.117) (0.169)
Year fixed effects Yes Yes Yes Yes Yes Yes Yes Yes
Country-pair fixed effects Yes Yes Yes Yes Yes Yes Yes Yes
Nr. Observations 20,696 28,154 19,795 11,684 30,241 24,618 24,800 17,357
Nr. Country pairs 1,975 2,710 1,907 1,120 2,912 2,367 2,393 1,668
Notes: robust standard errors clustered at the recipient country level in parentheses. * Significant at the 10% level, ** significant at the 5% level, *** significant at the 1% level. All columns are estimated with the Pseudo Poisson Maximum Likelihood Estimator with all regressors lagged one year. The dependent variable is the shipment value in low-carbon goods expressed in thousands of current USD and computed from BACI data. The intellectual property rights (IPRs) index is equal to the Park and Lippoldt (2008) index multiplied by the legal systems and property rights from the 2014 Economic Freedom Dataset published by the Fraser Institute. Absorptive capacities are equal to the logged stock of high-value inventions in the technology. Index of tariff barriers and non-tariff barriers are built from the TRAINS database. The country-pair trade agreement equals 1 if both countries are in a free trade agreement or a custom union based on the WTO Regional Trade Agreements Information System.
23
Table 5: IPRs protection and FDI in low-carbon technologies
Hydro Solar PV Solar Thermal Wind power Heating Insulation Lighting Cleaner vehicles
Importer IPRs protection 0.126 0.493*** 0.524*** 0.241 0.434* 0.051 0.371** 0.367***
(0.189) (0.110) (0.136) (0.193) (0.253) (0.244) (0.170) (0.113)
Importer Absorptive capacities 0.054 0.074 -0.106 -0.205 -0.58 0.457 -0.495 -0.137
(0.375) (0.186) (0.229) (0.234) (0.393) (0.433) (0.343) (0.171)
Importer Log (GDP) 0.537 0.085 -0.022 0.296 1.650* 0.395 0 0.218
(0.637) (0.375) (0.375) (0.426) (0.927) (0.803) (0.653) (0.377)
Importer Log (per capita GDP) -1.927 -1.637*** -1.691* -0.127 -2.416* -0.251 -1.032 -0.486
(1.326) (0.606) (0.927) (1.081) (1.285) (1.742) (1.297) (0.972)
Importer business regulations -0.290** -0.316*** -0.171** -0.316*** -0.417*** -0.627*** -0.009 -0.374***
(0.132) (0.081) (0.084) (0.087) (0.128) (0.214) (0.116) (0.084)
Importer labor market regulations 0.268 0.194* 0.089 0.266 -0.128 0.126 0.2 0.251*
(0.216) (0.103) (0.139) (0.165) (0.195) (0.358) (0.231) (0.146)
Importer controls of the movement of capital and people
0.187 0.041 -0.013 0.07 0.011 0.03 0.037 0.077
(0.125) (0.062) (0.080) (0.071) (0.132) (0.173) (0.096) (0.071)
Country pair in Trade Agreement (0/1) -0.504 -0.12 -1.340* -0.213 -3.356*** -16.102*** 0.529 -0.402
(0.547) (0.735) (0.759) (0.524) (0.683) (0.964) (2.181) (0.589)
Exporter Log (GDP) -0.742 -0.39 0.322 -0.544 -0.36 0.359 -0.077 -0.404
(0.900) (0.371) (0.373) (0.695) (0.811) (1.376) (0.559) (0.504)
Exporter Log (per capita GDP) 5.724** 2.613 3.319 6.729*** 2.319 -12.177 10.387** 3.884***
(2.638) (2.172) (2.301) (1.545) (4.000) (12.301) (4.171) (1.172)
Exporter IPRs protection 0.111 0.24 0.360** 0.117 0.083 -0.183 -0.006 -0.177
(0.233) (0.165) (0.169) (0.148) (0.209) (0.319) (0.173) (0.118)
Year fixed-effects Yes Yes Yes Yes Yes Yes Yes Yes
Country-pair fixed-effects Yes Yes Yes Yes Yes Yes Yes Yes
Nr. Observations 948 1,817 1,790 1,710 1,190 523 997 1,916
Nr. Country-pairs 91 171 172 164 115 52 98 177
Notes: Robust standard errors in parentheses. * Significant at the 10% level, ** significant at the 5% level, *** significant at the 1% level. All columns are estimated with the Pseudo Poisson Maximum Likelihood Estimator with all regressors lagged one year. The dependent variable is the number of inward FDI deals computed from Zephyr and Patstat data. The intellectual property rights (IPRs) index is equal to the Park and Lippoldt (2008) index multiplied by the legal systems and property rights from the 2014 Economic Freedom Dataset published by the Fraser Institute. Absorptive capacities are equal to the logged stock of high-value inventions in the technology. Importer business regulations, labour market regulations, and controls of the movement of capital and people come from the 2014 Economic Freedom Dataset published by the Fraser Institute. The country-pair trade agreement equals 1 if both countries are in a free trade agreement or a custom union based on the WTO Regional Trade Agreements Information System.