Publisher’s version / Version de l'éditeur:
Transportation Research Record, 1492, pp. 53-60, 1995
READ THESE TERMS AND CONDITIONS CAREFULLY BEFORE USING THIS WEBSITE. https://nrc-publications.canada.ca/eng/copyright
Vous avez des questions? Nous pouvons vous aider. Pour communiquer directement avec un auteur, consultez la
première page de la revue dans laquelle son article a été publié afin de trouver ses coordonnées. Si vous n’arrivez pas à les repérer, communiquez avec nous à [email protected].
Questions? Contact the NRC Publications Archive team at
[email protected]. If you wish to email the authors directly, please see the first page of the publication for their contact information.
NRC Publications Archive
Archives des publications du CNRC
This publication could be one of several versions: author’s original, accepted manuscript or the publisher’s version. / La version de cette publication peut être l’une des suivantes : la version prépublication de l’auteur, la version acceptée du manuscrit ou la version de l’éditeur.
Access and use of this website and the material on it are subject to the Terms and Conditions set forth at
Application of digital image processing to quantitative study of asphalt
concrete microstructure
Yue, Z. Q.; Bekking, W. B.; Morin, I.
https://publications-cnrc.canada.ca/fra/droits
L’accès à ce site Web et l’utilisation de son contenu sont assujettis aux conditions présentées dans le site LISEZ CES CONDITIONS ATTENTIVEMENT AVANT D’UTILISER CE SITE WEB.
NRC Publications Record / Notice d'Archives des publications de CNRC:
https://nrc-publications.canada.ca/eng/view/object/?id=470e383c-cca9-400f-b013-f8ace09ff7a1
https://publications-cnrc.canada.ca/fra/voir/objet/?id=470e383c-cca9-400f-b013-f8ace09ff7a1
http://www.nrc-cnrc.gc.ca/irc
Applic a t ion of digit a l im a ge proc e ssing t o qua nt it a t ive st udy of
a spha lt c onc re t e m ic rost ruc t ure
N R C C - 3 9 2 9 6
Y u e , Z . Q . ; B e k k i n g , W . B . ; M o r i n , I .
J u n e 1 9 9 5
A version of this document is published in / Une version de ce document se trouve dans:
Transportation Research Record, (1492), pp. 53-60, 1995
The material in this document is covered by the provisions of the Copyright Act, by Canadian laws, policies, regulations and international agreements. Such provisions serve to identify the information source and, in specific instances, to prohibit reproduction of materials without written permission. For more information visit http://laws.justice.gc.ca/en/showtdm/cs/C-42
Les renseignements dans ce document sont protégés par la Loi sur le droit d'auteur, par les lois, les politiques et les règlements du Canada et des accords internationaux. Ces dispositions permettent d'identifier la source de l'information et, dans certains cas, d'interdire la copie de documents sans permission écrite. Pour obtenir de plus amples renseignements : http://lois.justice.gc.ca/fr/showtdm/cs/C-42
TRANSPORTATION RESEARCH RECORD /492
Application of Digital Image Processing to
Quantitative Study of Asphalt Concrete
Microstructure
ZHONG QI YUE, WILLIAM BEKKING, AND ISABELLE MORIN
53
Asphalt concrete (AC) is a strongly heterogeneous material that consists of asphalt cement, voids. fine particles, sand, and coarse aggregates. A review of the literature reveals that the investigations of AC have mainly
concentrated on the macroscopic behavior of the material based on the
assumption that the mixture ishomogeneous. This assumption is mainly due to the extreme difficulty associated with the quantitative measure¥ ments ofACmicrostructure and the random nature of the aggregate
dis-tribution. This paper applies an innovative digital image-processing technique to quantify the distribution. orientation, and shape of coarse aggregatesHセR mm)inAC mixtures. Results of the quantitative mea-surements of coarse aggregate distribution and shape in AC mixture are then presented and analyzed. The quantitative results of ACュゥ」イッウエイオ」セ
ture clearly indicate the following findings:(a)the microstructure」ィ。イセ
acteristics of coarse aggregates in AC mixtures canbeaccurately mea-sured using the digital ゥュ。ァ・セーイッ」・ウウゥョァ technique; (b) the area gradation of aggregate cross sections by the Feret diameter gives an excellent prediction of the sieve gradation of coarse aggregates(;=:2 mm) used in the design of AC mixtures;(c)the major cross sections of coarse aggregate particles have the tendency to lie horizontally in the mixtures; and(d)comparison among two laboratory and two field com-paction techniques provides valuable information related to comcom-paction quality in terms of favorable aggregate distribution within the mixtures.
Digital image processing is the term that pertains to converting video pictures into a digital form and applying various mathematicalーイッセ
cedures to extract significant information from the picture, This information may be characteristic of cracks or potholes on aー。カ・セ
ment surface, the microstructure of cement-based materials, the fab-ric of clay soils, the texture of sea ice, or the angularities and shapes of granular materials (1-5). Although digital image processing.has been widely used in civil engineering in recent years (6), a literature survey indicates that the application of digital image processing to the quantitative study of microstructure of asphalt concrete (AC) mixtures is limited(7), In this paper, an innovative digital image-processing technique is applied to the quantitative study of the AC internal structure (called microstructure) defined by the distribution, orientation, and shape of coarse aggregate particles in the mixtures. Also, a coarse aggregate particle is considered equal to or greater than 2 mm in size. Coarse aggregates and their distribution playa key role in the stability and bearing capacity of AC mixtures.
BACKGROUND
Asphalt concrete is a heterogeneous material that consists of asphalt cement, voids, fine particles, sand, and coarse aggregates. These
Pavements Research Group, Institute for ResearchinConstruction. National Research Council of Canada. Ottawa. Ontario. Canada KIA OR6.
individual materials and components have different physical and mechanical properties and behavior, The microstructure of ACュゥクセ
tures is influenced by many factors, including quality of asphalt cement, aggregate gradation and shape, and quality of compaction, It has been well recognized that the microstructure of AC plays a significant role in the mechanical properties of AC and in theイ・ウゥウセ
tance of AC pavements to major distresses including rutting. fatigue, thermal cracking, andャッキセエ・ュー・イ。エオイ・ cracking (8-15).
Realistic characterization of the failure of AC mixtures (in the form of plastic deformation, cracking, or both) necessitates consid-eration of the heterogeneous nature(orthe microstructure) of the materials. Mechanistic models of AC mixtures have concentrated mainly on the macroscopic behavior of AC and have been con-structed on the general principles of continuum mechanics(J6-19), In most of those mechanistic models. the composite material is always assumed to be homogeneous and isotropic, and its micro-structure behavior is largely ignored. This assumption could be due to the extreme difficulty associated with the quantitative measure-ments of AC microstructure and the random nature of aggregate distribution. In particular, the application of fracture mechanics concepts to characterize the toughness of AC by ignoring the heterogeneity of the material and the existing flaws has had limited success(20-24).Practical measurement of the fracture toughness
K,cand i-integral forACmixtures was difficult because thoseー。イ。セ
meters are significantly affected by the material properties near a macro-crack tip. Unless the failure mechanism is properly under-stood and analyzed. predictions of the allowable stresses in service based onウュ。ャャセウ」。ャ・ laboratory tests cannot be reliable (25).
Recently, attempts have been made to consider AC mixtures as two-phase composites in which the coarse aggregates are embedded into the matrix consisting of asphalt cement, fine particles, and sand (26.27).The matrix is regarded asahomogeneous and isotropic con-tinuum functioning as the binder of coarse aggregates. Rothenburg et a1. (26) presented a micromechanical modeling of AC in」ッョョ・」セ
tion with pavement rutting problems using two-dimensional discrete element techniques. The aggregates were treated as elastic elements and the binder as linearly viscoelastic material. The microstructure of aggregate distribution in AC was simulated by numerically
solv-セョァ Newton's equations of motion for individual particles. Sepehr et al. (27) perfonned a finite element structure analysis of AC pavements using a fictitious microstructure of an AC layer.
Furthermore. the effects of different compaction methods on AC mixtures have been extensively examined using laboratory testing and field trials during the past decades. Consuegra et a!. (28) demonstrated that the Texas gyratory compactor, among otherャ。「セ
oratory compaction methods, has the ability to produce AC ュゥクセ
field cores. Svec and Halim (29) concluded that the asphalt multi-integrated roller (AMIR) compactor can produce more homoge-neous and hairline」イ。」ォセヲイ・・ AC layers when compared with a con-ventional vibratory roller compactor followed by a rubber tire roller. A majority of these findings were based on macroscopic properties including specific gravity. indirect tensile strength, and resilient modulus of AC mixes, For the same mix design, differences in these properties of AC compacted using different methods are mainly due to the differences of the mixture's microstructure, in particular. the distribution and orientation of coarse aggregates.
Moreover. the microstructures of conventional hot-mix asphalt (HMA), stone mastic asphalt (SMA). and large stone asphalt mixes (LSM) are quite different. It was claimed that because of point-to· point contact or interlock of coarse aggregates, or both. SMA and LSM have better perfonnance in resisting permanent deformation than conventional HMA(14,30).Based on this analysis, two ques-tions arise:(a)Can the differences in the microstructure be quanti-tatively measured for AC mixtures compacted using different meth-ods or with different mix design?(b) What are the relationships between the microstructure and the performance of AC mixtures?
OBJECTIVES AND OUTLINE
To analyze and model the performance of AC mixtures more accu-rately and reliably, the characteristics of the microstructure have to be measured and analyzed precisely. Recent advances in hardware and software for digital image processing and analysis areーイッカゥ、セ
iog a powerful tool for quantitatively analyzing AC microstructure. In this paper. an innovative digital image-processing technique is introduced and used to obtain quantitative information about the geometric distributions of coarse aggregates and the shape and orientation of individual aggregate particles on cross sections of AC specimens. Although digital image processing is limited to
エキッセ、ゥュ・ョウゥッョ。ャ measurements, three-dimensional infonnation can be derived from these measurements if a series of layers is analyzed. The outline of the paper is as follows: (a) a detailed description of the digital image analysis technique used in this study, (b) a definition of morphological measurements of AC microstructure,(c)a presentation of examples of the applications to AC microstructure including the effects of different field and laboratory compaction methods. and (d) a summary of the main conclusions and recommendations.
TRANSPORTATION RESEARCH RECORD /492
DIGITAL IMAGE PROCESSING Preparation of Plane Cross Sections
Field cores or laboratory-prepared AC specimens were cut using a circular masonry saw with a diamond-tip blade in multiple vertical or horizontal plane cross sections, The circular saw can cut a thin layer of about 3-mm thickness from a specimen. Three vertical or 10 horizontal sections can be obtained from a specimen 100 mm in diameter and 50 mm high. AC specimens were conditioned at - 2"C for hardening purposes. Because the thickness between any two cuts is less than 5 mm. liquid epoxy resin was applied at the plane surface to prevent detachment of aggregates from the matrix. The epoxy resin was applied about 4 hr before cutting to allow ittogain adequate strength in accordance with the manufacturer's specifica-tions, Sections were photographed using a camera equipped with a zoom lens and a tripod, A flash was not used because of surface reflection. A ruler was placed beneath the photographed section for scaling and calibration in the digital image processing, ISO 200 Kodacolor print film was used for developing prints. A conven-tional hot-asphalt mix. referred to as HL4 by the Ministryッヲtイ。ョウセ
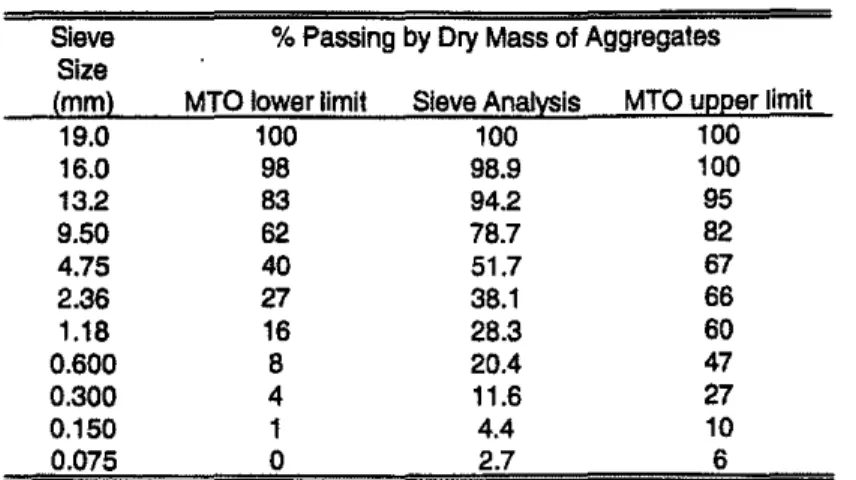
portation of Ontario (MTO), was used in this study. Table I illus-trates the aggregate gradation and MTO specification limits of the HL4 mix. More details on the HL4 mix can be obtained elsewhere
(14,24,29),
Image Digltization
A Microteck flatbed scanner with Picture Publisher's scanning functions was used to convert pictures into digital files that can be processed by computer. The AC cross section and the ruler were scanned from a picture. The resolution of picture scanning was set to the highest practical value to increase the accuracy of measure-ments, Aggregates were easier to identify and could be better dif-ferentiated from the background matrix using a high value of reso-lution. For a black-and-white print and a color picture (4 in. X 6 in,), 300 dots per inch (dpi) and 165 dpi respectively, were used, This choice was dictated by the capacity of a lA-MB high·density diskette used in this study. The image was stored in a file (about 1.2 MB) with ,TIP formatセウ a series of pixels (or points), Each pixel has three digital values indicating the X andYcoordinates and grey level or color intensity. An example of the digitized image is shown
TABLE 1 Aggregate Gradation and MTO Specification Limits of HL4 Mix
%Passing by Dry Mass of Aggregates Sieve Size (mm) 19,0 16,0 13,2 9,50 4,75 2.36 1.18 0,600 0,300 0,150 0,075
MTOlower limit 100 98 83 62 40 'Zl 16 8 4 1
o
Sieve Analysis 100 98,9 94,2 78,7 51.7 38,1 28,3 20,4 11,6 4.4 2,7MTOupper limit 100 100 95 82 67 66 60 47 27 10
6
QiYue et al.
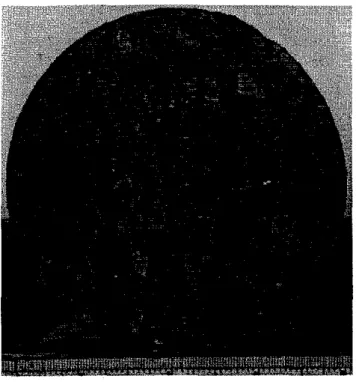
in Figure l(a), which shows the horizontal cross section of'a IOO-mm-diameter sample of a gyratory compacted HL4 mix. The number of gyrations was 250, the applied pressure was 0.6 MPa, and the gyratory angle was 1 degree.
Anゥュ。ァ・セ・、ゥエゥョァ software, Picture Publisher (version 4.0), was then used to manually outline the boundaries of aggregates on the digitized image. A manual technique was used because the image analysis software cannot satisfactorily and automatically recognize
(a)
(h)
FIGURE 1 Digitalized images of horizontal cross section of gyratory compacted HL4 mix (100 mm in diameter),(a)Original image;(b)modified image.
55
whether a pixel is part of an aggregate or the asphalt matrix. The automatic recognition of aggregates produced poor results because of the slight color differences between aggregates and matrix. Using the freehand mask tool in Picture Publisher, the area of every aggregate was marked and filled with a contrasting color.eカ・イケセ
thing except the AC section and the ruler was erased. Once all aggregates were contoured, theーッウエ・イゥコ・セエィイ・ウィッャ、 tool was used to reduce the color number to 2. One color represents the aggre-gates and the other represents the matrix, The greyscale of aュッ、セ
ified image was transformed into black and white. A modified image file of about 0.6 MB was then obtained. In this modified image file, pixels of aggregates are turned on, and pixels of the matrix are turned off. This separation process required about 30 min per cross section.
Image Calculation
An image analysis statistics software called MOCHA was used to calculate the values of morphological parameters of aggregates from the modified image file. The ruler was utilized to set up the scale of the image for calculation. Two points were selected on the ruler and the actual distance was entered. A plane Cartesian」ッッイセ
dinate system(X, Y) was automatically set up. The origin of the coordinate system is located at theャッキ・イセャ・ヲエ corner of the image. The X-axis is along the horizontal direction on the image and the Y-axis is along the vertical direction. The calculations were per-formed using the automatic calculations option. The calculated val-ues of the morphological parameters of aggregate cross sections were saved in a file with ASCII format. The modified image file was saved in either .PCX or .TIF format. Figurel(b)shows an example of the modified image in Figure lea)after using Picture Publisher and MOCHA. In this MOCHA image, each aggregate has anゥ、・ョセ
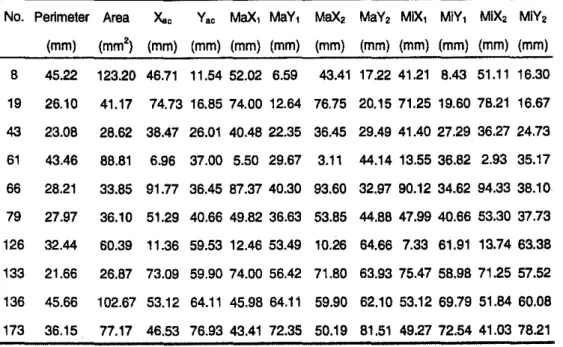
tifying number, and the major and minor axes of each aggregate cross section are also illustrated. Table 2 presents a sample of the calculated results of the aggregate characteristics on the AC cross section in Figure 1(a).The aggregates listed in Table 2 can be eas-ily identified in Figure 1(b).The definition of the measurements in Table 2 will be given in the next section. All the digital image pro-cessing was performed using aVVセュhコ 80486 personal computer.
DEFINITIONS OF MEASUREMENT Measurement of Aggregate Cross Section
The major axis of an aggregate cross section is defined by theァイ・。エセ
est distance between two pixels of the boundary contour. The minor axis of an aggregate cross section is defined as the longest line that can be drawn perpendicular to the major axis. The following ba"ic quantities can be measured automatically for an aggregate cross section:(a) perimeter:summation of all pixels forming the「ッオョ、セ
ary of an aggregate cross section,(b) area:summation of all pixels contained within an aggregate cross section.(c) centroid(Xc", Yca):
X andYcoordinates of the binary center of mass of an aggregate cross section.(d) coordinates-major axis ends: (MaXI. MaYI ) and
(MaX}. m。yセIL and(e)」ッッイ、ゥョ。エ・ウセュゥャャッイ axis ends: (MiX), MiYI )
and(MiX,. MiY,).
Using these basic quantities of an aggregate cross section. the following parameters can be easily calculated:(a) major (or minor)
TRANSPORTA TlON RESEARCH RECORD 1492
TABLE 2 Selected Results for Basic Measurements of Aggregate Distribution and Geometries on AC Cross Section of Figure 1
No. Perimeter Area Ya< MaX, MaY, MaX" MaY, MIX, MiY, MIX, MIY, (mm) (mm') (mm) (mm) (mm) (mm) (mm) (mm) (mm) (mm) (mm) (mm) 8 45.22 123.20 46.71 11.54 52.02 6.59 43.41 17.22 41.21 8.43 51.11 16.30 79 27.97 126 32.44 133 21.66 19 43 61 66 26.10 23.08 43.46 28.21 41.17 74.73 16.85 74.00 12.64 76.75 20.15 71.25 19.60 78.21 16.67 28.62 38.47 26.01 40.48 22.35 36.45 29.49 41.40 27.29 36.27 24.73 88.81 6.96 37.00 5.50 29.67 3.11 44.14 13.55 36.82 2.93 35.17 33.85 91.77 36.45 87.37 40.30 93.60 32.97 90.12 34.62 94.3338.10 36.10 51.29 40.66 49.82 36.63 53.85 44.88 47.99 40.66 53.30 37.73 60.39 11.36 59.53 12.4653.49 10.26 64.66 7.33 61.91 13.7463.38 26.87 73.09 59.9074.00 56.42 71.80 63.9375.4758.9871.25 57.52 136 45.66 102.67 53.12 64.11 45.98 64.11 59.90 62.1053.12 69.79 51.84 60.08 173 36.15 77.17 46.53 76.9343.41 72.35 50.19 81.51 49.2772.54 41.03 78.21
(or minor) axis, or(b) Feret diameter: diameter of a fictitious circu·
lar aggregate that has the same area as the aggregate, equal to (4 areahi)ln;(c) major axis orientation: angle between the major
axis and a horizontal line(i.e., the X-axis) on the scanned image; (d) shape factor: a measure of how nearly circular an aggregate cross
section is, equal to 4'Ti arealperimeter2(a perfect circle and a line
have a shape factor of I and0,respectively); and(e) compactness:
an alternative method for assessing the degree of circularity of an aggregate cross section, given by perimeter2/area. The compactness for a perfect circle is about 12.6 and increases to infinity for a line.
Statistical Parameters of AC Cross Sections
Using the measured data of an aggregate cross section, statistical parameters can be calculated to show the microstructure character· istics on an AC cross section. Some of these statistical parameters are defined as follows:(a) area percentage: percentage of the area
occupied by aggregates over the total area of an AC cross section,
(b) centroid of aggregates: the centroid of all aggregates on an AC
cross section,(c) eccentricity: percentage of the distance of the
cen-troid of aggregates to the geometric center of the AC cross section over the radius or the width of an AC cross section. and(d)ー・イセ
cemage of moment of inertia: percentage of the summation of the
moment of inertia of aggregates over the total moment of inertia of the AC cross section with respect to the X-axis or the Y-axis.
Furthermore. the following gradation analysis can be performed using the digital data of aggregates on AC cross sections.
(a) Area gradation by minor axis length, Feret diameter, or major axis length: summation of the areas of the aggregates whose
minor axis lengths, Feret diameters, or major axis lengths are between 2 mm and a dimensiond (d=:.: 2 mm) over the total aggre-gate area, respectively. It is expressed in percentage as a function of the dimension d.
(b) Number (or area) gradation by shape factor: summation of
the number (or area) of aggregates whose shape factors are between
o
and a values (0 S sS 1)over the total aggregate number (or area). It is expressed in percentage as a function of the values.
(c) Number (area or compactness) gradation by orientation:
summation of the number (area or compactness) of aggregates whose major axis orientations are between -90degrees and an angle
e
(-90 degrees";e ,,;
90 degrees) over the total aggregate number (area, or compactness). It is expressed in percentage as a function of the angle 6. The major axis orientations of aggregates are between-90 degrees and 90 degrees. The three dimensions of an aggregate cross section, Le., minor axis length, major axis length, and Feret diameter, can be applied to the definition of coarse aggre· gates(d=::2 mm) on an AC cross section.DIGITAL IMAGE RESULTS AND ANALYSIS
The preceding described digital image-processing technique will be applied to the quantitative study of AC microstructure. Two exam-ples are presented in this paper to show the coarse aggregate distri-bution in AC mixtures. The first example shows the differences of coarse aggregate distribution in the horizontal and vertical cross sections of an AC mixture. The second example shows the effects of different compaction methods on the microstructure characteris-tics of AC mixtures. TheHL4mix was used in both examples.
Differences Between Horizontal and Vertical Cross Sections
Two gyratory compacted RIA specimens were used in this analy-sis. One horizontal circular cross section (Figure I; 100 mm in diameter) and one vertical rectangular cross section (63 mm high and 95 mm wide) were obtained from the two specimens. Using the digital image-processing technique, the basic measurements were calculated for the geometries and distributions of coarse aggregates on the two cross sections. There are, respectivelYl 122, 158. and 173
QiYue et al. 57
aggregates whose minor axis length, Feret diameter, and major axis length areセR mm on the horizontal cross section. There are, respec-tively, Ill, 160, and 197 aggregates whose minor axis length, Feret diameter, and major axis length are ;;:::2 mm on the vertical cross section. The selection of 2 mm as a minimum dimension in the analysis was based on the definition of coarse aggregates in sieve analysis. The proportion of area occupied by aggregates on the hor-izontal cross section is 40.57, 42.91, and 43.40 percent under the condition that minor axis length, Feret, diameter, and major axis length, respectively, are ;;:::2 mm. The proportion of area occupied by aggregates on the vertical cross section is 42.35, 45.91, and 47.36 percent under the same conditions described previously.
Figure2(a)shows'the area gradation of aggregates by minor or major axis lengths or Feret diameter on the horizontal and vertical cross sections. The gradation of coarse aggregates using a sieve analysis (Table I) was also plotted in Figure2(a).Figure2(a)shows that the area gradations by minor and major axis lengths provide the upper and lower bounds for the result of sieve analysis, and the area gradations by Feret diameter are the closest approximation of the sieve analysis. A sieve analysis gradation is determined by the lengths of the intermediate and minor principal axes of the particle itself, and a digital image gradation is based on planar aggregate cross sections with dimensions, depending on the location and ori-entation of the cut surface, that may be greater than or less than the particle principal axis lengths. The gradations by shape factor of aggregates on the horizontal and vertical cross sections were plot-ted in Figure2(b)where the Feret diameters are 2::2 mm. Figure2(b)
clearly shows that the shape factors of the aggregates on the two cross sections are between 0.2 and 0.8. The shape factors of the aggregates on the vertical cross section are about 0.2 less than those on the horizontal cross section. This result demonstrates that the major cross sections of aggregate particles have the tendency to lie horizontally. This tendency can also be observed from the differ-ences between the numbers and areas of aggregates whose major or minor axis lengths are 2::2 mm on the two cross sections. The dif-ferences, based on major or minor axis lengths. are 51 (173 - 122) and 86 (197 - Ill) for the numbers of aggregate particles on the horizontal and vertical cross sections, respectively. The aggre-gate numbers on the two cross sections, based on Feret diameter,
are almost the same (i.e., 158 and 160). Moreover, the total area of the horizontal cross section is 31.2 percent greater than that of the vertical cross section.
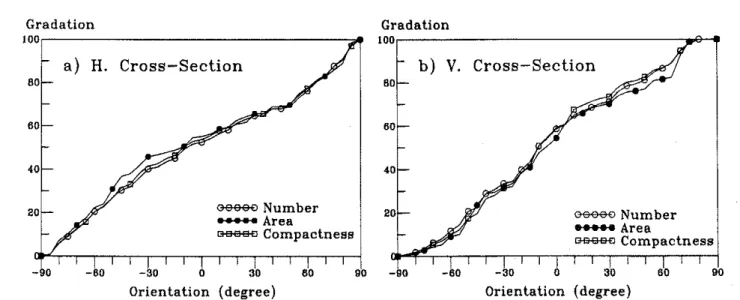
Comparison of the gradations by orientation of aggregates on the two cross sections in Figure 3 illustrates that the orientations of aggregates on the horizontal cross section are more random than those on the vertical cross section. There are almost no aggregates whose major axes are oriented in the ranges of (-90°, -80°) and (80°,90°) (i.e., in the nearly vertical direction) on the vertical cross section. For a completely random orientation of aggregates, theァイ。セ
dation by orientation should be a straight line passing the lower left corner and upper right corner in Figure 3.
Elfecls of Compaction Melhods
Two laboratory specimens prepared by different compaction tech-niques and two cores recovered from pavement section compacted using uniquely different field compaction equipment were analyzed in this example. The two laboratory specimens of 100 mm in diam-eter and 50 mm in height were compacted using gyratory and Marshall compactors. A total of 250 gyrations at a pressure of 0.6 MPa was used for the gyratory compaction with an angle of I degree, and 100 impact blows were applied using a standard Marshall compactor. These unusually high compaction efforts were used deliberately to show the effects of the laboratory compaction methods under extreme conditions. The two cores of 95 mm in diameter and 50 mm in height were recovered from two sections of an experimental pavement compacted 4 years ago. One section was compacted using the AMIR compactor and the other was com-pacted using a conventional vibratory steel roller followed by a rubber-tire roller (29). Six, seven, eight, and seven horizontal cross sections were analyzed for the four specimens compacted using gyratory, Marshall, AMIR, and roller compactors, respectively (see Figure 5). The total number of calculated aggregates on these cross sections is 1,009; 1,251; 1,135; and 1,067 for the specimens com-pacted using gyratory, Marshall, AMIR, and roller compactors, respectively. Among them, there are 877; 1,089; 941; and 924 aggregates whose Feret diameters are セR mm on the cross sections
1.0
Feret dia.a2mm O.Shape factor s
b)
0.0 G&&&E>Number; H.
-Number;
V.
80 G&eefJ Area; H. . . . Area:V.
20 40 80Gradation
100,---:;-::1,..--...,
c>eee<lby
Min.; H.
..., by Fer.;
H.... by
Maj.; H._ b y
Min.; V.
. . . by Fer.; V.
... by
Maj.; V._ S I e v e
20 80 40Area gradation
QPPイMMMMMMMMMMM[ャ[P_LBMMセ[ZェZ]]MNLa)
80FIGURE 2 [mage gradations on horizontal(H)and vertical(V)cross sections of gyratory compacted HL4 mixtures. (a) Area gradation by dimensions; (b) gradation by shape factors(Feret diameter ==2 mm).
58 TRANSPORTATION RESEARCH RECORD /492 Gradation
l o o r - - - . ' "
loor---""J..,...,
Gradationa)
H.
Cross-Section
h) V. Cross-Section
90 セnオュ「・イ . . . Area セ Compactness -90 20 40 80 60 90 Ge-&e£l Number ... Area セ Compactness 20 80 40 80FIGURE 3 Gradation by orientation 9 of aggregates on horizontal(H)and vertical(V)cross sections of gyratory compacted RIA mixtures: Feret diameter:=:=2 mm.(a)Horizontal cross section;(b)vertical cross section
of the four specimens compacted using gyratory, Marshall, AMIR,
and roller compactors, respectively.
Figure 4 shows the area gradationsby minor axis length, Feret
diameter, or major axis length of aggregates on the horizontal
cross sections of the specimens used. The sieve analysis is also plotted. The following observations can be made from these three figures.
(a)The area gradations by size (minor or major axis lengths. or Feret diameter) follow the same patterns and are very similar for the four specimens.
(b)The area gradations by the minor axis length arealittle finer than that of a sieve analysis. The area gradations by the Feret diam-eter are the closest approximation to the sieve analysis. The area
gradations by the major axis length are much coarser than that of a sieve analysis.
(c)The area gradation by the Feret diameter of the Marshall spec-imen is a little finer than that of the gyratory specspec-imen. The area gradations by the Feret diameter of the two laboratory specimens are finer than those of the two field cores,
The first observation reflects the fact that the four specimens had the same coarse aggregate gradation of theHL4mix. The second observation indicates that the sieve analysis gradation is deter-mined by the lengths of the intermediate and minor principal axes of the particle itself. The third observation may be explained by aggregate breaking during the Marshall compaction of100 impact blows. . . . Gyratory <>ee<><l Marshall -AMIR ... Roller
*****
Sievec)
60 40 80 Area gradation QPPイMMMGMMMMMMMMM]セ⦅エ . . . Gyratory <>ee<><l Marshall 20 -AMIR ... Roller*****
Sieveh)
20 40 60 60 . . . Gyratory <>ee<><l Marshall ... AMIR セrッャャ・イ ... Sievea)
2 4 Minor 20 40 80 80Area gradation Area gradation
QPPlMMMMMMMM][ZZZZ[セ[[[[[ ...
't"
QPPイMMMMMMMMMMLセFIGURE 4 Area gradation by dimensions of HL4 mixtures compacted with gyratory, Marshall, AMIR, or steel roller compactors.(a)By minor axis length;(b)by Feret diameter;(c)by major axis length.
...
---QiYue etal. 59a)
o
40 M.=
Mean R.=
Relidual 30(mm)
20Depth
10b)
8 12 18Eccentricity
20,---:----:-:---:=--=---::::1 _ Gyratory: 101.=3.32. R.=1.55 """"" Marahall: 101.=5.74. R.=5.35 ... AIoIIR: 101.=2.84. R.=I.04 ... Roller: 101.=7.11. R.=5.47 60 ' . - Gyratory: 101.=48.19. R.=2.18 """"" Marshall: 101.=47.24. R.=3.40 - - AloIIR: M.=48.84. R.=2.58 ... Roller: 1l.=48.99. R.=2.27 43 39 51Moment-inertia-X-axis
8 0 , - - - ,Moment-inertia-Y-axis
8 0 , - - - , ; - - - , 20!-r-rr-r-rr-r-rr-r-rr-r-rr-rT"1r-rT"lr-rT1-;c)
M. '= M.ean R. = Reaiduald)
28 _ Gyratory: M.=50.30. R.=2.02 _ Marahall: 101.=49.52. R.=8.55 _ _ AMIR: 101.=44.88. R.=3.42 ... Roller: M.=47.28. R.=3.08 2°h-rr-r-r,.,-r,-rr..,..-rr-rT1--r-'-rT-rr-r-l 38 52 101. = loIean R. = Realdual - Gyratory: 101.=49.28. R.=2.58 """"" Marshall: M.=48.82. R.=8.20 ... AloIIR: 101.=48.37. R.=4.98 ... Roller: 101.=44.29. R.=7.47 28 38 82 10 20 30Depth (mm)
40 10 20 30Depth (mm)
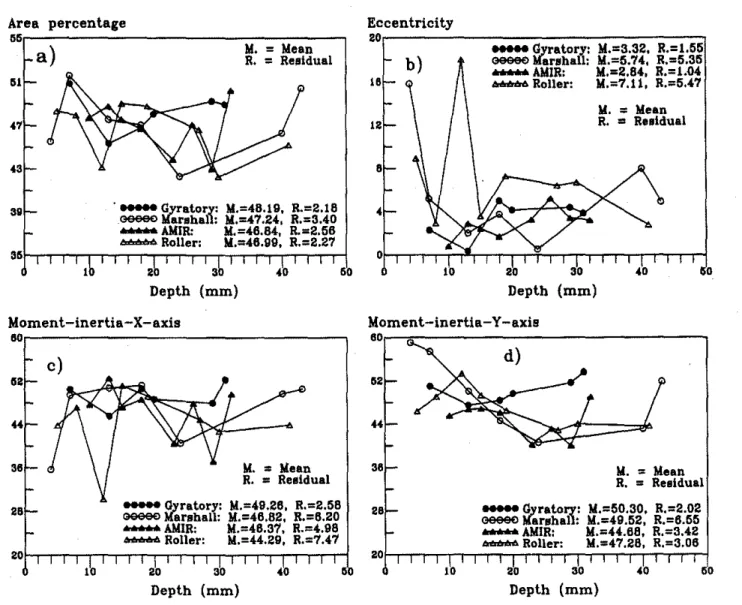
40 60FIGURE 5 Variations of statistical parameters of aggregates on horizontal cross sections of HL4 mixtures compacted with gyratory, Marshall, AMIR, or steel roller compactors versus depth of cross sections.(a)Percentage of areas occupied by aggregates;(b)eccentricity;(c)percentage of moment of inertia with respect to X axis;(d)percentage of moment of inertia with
respect to Y axis.
Figure 5 shows the vertical variations of some statistical
para-meters of aggregate distribution on the horizontal cross sections for the four specimens. Figure5(a)shows the vertical variations ofー・イセ
centage areas occupied by aggregates on the horizontal cross sec-tioris. Figure5(b) shows the vertical variations of eccentricity of aggregates on the horizontal cross sections. The vertical variations of percentages of moment of inertia with respect to the X and Yaxes of aggregates on the horizontal cross sections were plotted in Fig-ure5(c)and(d),respectively. The origin ofthe X andYcoordinates was relocated at the center of the horizontal circular cross sections, For the two laboratory specimens, the directions of the X and Y
coordinates were arbitrarily selected, For the two field specimens, the direction of thexセ」ッッイ、ゥョ。エ・ was along the longitudinal、ゥイ・」セ
tion of the experimental asphalt pavement. The mean values and residuals of the statistical parameters are also presented in Figure
5(c)and(d).For a completely uniform distribution of aggregates in AC mixtures, there should be no vertical variation in the statistical parameters such as area percentage and percentages of mornent<; of inertia. The moments of inertia with respect to the X and Yaxes should be the same and the eccentricity should be O. Keeping this
hypothesis in mind, Figure 5 shows that the gyratory and AMIR specimens have the most homogeneous distribution of coarse aggregates, The calculation of the data in Figure 5 was based on the criterion that Feret diameter is 2=:2 mm. Similar results can be
obtained if the minor axis length (2=:2 mm) is used as the criterion,
CONCLUSIONS AND RECOMMENDAnONS
An innovative digital ゥュ。ァ・セーイッ」・ウウゥョァ teChnique has been suc-cessfully applied to the quantitative study of AC microstructure. In particular, the coarse aggregates and their spatial distribution in AC mixtures can be measured and analyzed using the エ・」ィセ
nique described in this paper. The results presented in this paper lead to the following preliminary conclusions and イ・」ッュュ・ョセ
dations,
1. The area gradation by Feret diameter from digital image analysis gives a very good prediction of the gradation of coarse aggregates used for the mix. The Feret diameter of 2 mm can
60
be used as the lower limit for the definition of coarse aggregates on the plane cross sections of AC mixtures.
2. The distributions of coarse aggregates on vertical and hori-zontal cross sections are quite different. Aggregate cross sections arc morc nearly circular and more randomly oriented and have larger areas on horizontal cross sections than those on vertical cross sections ofAC mixtures. This difference may contribute to AC anisotropic properties.
3. On the basis of the analysis of four specimens,itmay be」ッョセ
eluded that the gyratory and AMIR compactors can produce more uniform distribution of coarse aggregates in AC than the Marshall compactor and conventional roller compactors.
4. These preliminary findings regarding the AC microstructure characteristics (i.e., the internal structure of coarse aggregate distri-bution)should be further confirmed by analyzing more AC mixtures and specimens using the digital image-processing technique.
5. The measurements of aggregate distributions should be further utilized in the finite element microstructure modeling of AC mixtures.
6. The digital image-processing techniques should be applied to the quantitative study of the microstructure of different AC mixes such as SMA and LSM compacted in the laboratory or field.
ACKNOWLEDGMENTS
Deep gratitude is extended to N. K. Sinha and P. D. Barrette of the Institute for Environmental Research and Technology, NRC, Ottawa, Canada for making their digital image-processing facilities available for this investigation. I. Morin would like to thank the NRC for financial assistance during her 4-month cooperative pro-gram at the Pavements Laboratory, CSTT, NRC. The authors would also like to thank the six referees for their constructive comments, . which enhanced the presentationofthe paper.
REFERENCES
1. Haas,
c..
H. Shen,W.A. Phang, andR. Haas. Application of Image Analysis Technology to Automation of Pavement Condition Surveys.Proc., Imemational TrallSportation Congress. Montreal, Canada, 1984,
pp. C57-e73.
2. Wigan, M. R. Image Proceeding for Roads: An On-line Literature Review and Text Database Assessment. Australian Road Research, Vol. 15, 1985, pp. 50-55,
3. Bentz, D.P., and E. J. Garboczi. Digital-image-based Computer Modelling of Cement-based Materials. Proc., Conference on Digital
Image Processing: Techniques and Applications in Civil Engi"eering,
Kona. Hawaii, March 1993. pp. 44-51.
4. Yudhbir and Abedinzadeh, R. Quantification of Particle Shape and Angularity Using the Image Analyzer. Geotechnical Testing Journal, GTJODJ, Vol. 14, No.3, Sept. 1991, pp. 296-308.
5. Barrette. P.D.and N. K. Sinha. Crystallographic Characterization of a Core From the Ward Hunt Shelf.c。ョ。、。セ Proc.. International Sympo-sium0/1Snow and Related Manifestations (SNOW SYMP94),ManaH,
H.P.. India, Sept. 1994. p. 4.
6. Frost, J. D., and J. R. Wright, (eds.). Digital Image Processing:
Techniques and Applications in Civil Engineering: Proceedings of a Conference. Kona, Hawaii, American Society of Civil Engineers.
March 1993 New York, p. 229.
7. Eriksen, K. Microscopical Analysis of Asphalt-aggregate Mixtures
Related to Pavement Performance. Report Note 245, Danish Road
Institute, Denmark, Nov. 1993, p. 17.
8. Vinson, T. S., V. C. Janoo, andR. C. G. Haas. Summary Report Low
Temperature alld Thermal Fatigue Cracking. SHRP-AIIR·90-001,
National Research Council, Washington, D.C., June 1989,
9. Tangella. S. C.S.R., J. Craus, J.A.Deacon, and C.L. Monismith.
Summary Report011Fatigue Response of Asphalt Mixtures. SHRP-AI
IR-90-011, National Research Council, Washington, D.C.. Feb. 1990.
TRANSPORTATION RESEARCH RECORD /492
10. Monismilh, C.L. Summary Report 011 Permallent Deformation in
A!lphalt COl/crete, SHRP·A/lr-91-104, National Research Council.
Washington. D.C., Feb. 1991.
II. Kandhal. P. S., M. A. Khatri, and J. B. Motter. Evaluation of Particle Shape and Texture of Mineral Aggregates and Their Blends. Proc..
AAPT,Vol. 61, Feb .. 1992, pp. 217-240.
12. Servais, S. G,
c.,
andK.I. York. The Precision of an Aggregate Parti· c1e Size and Shape Test. Road& Transport Research. Vol. 2, No.2,1993, pp. 86-97.
13. EI Hussein. H. M., and A. O. A. Halim. Differential Thermal Expan-sion/Contraction-A Mechanical Approach to Adhesion in Asphalt Concrete. Conadiall Journal ofCil'il Engineering. Vol. 20. No.3, 1993, pp. 366-373.
14. EI Hussein.H.M., andZ.Q.Yue. Criteria for Evaluation of Rutting Potential Based on Repetitive Uniaxial Compression Test. In
Trans-portation Research Record1454. TRB. National Research CouncH, Washington, D.C.. 1994.
15. Ugh, P.,and P.J. van de Loa. Permanent Deformation of Asphalt
Mixes. Koninklijke/Shell-Laboratorium. Amsterdam, Nov. 1974.
16. Brown, S. F.. and C. A. Bell. The Validity of Design Procedures for the Permanent Deformation of Asphalt Pavements. Proc" Founh
Interna-tional Conference on the Structural Design of Asphalt Pal'ements,
VoLI,Ann Arbor, 1977, pp.467-482,
17. Roque, R.. and B.E. Ruth. Mechanisms and Modelling of Surface Cracking in Asphalt Pavements. Pmc., AAPT. Vol. 59, Feb., 1990, pp. 553-570.
18. Selvadurai, A. P. S.,M. C.Au., and W. A . Phang. Modeling of Low Temperature Behaviour of Cracks in Asphalt Pavement Structures.
Canadian Journal of Civil Engineering. Vol. 17, 1990, pp. 844-858.
19. Monismith, C.L. Analytically Based Asphalt Pavement Design and Rehabilitation: Theory to practice, 1962-1992. In Trallsportation Research Record1354,TRB, National Research Council, Washington, D.C .. 1992, pp. 5-26.
20. Movenzadeh, F. Asphalt Fracture. Proc. AAPT. Vol. 36, 1967, pp. 51-79.
21. Salam, Y. M., and C.L.Monismith. Fracture Characteristics of Asphalt Concrete. Froc. AAPT, Vol. 41, 1972, pp. 215-256.
22. Aglan,H.,I. Shehata, L. Figueroa. and A. Othman. Structure·fracture Toughness Relationships of Asphalt Concrete Mixtures. In
Trans-portation Research Record1353. TRB, National Research Council• Washington, D,C., 1992,pp.24-30.
23. Selvadurai, A. P. S., P.E.Joseph, and A. O. A. Halim. Evaluation of Fracture Resistance of Bituminous Materials. Proc.. Canadian Society
for Civil Engineering Annual Conference. Fredericton, N.B., 1993,
Vol. 4, pp, 287-296.
24. Kim, K. W., and H. M, El Hussein, Effect of Differential Thermal Contraction on Fracture Properties of Asphalt Materials at Low Temperature. Presented at 1995 AAPT Annual Meeting. July, 1994, 25. Gdoutos.E.E. Fracture Mechanics Criteria and Applications. Kluwer
Academic Publishers, London, 1991.
26. Rothenburg, L.. A. Bogobowicz, and R. Haas. Micromechanical Modelling of Asphalt Concrete in Connection with Pavement Rutting Problems. Proc., 7th International Conference0/1Asphalt Pavements,
Nottingham, UK, VoL1,1991, pp. 230-245.
27. Sepehr, K., O. J, Svec, Z.Q. Yue, and H.M. EI Hussein. "Finite Element Modelling of Asphalt Concrete Microstructure. In Localized
Damage Ill: Computer-Aided Assessment and Control, Proceedings of 3rd International Conference all Computer-Aided Assessment and Control: Localized Damage 94 (M. H. Aliabadi, A. Carpinteri, S. Kalisky, and D.J. Cartwright. eds.), Computational Mechanics Publications, Southampton, Boston, 1994, pp. 225-232.
28. Consuegra, A.. D. N. Little,H.LVon Quintus, andJ. BuratL Compar-ative Evaluation of Laboratory Compaction Devices Based on Their Ability to Produce Mixtures with Engineering Properties Similar to Those Produced in the Field. In Transportation Research Record 1228, TRB, National Research Council, Washington, D.C., 1989, pp. 80-87. 29. Svec, O.J.,and A. O. A. Halim. Field verification of a new asphalt compactor, AMIR. Canadian Journal of Civil Engineering, Vol. 18, 1991, pp. 465-471.
30. Emery, J.J.,W. Schenk J. J. Carrick, J. K, Davidson, W. K. MacInnis. andJ.A.KennepohI. Stone Mastic Asphalt Trials in Ontario. In
Trans-portation Research Record1427.TRB, National Research Council, Washington, D.C., 1993, pp, 47-53.
Publication of this paper sponsored by Committee on Characteristics of NOl1bituminous Compollents ofBituminous Paving Mixtures.
TRANSP<