HAL Id: hal-02996001
https://hal.archives-ouvertes.fr/hal-02996001
Preprint submitted on 9 Nov 2020
HAL is a multi-disciplinary open access
archive for the deposit and dissemination of
sci-entific research documents, whether they are
pub-lished or not. The documents may come from
L’archive ouverte pluridisciplinaire HAL, est
destinée au dépôt et à la diffusion de documents
scientifiques de niveau recherche, publiés ou non,
émanant des établissements d’enseignement et de
To cite this version:
Antoine Coutrot, E. Manley, D. Yesiltepe, R.C. Dalton, J. Wiener, et al.. Cities have a negative
impact on navigation ability: evidence from 38 countries. 2020. �hal-02996001�
Cities have a negative impact on navigation ability:
evidence from 38 countries
Coutrot, A.1,*, Manley, E.2,3, Yesiltepe, D.4, Dalton, R.C.4,5, Wiener, J. M.6, H¨olscher, C.7, Hornberger, M.8, Spiers, H. J.9,*
1 Laboratoire des Sciences du Num´erique de Nantes, CNRS, Nantes Universit´e, France. 2 Centre for Advanced Spatial Analysis, University College London, London, United Kingdom. 3 School of Geography, University of Leeds, Leeds, United Kingdom.
4 Department of Architecture and Built Environment, Northumbria University, Newcastle upon Tyne, United Kingdom.
5 School of Architecture, Lancaster University, Lancaster, United Kingdom.
6 Department of Psychology, Ageing and Dementia Research Centre, Bournemouth University, Poole, United Kingdom.
7 ETH Z¨urich, Swiss Federal Institute of Technology, Z¨urich, Switzerland. 8 Norwich Medical School, University of East Anglia, Norwich, United Kingdom.
9 Institute of Behavioural Neuroscience, Department of Experimental Psychology, Division of Psychology and Language Sciences, University College London, London, United Kingdom. * corresponding authors: [email protected] and [email protected]
Abstract
Cultural and geographical properties of the environment have been shown to deeply influence cognition and mental health. However, how the environment experienced during early life impacts later cognitive abilities remains poorly understood. Here, we used a cognitive task embedded in a video game to measure non-verbal spatial navigation ability in 442,195 people from 38 countries across the world. We found that on average, people who reported having grown up in cities have worse navigation skills than those who grew-up outside cities, even when controlling for age, gender, and level of education. The negative impact of cities was stronger in countries with low average Street Network Entropy, i.e. whose cities have a griddy layout. The effect was smaller in countries with more complex, organic cities. This evidences the impact of the environment on human cognition on a global scale, and highlights the importance of urban design on human cognition and brain function.
Introduction
Research on brain plasticity supports the notion that experience can shape brain structure as well as function [1, 2]. In particular, cultural and geographical properties of the environment have been shown to deeply influence cognition and mental health [3, 4]. In rodents, exploring complex environments has a positive impact on hippocampal neurogenesis and cognition [5]. In humans, spatial navigation activates the hippocampus [6], and continuous navigation of a large complex city environment increases posterior hippocampal volume [7]. While living near green spaces has been found to be strongly beneficial, urban residence has been associated with a higher risk of some psychiatric disorders [8–10]. However, how the environment experienced during childhood and early life impacts later cognitive abilities remains poorly understood for two reasons. First,
human environments are manifold and much harder to characterize than a rodent’s cage. Second, gathering cognitive testing of large samples from populations living in different environments is very costly. To overcome these limitations, we measured non-verbal spatial navigation ability in 3.9 million people across all countries and examined a subset of this data (442,195 people, in 38 countries). We used a cognitive task embedded in a video game, that is predictive of real-world navigation skill [11, 12]. We focused on spatial navigation due to its universal requirement across cultures, and parallels to rodent studies [13, 14]. We quantified the complexity of participants’ environment with OSMnx, a tool giving access to the street network topology of cities anywhere in the world [15]. We found that on average, people who reported having grown up in cities have worse navigation skills than those who reported growing up outside cities, even when controlling for age, gender, and level of education. This effect varied across countries, being for instance more than 6 times larger in the USA than in Romania. To investigate these variations we computed the average Street Network Entropy (SNE) of the biggest cities of 38 countries: grid-like cities (e.g. Chicago) have a small SNE, while more organic cities (e.g. Prague) have a higher one. We find a correlation between the average SNE and the extent to which growing up in a city negatively impacts spatial navigation ability. People growing up in countries with lower average SNE (griddy cities) have comparatively worse spatial abilities than their rural compatriots. This confirms the impact of the environment on human cognition on a global scale, and highlights the importance of urban design on human cognition and brain function.
Results and discussion
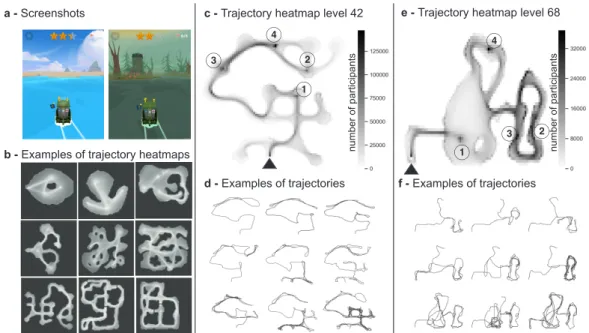
We used the Sea Hero Quest database, which contains the spatial navigation behaviour of 3.9 million participants measured with a mobile video game, ’Sea Hero Quest’ (SHQ) [11]. SHQ involves navigating a boat in search of sea creatures (Figure 1). Performance of SHQ has been shown to be predictive of real-world navigation ability [12]. It has also allowed to differentiate high-risk preclinical Alzheimer’s disease cases from low-risk participants [16]. Here, we focused on the wayfinding task [11], where players are initially presented with a map indicating the start location and the location of several checkpoints to find in a set order. A total of 3,881,449 participants played at least one level of the game. 60.8% of the participants provided basic demographics (age, gender, home country) and 27.6% provided more detailed demographics (home environment, level of education, see Methods). To provide a reliable estimate of spatial navigation ability, we examined the data only from participants who had completed a minimum of eleven levels of the game, and who entered all their demographics. We removed participants above 70 years old because we previously showed a strong selection bias in this group causing their perfor-mance to increase [11]. This resulted in 442,195 participants that were included in our analysis. Among them, 238,393 (age: 37.2± 13.5 years old) and 203,802 females (age: 38.0 ± 14.9 years old).
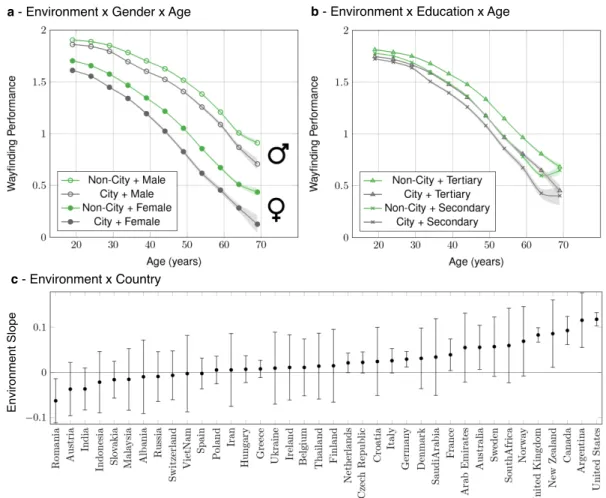
The environment effect and its interactions with age, gender and education -To quantify spatial ability, we defined the ”wayfinding performance” metric (W Fperf), which captures how efficient participants were in completing the wayfinding levels, while correcting for video-gaming skills (see Methods). A multivariate linear regression was calculated to predict wayfinding performance based on age, gender, education and environment. Age had the strongest effect (F1,442190= 66842, p < 0.001), followed by gender (F1,442190= 22991, p < 0.001), environ-ment (F1,442190= 1679.8, p < 0.001), and education (F1,442190= 1500.9, p < 0.001). Figure 2a represents the interaction between environment, age and gender, and Figure 2b represents the interaction between environment, age and education. We replicated previous studies showing that wayfinding performance decreases with age [17, 18], males performed better than females [19], and
1 2 3
4
a - Screenshots c - Trajectory heatmap level 42
b - Examples of trajectory heatmaps 1
2 3 4
e - Trajectory heatmap level 68
d - Examples of trajectories f - Examples of trajectories
nu m be r o f p ar tic ip an ts nu m be r o f p ar tic ip an ts
Figure 1. Wayfinding task Illustrations of the wayfinding task - a Screenshots of the game. b Nine examples of trajectory heatmaps out of the 75 levels. c - e Heatmaps of the trajectories of all participants in level 42 (N=171,887) and level 68 (N=40,251).The black triangle represents the starting position, and the circled numbers represent the ordered checkpoints the participants must reach. d - f Examples of trajectories in level 42 and 68.
performance increases with the level of education [20, 21]. Here we now report that participants raised outside cities are more accurate navigators than city-dwellers. Having a tertiary level of education while having grown up in a city is roughly equivalent to having a secondary level of education while having grown up outside cities in terms of wayfinding performance. The sample sizes for each demographic and country are available Table S1. The effect of education on wayfinding performance and its interactions with the other demographics are given in a separate report [22]. Given the magnitude of the dataset, most effects are likely to be ’significant below the 0.001 threshold’. In the following, we will focus on effect sizes as they are independent of sample size. To marginalize the effect of age, we computed Hedge’s g between the city and not-city groups within 5-years windows. Averaged over all age groups, g = 0.13, 95%CI=[0.12, 0.14], positive values corresponding to an advantage for participants who grew up outside cities. As shown in Figure S1, Hedge’s g remained stable across age. This stability is interesting as one could have hypothesized that the effect of the environment one grew up in could fade with age. This is consistent with the literature on the timing of enriched environment exposure in mice, showing that an early enriched environment exposure provides a ”reserve”-like advantage which supports an enduring preservation of spatial capabilities in older age [23].
The environment effect across countries - To quantify how the effect of the envi-ronment is distributed across countries, we fit a Linear Mixed Model (LMM) for wayfinding performance, with fixed effects for age, gender and education, and random effect for country, with random slopes for environment clustered by country: W Fperf ∼ age + gender + education + (1 + environment/country). To mitigate the selection bias, we removed participants from countries
c - Environment x Country
a - Environment x Gender x Age b - Environment x Education x Age
E nv iro nm en t S lo pe
Figure 2. Effect of Environment on Wayfinding Performance - Interactions with age, gender, education and country - a - Interaction with gender and age. b - Interaction with education and age. Wayfinding performance has been averaged within 5years windows. c -Interaction with country. We fit a linear mixed model for wayfinding performance, with fixed effects for age, gender and education, and random effect for country. We plot the environment slopes for each country, with positive values indicating an advantage for participants raised outside cities. d - Effect of the environment across age in Germany and in the USA. Wayfinding performance has been averaged within 10-years windows. In all panels error bars represent the standard errors.
with less than 500 players, or with education or environment classes more than 10-fold imbalanced (8% of included participants, total remaining: 416,620). This resulted in 38 countries included in our analyses (see Table S1). Figure 2c represents the environment slopes for each country, with positive values indicating an advantage for participants raised outside cities. In terms of Hedge’s g, this spectrum goes from Romania (g = -0.03, 95%CI=[-0.10, 0.04])) to the United States (g = 0.19, 95%CI=[0.17, 0.21]), positive values corresponding to an advantage for participants who grew up outside cities. Figure S2 illustrates this difference in effect size across age in different countries. For instance, while in Germany the effect size is close to being null, in the USA growing up in cities cost the equivalent of aging four years in terms of spatial ability.
a b c Low-SNE (2.5) (3.6) High-SNE Environment (S NE ) Effect Size St re et N et wo rk E nt ro py
Figure 3. Street Network Entropy (SNE) and environment effect in 38 countries -a Cities with low (Chic-ago, USA) -and high (Pr-ague, Czech Republic) street network entropy. b Distribution of the street bearings (36 bins). c Average SNE as a function of environment estimate in each country. Positive values indicate an advantage of participants raised outside cities compared to their urban compatriots. Squares and circles correspond to the low-SNE and high SNE country groups, determined with k-means (k=2).
The city topology influences spatial abilities - To explain the variation of the envi-ronment effect across countries, we considered that the topology of the street networks of cities has an effect on their inhabitants’ spatial ability. This effect has previously been theorized in the urban design literature [24, 25], but the empirical studies on street networks suffer from limitations, mostly due to data availability, gathering, and processing constraints [26, 27]. To overcome these limitations, we coupled our global dataset with OSMnx, a new tool allowing to download street networks for anywhere in the world via OpenStreetMap [15, 28]. We hypothesized that people who grew up in cities with more complex street networks (e.g. Figure 3a Prague, Czech Republic) would have a better sense of direction than people who grew up in grid-like cities (e.g. Figure 3a Chicago, USA). Hence, their sense of direction would be more similar to their compatriots who grew up in non-city areas. To quantify the complexity of a street network, we computed the Shannon entropy of the city’s orientations’ distribution (see Methods), which has deep theoretical connections with numerous complexity metrics [29, 30]. The smaller the entropy, the less complex - i.e. the more ordered - the city street network, see Figure 3b. The use of entropy was further motivated by the scaling hypothesis [31], which finds more turns along a route leads to higher than linear perceptions of distance travelled, due to chunking effect of turns [32, 33]. The ability to chunk spatial information and build hierarchical cognitive maps, allowing the flexible combination of “decision fragments”, has been shown to be an efficient strategy for complex trajectory planning [34–37]. By quantifying the variance in road angularity in a given street network, the entropy captures the need for an individual to hierarchically decompose complex trajectories into simpler sub-trajectories. People living in more entropic environments, more exposed to spatial decisions, would then be more likely to adopt such hierarchical and efficient planning strategy. To have one entropy value per country, we computed the Street Network Entropy (SNE), defined as the average of the Shannon entropy of the ten biggest cities of each
LMM G am e Le ve l E nt ro py G am e Le ve l E nt ro py
Environment Effect Size Positive scores mean worse performance in cities Environment Effect Size Game Level 42
entropy = 2.9 Game Level 68entropy = 3.4
a b
c
LMM Low-SNE participants
High-SNE participants
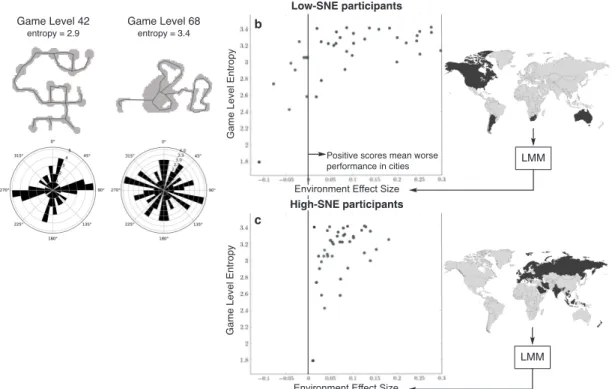
Figure 4. Entropy and environment effect in each game level for high and low-SNE participants - a The entropy of the Sea Hero Quest levels is computed from the bearing distribution (rose plot) of the game levels’ simplified Voronoi map. Shown for 2 example levels. b Two Linear Mixed Models (LMM) are computed, one with participants from Low-SNE country, the other from high-SNE country (see Figure 3c). Each LMM outputs one environment slope per game level. Positive values indicate an advantage of participants raised outside cities.
country in terms of population, weighted by the city population (Table S2). Figure 3c represents the SNE of countries as a function of their environment slope from the above mixed model. The majority of the countries have a similar SNE, corresponding the typical old core’s organic patterns (e.g. France, Romania, Spain, but also Thailand or India). However some other countries have distinctly smaller SNE, corresponding to the orthogonal grid, a very common planned street pattern (e.g. the United States, Argentina). The correlation between country SNE and their environment slope is significant (r = −0.58, p < 0.001). This validates our hypothesis: the lower the SNE (i.e. the simpler the street network), the worst the spatial ability of the people who grew up in cities compared to their compatriots raised outside cities.
The interaction between virtual and real-world topologies and their influence on spatial abilities - We also tested the symmetrical effect: do different SHQ level topologies interact with the effect of participant’s home environment? Here our hypothesis was that people growing up in environments with more complex topologies might perform better at more elaborate, entropic SHQ levels. Conversly, people growing up in grid-like cities might perform better at grid-like SHQ levels. We used k-means to split the countries into two SNE groups, revealing a low-SNE group and high-SNE group, see Figure 3c. We defined the SHQ level entropy as we did for the cities, with the orientations’ distribution computed from the level’s simplified Voronoi map (see Figure 4a and Methods for details). In order to include in our analysis as
many level topologies as possible, we ran the following analysis on a subset of participants who completed all SHQ levels (75 levels, 10,626 participants). We fit two LMM for wayfinding performance: one with the participants from low-SNE countries, the other with the participants from high-SNE countries, see Figure 4b. Both models had fixed effects for age, gender and education, and random effect for level, with random slopes for environment clustered by level: W Fperf∼ age + gender + education + (1 + environment/level). We included all the wayfinding levels (N=42). Figure 4c represents for each level its entropy as a function of the environment slope slow computed from participants in the low-SNE countries, and shigh computed from the high-SNE countries. Positive values correspond to an advantage of participants growing up outside cities. We observed that the only negative environment slopes correspond to low-SNE participants in less entropic levels (Figure 4c), suggesting that people used to less entropic environments (e.g. Chicago, USA) perform better in less entropic SHQ levels. The entropy of the levels was more correlated to low-SNE environment slopes (Pearson’s correlation rlow = 0.58, p < 0.001) than to high-SNE environment slopes (Pearson’s correlation rhigh = 0.41, p = 0.007). A co-correlation analysis showed that these two correlations were statistically different (Fisher’s z = 2.32, p-value = 0.02, 95% CI for rlow - rhigh= [0.03 0.36]) [38]. Removing the level with the lowest entropy, which could be considered an outlier, did not change the results substantially, rlow = 0.55, p < 0.001, and rhigh = 0.35, p = 0.03. A co-correlation analysis also showed that these two correlations were statistically different (Fisher’s z = 2.43, p-value = 0.02, 95% CI for rlow - rhigh = [0.04 0.39]) Limitations and Analysis Considerations In order to test a sufficient sample of partici-pants it was necessary to use a virtual world implemented via a mobile app. Because virtual navigation lacks the self-motion cues experienced in the real-world, one could argue that such a task might be more predictive of video games skill than real-world navigation. However, we have previously shown that navigation performance in Sea Hero Quest is predictive of navigating in the real world [12]. Here, we showed that, on average, growing up outside cities leads to better spatial ability than growing up in cities. This effect was modulated by the design of the cities in each country. The negative impact of cities on navigation was stronger in countries with simpler, grid-like cities than in countries with more complex, organic cities. A plausible interpretation is that city environments provide less challenge to navigate compared to rural environments, leading those who grow up in cities to becoming less adept at navigating, and this is exacerbated by growing up in a country that has predominantly grid-like cities. However, other factors associated with growing up in cities could be driving the differences in navigation. Our analyses indicate that neither education or video games skill was a factor underlying the differences between growing up in a city or non-city. Future studies using birth cohorts would be a useful way to address the impact of other factors that may be correlated with growing up a city. A critical aspect of our approach lies in the quantification of city ”complexity”. Urban pattern analysis is a vast interdisciplinary field of research, spanning from sociology [39] to architecture [40] and traffic forecast [41]. If a city’s culture and history influence its topology [42], the latter in return structures the behaviour, cognition and mental health of its inhabitants [8–10]. Space Syntax studies developed a set of metrics to quantify the different dimensions of the interactions between societies and urban patterns [43]. In this study we used the Shannon entropy of the street network orientations: the higher the entropy the more organic the city, the lower the more grid-like. This choice was motivated by the strong theoretical connections between entropy and many measures of complexity [29, 44]. Its implementation was enabled by OSMnx, which grants access to the street network of any city in the world [15]. However, the difficulty to navigate a city cannot be entirely captured by its topological complexity. Other factors, such as the presence of salient landmarks (e.g. the Eiffel Tower in Paris) can significantly help situate
oneself in space [45]. Studying the interaction between street networks complexity and landmark saliency would be a fascinating endeavor, but it requires building a database quantifying the saliency of city landmarks across the world. Similarly, we showed that participants who grew up in low-entropy cities were better at low-entropy Sea Hero Quest wayfinding levels than their compatriots who grew up in non-city areas. It was not true for participants who grew up in higher-entropy cities. This effect of the environment layout on spatial ability echoes recent studies showing that environmental barriers (e.g. streets) compartmentalize humans’ cognitive map, disrupting the way spatial information is encoded in the entorhinal cortex [46, 47].
We quantified game level’s entropy in the same way as for the cities (see Methods), which only captures a facet of level’s complexity. Further research will be needed to quantify the influence of visibility or landmark saliency on wayfinding performance in virtual environments, and its interactions with the participant’s home environment complexity. While our virtual levels varied entropy to a similar degree to real-world cities, the navigation task was simulated in rural settings (rivers and ocean terrain) and may have had some effect of performance differences, though notably, countries with greater access to oceans (e.g. smaller island countries) were not better navigators [11]. Future follow up research could target in more detail the experience of participants, looking at which regions they had grown up in. Here our data were available to determine nationality and whether the person grew up in a city or outside a city.
Conclusions
Exploring population-level cognitive performance in 38 countries, we reveal that growing up in a city appears to have cost for the development of navigation ability. The less entropic the cities of a country, the more negative their impact on spatial navigation ability. We show this effect is independent of age, gender, video games skill and education. Moreover, we find city dwellers from countries with less entropic cities show better performance at less entropic game levels. Conversely, city dwellers from countries with more entropic cities are better at navigating more complex game levels. These results indicate that the home environment of childhood and early life has an impact on cognitive ability, stable across the life-span. Future research will need to explore how these differences emerge during childhood through adolescence, where abrupt changes in ability can occur [48].
Methods
Data
The design and the data collection process of Sea Hero Quest have been thoroughly described in [11].
Video game - In this study we focused on the wayfinding task. At the beginning of each wayfinding level, participants were given locations to visit from a map. The map disappeared, and they had to navigate a boat through a virtual environment to find different checkpoints. Checkpoints were generally not encountered in the order of passage, but rather have to be navigated to by returning form one checkpoint to another (Figure 1). Participants were encouraged to collect as many ‘stars’ as possible across the levels: the faster the more stars were obtained. The first two levels were tutorial levels to familiarise the participant with the game commands. Participants - A total of 3,881,449 participants played at least one level of the game. To provide a reliable estimate of spatial navigation ability, we examined the data only from participants who had completed a minimum of eleven levels of the game, and who entered all their demographics.
We removed participants above 70 years old because we previously showed a strong selection bias in this group causing their performance to increase [11]. This resulted in 442,195 participants that were included in our analysis.
Demographic information - Demographics were provided by consenting participants in two steps. First, their age, gender and home country were asked. Then, after having played a few levels, participants were invited to provide further information such as their level of education and the type of environment they grew up in. Among the included participants there was 238,393 males (age: 37.2± 13.5 years old) and 203,802 females (age: 38.0 ± 14.9 years old). The levels (N = sample size) of education were: university (N=200455), college (N=121851), high-school (N=115537), and no formal (N=12897). We merged the university with the college levels due to their ambiguous meaning in some countries, and the high-school with the no formal level due to the relative low sample size of the latter. Hence, in our analysis the education variable had two levels: secondary (N=128434) and tertiary (N=322306). The levels of home environment were: city (N=141151), suburbs (N=146730), mixed (N=95316), rural (N=83397). We merged the mixed, suburb and rural levels together to facilitate the interpretation of the effect of growing-up in city (N=141151) and non-city (N=325443) environments.
For the analysis on the game level entropy, we included the participants that played all the Sea Hero Quest wayfinding levels (N = 10,626). They were 5219 males (age: 41.89 ± 15.95 years old), 5407 females (age: 41.98 ± 16.32 years old), 7429 with tertiary education and 3604 grew up in cities.
Behavioural data - We collected the trajectory of each participant across each level. The coordinates of participants’ trajectories were sampled at Fs = 2 Hz.
Metrics
Wayfinding performance - As in [11], we computed the trajectory length in pixels, defined as the sum of the Euclidean distance between the points of the trajectory. To control for familiarity with technology, we normalised the trajectory lengths by dividing them by the sum of their values at the first two levels. The first two levels only reflected video gaming skill (motor dexterity with the game controls) as no sense of direction was required to complete them. We defined an overall wayfinding performance metric corrected for video gaming skill (W Fperf) as the 1st component of a Principal Component Analysis across the normalized trajectory lengths of the first 4 wayfinding levels (levels 6, 7, 8 and 11, 60.5% of variance explained).
Street Network Entropy - We used the OSMnx toolbox to download the street network topology of cities from OpenStreetMap (OSM) [15]. For each included city we created a street network graph from OSM data within 1000 meters of the city geographical center. Then, we computed a 36-bin edge bearings distribution (1 bin every 10 degrees), taking one value per street segment. We initially took twice as many bins as desired, then merged them in pairs to prevent bin-edge effects around common values like 0 and 90 degrees. We also moved the last bin to the front, so e.g. 0.01 degree and 359.99 degrees were binned together. We calculated the Shannon entropy of the city’s orientations’ distribution.
H = − 36 X
i=1
P (oi)log(P (oi)) (1)
where i indexes the bins, and P(oi) represents the proportion of orientations that fall in the ith bin [30]. For each of the 38 countries included in our analysis, we defined the average Street
Network Entropy (SNE) as SN E = P1 iαi 10 X i=1 αiHi (2)
where (Hi)i∈[1..10] are the Shannon entropies of the 10 biggest cities in terms of population, and αi is the population of the ithcity (see Table S1).
Game Level Entropy - We calculated the Shannon entropy of the Sea Hero Quest level’s orientations’ distribution similarly as for the cities. To create the equivalent of ”streets” in the levels of the game, we computed the Voronoi regions from the game level’s layout, and took their edges. The Voronoi region boundaries are considered equivalent to road centre lines in the city context. We then used the Douglas-Peucker algorithm to simplify the line made of the connected segments [49], see Figure 4a. For all game levels, we used a maximum offset tolerance between the original and the simplified line of three pixels. The entropy of the orientation distribution of the Game Level’s segments was then computed with equation 1.
Data Availability
The dataset is available at this address: https://appagile-webdav-shq-jupyterhub-aazp003. appagile.io/ Besides the raw data, the server provides a platform to analyse the data in a JupyterHub, with 96 cores, 750 GB of memory and 100 TB of storage. A login/password to the server will be provided from the corresponding author upon request.
Code Availability
Analyses and figures were made using Python, R, and Matlab. Scripts are available from the corresponding author upon request.
Ethics
This study has been approved by UCL Ethics Research Committee. The ethics project ID number is CPB/2013/015
References
1. Hackman, D. A., Farah, M. J. & Meaney, M. J. Socioeconomic status and the brain: mechanistic insights from human and animal research. Nature Reviews Neuroscience 11, 651–659 (2010).
2. May, A. Experience-dependent structural plasticity in the adult human brain. Trends in Cognitive Sciences 15, 475–482 (2011).
3. van Praag, H., Kempermann, G. & Gage, F. H. Neural consequences of environmental enrichment. Nature Reviews Neuroscience 1, 191–198 (2000).
4. Clemenson, G. D., Deng, W. & Gage, F. H. Environmental enrichment and neurogenesis: from mice to humans. Current Opinion in Behavioral Sciences 4, 56–62 (2015).
5. Freund, J. et al. Emergence of individuality in genetically identical mice. Science 340, 756–759 (2013).
6. Spiers, H. J. & Maguire, E. A. Thoughts, behaviour, and brain dynamics during navigation in the real world. Neuroimage 31, 1826–1840 (2006).
7. Maguire, E. A., Woollett, K. & Spiers, H. J. London taxi drivers and bus drivers: a structural MRI and neuropsychological analysis. Hippocampus 16, 1091–1101 (2006). 8. K¨uhn, S. et al. In search of features that constitute an “enriched environment” in humans:
Associations between geographical properties and brain structure. Scientific Reports 7, 1–8 (2017).
9. Carey, I. M. et al. Are noise and air pollution related to the incidence of dementia? A cohort study in London, England. BMJ Open 8, 1–11 (2018).
10. Engemann, K. et al. Residential green space in childhood is associated with lower risk of psychiatric disorders from adolescence into adulthood. Proceedings of the National Academy of Sciences 116, 5188–5193 (2019).
11. Coutrot, A. et al. Global Determinants of Navigation Ability. Current Biology 28, 2861–2866 (2018).
12. Coutrot, A. et al. Virtual navigation tested on a mobile app is predictive of real-world wayfinding navigation performance. PLoS ONE 14, 1–15 (2019).
13. Sutherland, R. J. & Hamilton, D. A. Rodent spatial navigation: at the crossroads of cognition and movement. Neuroscience & Biobehavioral Reviews 28, 687–697 (2004). 14. Epstein, R. A., Patai, E. Z., Julian, J. B. & Spiers, H. J. The cognitive map in humans:
spatial navigation and beyond. Nature neuroscience 20, 1504 (2017).
15. Boeing, G. OSMnx: New methods for acquiring, constructing, analyzing, and visualizing complex street networks. Computers, Environment and Urban Systems 65, 126–139 (2017). 16. Coughlan, G. et al. Toward personalized cognitive diagnostics of at-genetic-risk Alzheimer’s
disease. Proceedings of the National Academy of Sciences 116, 9285–9292 (2019).
17. Klencklen, G., Despr´es, O. & Dufour, A. What do we know about aging and spatial cognition? Reviews and perspectives. Ageing Research Reviews 11, 123–135 (2012). 18. Lester, A. W., Moffat, S. D., Wiener, J. M., Barnes, C. A. & Wolbers, T. The aging
navigational system. Neuron 95, 1019–1035 (2017).
19. Nazareth, A., Huang, X., Voyer, D. & Newcombe, N. A meta-analysis of sex differences in human navigation skills. Psychonomic bulletin & review 26, 1503–1528 (2019).
20. Ritchie, S. J. & Tucker-Drob, E. M. How Much Does Education Improve Intelligence? A Meta-Analysis. Psychological Science 29, 1358–1369 (2018).
21. Susanne Ulrich, E. G. V. L. F. Who gets lost and why: A representative cross-sectional survey on sociodemographic and vestibular determinants of wayfinding strategies. PLoS ONE 14, 1–16 (2019).
22. Coutrot, A. et al. The impact of education on spatial ability depends on where you live. bioRxiv PP (2020).
23. Fuchs, F. et al. Exposure to an enriched environment up to middle age allows preservation of spatial memory capabilities in old age. Behavioural Brain Research 299, 1–5 (2016).
24. Lynch, K. The Image of the City (The Technology Press Harvard University Press, Cambridge, USA, 1960).
25. Marshall, S. Streets and Patterns (Spon Press, Abingdon, UK, 2005).
26. Watts, A., Ferdous, F., Diaz Moore, K. & Burns, J. M. Neighborhood integration and connectivity predict cognitive performance and decline. Gerontology and Geriatric Medicine 1, 1–9 (2015).
27. Koohsari, M. J. et al. Cognitive Function of Elderly Persons in Japanese Neighborhoods: The Role of Street Layout. American Journal of Alzheimers Disease Other Dementias 34, 381–389 (2019).
28. Boeing, G. A multi-scale analysis of 27,000 urban street networks: Every US city, town, urbanized area, and Zillow neighborhood. Environment and Planning B: Urban Analytics and City Science 1–18 (2018).
29. Boeing, G. Measuring the Complexity of Urban Form and Design. Urban Design Interna-tional 1–21 (2018).
30. Boeing, G. Urban Spatial Order: Street Network Orientation, Configuration, and Entropy. Applied Network Science 67, 1–20 (2019).
31. Sadalla, E. K. & Magel, S. G. The perception of traversed distance. Environment and Behavior 12, 65–79 (1980).
32. Klippel, A., Tappe, H. & Habel, C. Pictorial representations of routes: Chunking route segments during comprehension. In Spatial Cognition III, 11–33 (Springer Berlin Heidelberg, Berlin, Heidelberg, 2003).
33. Brunec, I. K., Javadi, A.-H., Zisch, F. E. & Spiers, H. J. Contracted time and expanded space: The impact of circumnavigation on judgements of space and time. Cognition 166, 425–432 (2017).
34. McNamara, T. P., Hardy, J. K. & Hirtle, S. C. Subjective hierarchies in spatial memory. Journal of Experimental Psychology: Learning, Memory, and Cognition 15, 211 (1989). 35. Martinet, L.-E., Sheynikhovich, D., Benchenane, K. & Arleo, A. Spatial learning and
action planning in a prefrontal cortical network model. PLoS computational biology 7, e1002045 (2011).
36. Huys, Q. J. et al. Interplay of approximate planning strategies. Proceedings of the National Academy of Sciences 112, 3098–3103 (2015).
37. McNamee, D., Wolpert, D. & Lengyel, M. Efficient state-space modularization for planning: theory, behavioral and neural signatures. Advances in Neural Information Processing Systems (NIPS) 4511–4519 (2016).
38. Diedenhofen, B. & Musch, J. cocor: A Comprehensive Solution for the Statistical Compar-ison of Correlations. PLoS ONE 10, e0121945 (2015).
39. Roy, A. Urban informality: toward an epistemology of planning. Journal of the american planning association 71, 147–158 (2005).
40. Katz, P., Scully, V. J. & Bressi, T. W. The new urbanism: Toward an architecture of community (McGraw-Hill, New York, USA, 1994).
41. Black, J. Urban transport planning: Theory and practice (Routledge, London, United Kingdom, 2018).
42. Smith, M. E. Form and meaning in the earliest cities: a new approach to ancient urban planning. Journal of Planning History 6, 3–47 (2007).
43. Hillier, B. Space is the machine: a configurational theory of architecture (Space Syntax, London, United Kingdom, 2007).
44. Batty, M., Morphet, R., Masucci, P. & Stanilov, K. Entropy, complexity, and spatial information. Journal of geographical systems 16, 363–385 (2014).
45. Ewing, R. & Handy, S. Measuring the unmeasurable: Urban design qualities related to walkability. Journal of Urban design 14, 65–84 (2009).
46. Horner, A. J., Bisby, J. A., Wang, A., Bogus, K. & Burgess, N. The role of spatial boundaries in shaping long-term event representations. Cognition 154, 151–164 (2016). 47. He, Q. & Brown, T. I. Environmental barriers disrupt grid-like representations in humans
during navigation. Current Biology 29, 2718–2722 (2019).
48. Nazareth, A., Weisberg, S. M., Margulis, K. & Newcombe, N. S. Charting the development of cognitive mapping. Journal of Experimental Child Psychology 170, 86–106 (2018). 49. Douglas, D. H. & Peucker, T. K. Algorithms for the reduction of the number of points
required to represent a digitized line or its caricature. Cartographica: the international journal for geographic information and geovisualization 10, 112–122 (1973).