HAL Id: hal-00072921
https://hal.archives-ouvertes.fr/hal-00072921
Submitted on 24 May 2006
HAL is a multi-disciplinary open access archive for the deposit and dissemination of sci-entific research documents, whether they are pub-lished or not. The documents may come from teaching and research institutions in France or abroad, or from public or private research centers.
L’archive ouverte pluridisciplinaire HAL, est destinée au dépôt et à la diffusion de documents scientifiques de niveau recherche, publiés ou non, émanant des établissements d’enseignement et de recherche français ou étrangers, des laboratoires publics ou privés.
Acoustic channel drop tunneling in a phononic crystal
Yan Pennec, Bahram Djafari-Rouhani, Jérôme Olivier Vasseur, Hocine Larabi,
Abdelkrim Khelif, Abdelkrim Choujaa, Sarah Benchabane, Vincent Laude
To cite this version:
Yan Pennec, Bahram Djafari-Rouhani, Jérôme Olivier Vasseur, Hocine Larabi, Abdelkrim Khelif, et al.. Acoustic channel drop tunneling in a phononic crystal. Applied Physics Letters, American Institute of Physics, 2005, 87, pp.261912. �hal-00072921�
Acoustic channel drop tunneling in a phononic crystal
Y. Pennec, B. Djafari-Rouhani, J.O. Vasseur, H. Larabi,
LDSMM, UMR CNRS 8024, Université de Lille1, Villeneuve d'Ascq, F-59650, France A. Khelif, A. Choujaa, S. Benchabane, V. Laude
Département LPMO, Institut FEMTO-ST, F-25044 Besançon cedex, France.
Abstract
We study both theoretically and experimentally the possibility of resonant tunneling of acoustic waves between two parallel guides created in a phononic crystal composed of steel cylinders in water. In the absolute bandgap of the phononic crystal, ranging from 250 to 325 kHz, a full transmission band exits for propagation inside a straight wave guide. We show that the transfer of a particular wavelength can occur between two parallel wave guides coupled together through an appropriate coupling structure. The latter is composed of isolated cavities interacting with stubs located at the sides of the wave guides.
The study of phononic crystals, which are the acoustic analogues of photonic crystals1, has received increasing attention during the last decade. These composite materials, which are constituted by a periodic repetition of two different solid or fluid constituents, can exhibit absolute band gaps in their transmission spectra.2,3 Due to their ability of confining and molding the acoustic waves in structures whose basic units are at the size of the wavelength, these materials can find new useful applications such as elastic filters, wave guides, mirrors, or transducers. Similarly to their photonic counterpart, several phenomena such as guiding4-8, bending8,9, filtering6,7 and demultiplexing10 of acoustic waves have been predicted theoretically and/or observed experimentally in these structures. In particular, during the last few years, we have devoted a great deal of theoretical and experimental works to the study of propagation of acoustic waves in a guide (created by removing a row of cylinders) in a two-dimensional phononic crystal composed of steel cylinders in water, as well as the interaction of such a guide with a cavity or a stub. For instance6, a cavity inside the guide permits to select a particular frequency to be transmitted, while the presence of a stub at the side of a wave guide leads to zeros of transmission, removing a few frequencies from the transmission spectrum.
Based on the above knowledge, the aim of this letter is to investigate for the first time, both theoretically and experimentally, the acoustic channel drop tunneling in a phononic crystal, namely the possibility of transferring one particular acoustic wavelength between two parallel wave guides coupled through an appropriate coupling element. The basic theoretical ideas for such a selective transfer to occur, leaving all other neighboring states unaffected, have been discussed thoroughly a few years ago by Fan et al11. The phenomenon was also demonstrated by a numerical simulation in a photonic crystal. Subsequent works have adapted the same idea to other systems or models12,13. In the case of the phononic crystal discussed
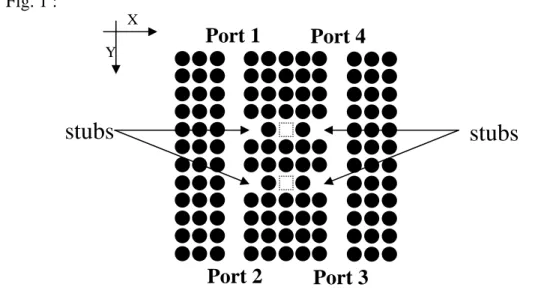
below, the coupling element is composed of two coupled cavities interacting with stubs located at the sides of the two parallel guides (see fig.1).
Our ultrasonic crystal is composed of a two dimensional square array of steel cylinders in water. The elastic parameters of the materials are summarized in table 1. The lattice parameter, a, is 3 mm and the diameter of cylinders is 2.5 mm, resulting in a filling fraction of 55%. Such a phononic crystal displays an absolute band gap ranging from 250 to 325 kHz5. The wave guides are formed (fig.1) by removing two parallel rods of steel cylinders along the direction of propagation (ΓX). The coupling element is constituted by two single-mode cavities, namely two vacancies obtained by removing two cylinders (see the dotted squares in fig.1). However, to ensure an efficient coupling between each cavity and the neighboring guides, we have grafted a stub to the side of the guide (figure 1). Let us notice that due to the simplicity of the geometrical model we were able to perform an experiment which is described in the second part of the paper.
Before going to the experiments, we first discuss the results of the theoretical calculations. The numerical simulations are based on a finite-difference time-domain (FDTD) program we have developed to calculate the transmission coefficients through perfect or defect-containing phononic crystals. The FDTD method, first applied to photonic crystal14 has been proven to be an efficient tool for the numerical simulation of the acoustic wave propagation in composite materials and, in particular, in phononic crystals15. This method solves the elastic waves equation by discretizing time and space and by replacing derivatives by finite differences.
The sample is constructed in three parts along the direction of propagation Y. The central region, which contains the finite size inhomogeneous phononic crystal, is sandwiched between two homogeneous media used for launching and probing the acoustic waves. Mur boundary conditions16 are applied at the extremities of the homogeneous parts in order to
avoid reflection of outgoing waves. Let us notice that in our FDTD calculation, the structure is periodically repeated along the X direction ; for instance, in the case of fig.1, the unit cell along X contains 13 rows of cylinders. This number is chosen in order to obtain a good compromise between the time needed for numerical simulations and the efficiency of isolating each unit cell from the neighboring ones. The space is discretized in both X and Y directions with a mesh interval of (a/50). The equation of motion are solved with a time integration step of 4ns with a number of steps equal to 221.
A broad band wave packet is launched in the first homogeneous region. The incoming wave is a longitudinal pulse, with a Gaussian profile along the directions X and Y. In the X direction, the incoming signal covers the entrance of port 1, leaving port 4 essentially unaffected. The transmitted signals are recorded as a function of time at ports 2, 3 and 4, integrated over the cross section of each wave guide, and finally Fourier transformed to obtain the transmission coefficients versus frequency. The spectra are normalized with respect to the one obtained without the phononic crystal sample.
Figure 2 displays the theoretical transmission respectively along a single straight wave guide, either when the guide is perfect, or when a stub is inserted at the side of the guide and when a single cavity is inserted inside the crystal. The guide exhibits a full transmission band of acoustic wave in the frequency range [270kHz, 300kHz] that covers a large part of the phononic crystal stop band. The insertion of the cavity (resp. a stub) gives rise to a filtering (resp. a rejecting) of a narrow frequency domain around 290 kHz in the transmission spectrum. It is interesting to notice that the resonances of both defects occur almost at the same frequency (f=290kHz), which again is in the favour of the coupling geometry shown in fig. 1.
In Fig. 3, we present the theoretical transmission through different ports of fig.1 when the incident signal is launched from port 1. One can observe that the direct transmission at port 2
drops almost to zero at the frequency of 290 kHz. At the same time a significant peak of transmission occurs at port 3, with magnitude comparable to the loss at port 2, while the signal at port 4 remains weak. This means that, at this frequency, the incoming signal is essentially transferred to the second wave guide towards port 3, leaving all other exits of the structure unaffected. In other words, the input signal tunnelled through the coupling element and dropped inside the second wave guide.
To obtain a direct confirmation of the demultiplexing phenomenon, the FDTD computation has been used to simulate a monochromatic source at the frequency f=290kHz. The computed displacement field along the direction of propagation is displayed in Fig. 4. The transfer of the input signal from port 1 to port 3 is clearly apparent with an absence of signal at port 2. Let us recall that, due to the periodicity of the structure along the X direction, the displacement field in the exit domain results from a superposition of the signals coming out of ports 3 in two neighboring cells. At port 4, still a weak signal is observed, probably due to the incident waves launched from the sources in two neighboring cells.
As already mentioned, the simplicity of the structure has been chosen with the aim of realizing the corresponding experiment. The experimental set-up is based on the ultra-sonic immersion transmission technique17. A couple of wide-band-width transmitter-receiver generator (Panasonic model 5800) produces a short duration pulse which is applied to the source transducer launching the probing longitudinal waves. The signal detected by the receiving transducer is acquired by the pulser/receiver, postamplified, and then digitised by a digital sampling oscilloscope. To reduce random errors, 500 measurements are averaged before a fast Fourier transform is performed to obtain the transmission spectrum. The system is first calibrated with no sample present; a reference signal is digitised and its spectrum is used to normalize the subsequent transmission spectra.
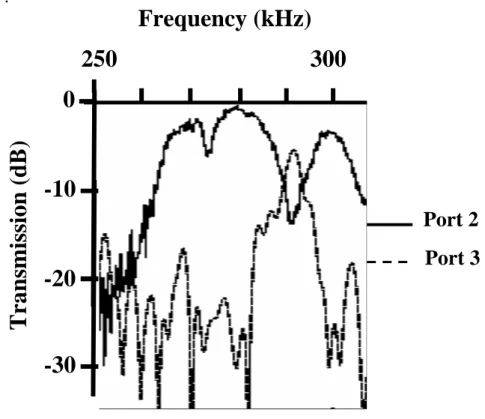
The measured transmissions are displayed in Fig. 5. The continuous and dashed lines represent the transmission spectra at ports 2 and 3 respectively. The main effect to point out is the sharp drop in the amplitude at port 2 together with a similar increase in the amplitude at port 3, occurring both at the frequency of 290 kHz as predicted by the theory. At resonance, the transmission at port 2 is estimated to be 10 to 15dB lower than the plateau obtained apart from the resonance. At the same time, the amplitude observed at port 3 is much higher at resonance than out of resonance. These behaviours are in semi-quantitatively good agreement with the results expected from theory. However, a discrepancy appears between theory and experiment when one compares the magnitude of the maximum transmitted signal at port 3 (at resonance) with the plateau of transmission at port 2 (out of resonance). While these magnitudes are quite comparable in theory, the maximum at port 3 remains 3 to 5 decibels lower than the plateau at port 2 in experiment. There are at least two reasons to explain this difference. First of all, our FDTD calculation does not take into account the dissipation phenomena that are present in experiment; for instance, we have observed, a few years ago12, a similar behaviour in demutliplexing experiments of electromagnetic waves in the microwave frequency range using coaxial cables. On the other hand, the theoretical evaluation of the transmitted signal is performed exactly at the exit of each port, while in experiments the receiver transducer is placed at some distance of the exits, and also somehow rotated in the measurement of signal at port 3. In view of the above points, we estimate that the agreement between theory and experiment is convincing as regards the phenomenon of signal drop from one wave guide to the other.
In conclusion, we have investigated experimentally and numerically the acoustic model of channel drop processes, well-known in the community of photonic crystals since the pioneering work of Fan et al8. The general device is composed of two continuum waveguides and a coupling element constituted by two cavities inserted in a phononic crystal made of
steel cylinders in water. The cavities are coupled to the waveguides through stubs grafted at the sides of the guides. This basic model has been chosen to realize experimental measurement in comparison with the theoretical simulation. We have demonstrated that at the frequency of f=290 kHz, we have a transfer of the wave between the two continuum through localized states of the coupling element. We have shown that this frequency corresponds to the resonant mode of the coupling element. Of course, the demultiplexing phenomenon could be improved or tuned by adjusting other parameters in the model such as the diameters and the nature of the cylinders surrounding the cavities in order to modify their interaction. Calculations in this direction are underway. Such devices could find their applications for frequency division multiplexing in acoustical systems.
References
1
J.D. Joannopoulos, R.D. Meade, and J.N. Win, Photonic Crystals, (Princeton University Press, Princeton,
1995) ; Photonic Crystals and Light Localization in the 21st Century, Ed. by C.M. Soukoulis, NATO Science
Series (Kluwer Dordrecht, 2001); J.M. Lourtioz, H. Benisty, V. Berger, J.M. Gérard, D. Maystre and A. Tchelnokov, Les cristaux photoniques (Lavoisier, Paris, 2003).
2
M. M. Sigalas and E. N. Economou, Solid State Commun. 86, 141 (1993).
3
M. S. Kushwaha, P. Halevi, L. Dobrzynski, and B. Djafari-Rouhani, Phys. Rev. Lett. 71, 2022 (1993).
4
M. Torres, F.R. Montero de Espinosa, D. Garcia- Pablos and D. Garcia, Phys. Rev. Lett. 82, 3054 (1999)
5
M. Kafesaki, M. M. Sigalas, and N. Garcia, Phys. Rev. Lett. 85, 4044 (2000).
6
A. Khelif, B. Djafari-Rouhani, J.O. Vasseur and P.A. Deymier, Phys. Rev. B 68, 024302 (2003); A. Khelif, B. Djafari-Rouhani, J.O. Vasseur, P.A. Deymier, P. Lambin and L. Dobrzynski, Phys. Rev. B 65, 174308 (2002).
7
A. Khelif, A. Choujaa, B. Djafari-Rouhani, M. Wilm, S. Ballandras and V. Laude, Phys. Rev. B 68, 0214301 (2003).
8
T. Miyashita, Jpn. J. Appl. Phys. Part1, 41, 3170 (2002).
9
A. Khelif, A. Choujaa, S. Benchabane, B. Djafari-Rouhani and V. Laude, Appl. Phys. Lett. 84, 4400, (2004).
10
Y. Pennec, B. Djafari-Rouhani, J.O. Vasseur, A. Khelif, and P.A. Deymier, Phys. Rev. E 69, 046608 (2004).
11
S.Fan, P.R. Villeneuve, J.D. Joannopoulos, and H.A. Haus, Phys. Rev. Lett. 80, 960 (1998); S.Fan, P.R. Villeneuve, J.D. Joannopoulos, M.J. Khan, C. Manolatou, and H.A. Haus, Phys. Rev. B 59, 15882, (1999).
12
J.O. Vasseur, A. Akjouj, L. Dobrzynasi, B. Djafari Rouhani and E.H. El Boudouti, Surface Science Reports 54, 1 (2004) .
13
S. Fasquel, X. Mélique, D. Lippens, and O. Vanbésien, Opt. Comm. 233, 305 (2004).
14
M.M. Sigalas and N. Garcia, J.Appl.Phys. 87, 3122 (2000).
15
Ph. Lambin, A. Khelif, J. O. Vasseur, L. Dobrzynski, and B. Djafari Rouhani, Phys. Rev. E 63, 066605 (2001).
16
G. Mur, IEE Trans. Electromagn. Compat. 23, 377 (1981).
17
A. Khelif, A. Choujaa, B. Dajafari-Rouhani, M. Wilm, S. Ballandras, and V. Laude, Phys. Rev. B, 68, 0214301 (2003).
Figure captions
Fig. 1 : Schematic view of the phononic crystal with two waveguides coupled through an element constituted by two cavities constituted by two vacancies (represented by dotted squares). Stubs along the guides ensure the efficiency of the coupling. Extremities of the two waveguides are labeled as ports 1 to 4.
Fig. 2 : Calculated transmission spectra: (a) through a straight wave guide in the phononic crystal, in the frequency range of the absolute band gap (from 250kHz and 320 kHz); (b) through a straight waveguide when a stub is inserted at the side of the guide; (c) for a single cavity inside the crystal.
Fig. 3 : Numerical transmission spectra at the outputs 2, 3 and 4 for an input Gaussian excitation coming from port 1. At the frequency of 290 kHz, the incident wave drops from the first to the second wave guide.
Fig. 4 : (color online). Calculated displacement field along the direction of propagation (averaged over one period of oscillation) at the frequency f=290kHz. Red color (respectively blue) corresponds to the highest (respectively lowest) value of the displacement field given in arbitrary units.
Fig. 5 : Experimental transmission spectra for the phononic crystal of Fig. 1. The channel drop process from port 1 to 3 is observed at 290 kHz as predicted numerically.
Material Water Steel
ρ (kg/m3
) 1000 7780
vL (m/s) 1490 5825
vT (m/s) - 3226
Fig. 1 :
stubs
Y XPort 1
Port 4
stubs
Port 2
Port 3
Fig. 2 :
(a)
Frequency (kHz)
Transmission (dB)
250
300
0
-10
-20
-30
(b)
Frequency (kHz)
Transmission (dB)
250
0
-10
-20
-30
300
(c)
Frequency (kHz)
Transmission (dB)
250 300
0
-20
-40
Frequency (kHz)
Port 3 Port 4 Port 2-30
-20
-10
0
300
280
Transmission (dB)
Fig. 4 :
0
0
30
60
90
-1
0
1
33
x (mm)
y (
m
m)
Fig. 5 :