Comparison of three radio-frequency discharge
modes on the treatment of breast cancer cells in
vitro
Jean-S ´ebastien Boisvert, Julie Lafontaine, Audrey Glory, Sylvain Coulombe and Philip Wong
Abstract—Non-thermal plasmas (NTPs) are known for their ability to induce thermal-free cytotoxic effects on cancer cells. However, asthe variety of NTP devices increases, comparison of their cytotoxic effect becomes increasingly essential. In this work, we compare the cytotoxicity of three different radio-frequency NTPs. MDA-MB-231 triple negative breast cancer cells are treated in suspension in DMEM culture medium by the effluents of a single radio-frequency (RF) discharge device operating in three modes, namely theΩand γmodes of the capacitively coupled radio-frequency (CCRF) discharge and a RF plasma jet mode. All three discharge modes reduce the proliferative capacity of MDA-MB-231 cells, but the treatment time required to reach the same efficacy is more than ten times longer using theΩand theγmodes than using the jet mode. In all cases, using the appropriate treatment time, cells exhibit an impaired proliferation and eventually start to show signs of cell death (about48 hafter treatment). The three discharge modes also induce nuclear DNA damages. Plasma-produced H2O2was not found to contribute to the cytotoxicity of the treatment. Furthermore, short-lived reactive species (liquid phase species with a lifetime below1 s) are expected to play an important role in the anti-cancer effect of all three discharge modes.
Index Terms—Non-thermal plasma, plasma oncology, triple negative breast cancer, plasma jet, radio-frequency discharge,
MDA-MB-231, suspension, DNA damages, proliferation.
F
1
I
NTRODUCTIONA
PPLICATION of non-thermal plasmas (NTP) to cancertreatment has become an effervescent field during the last two decades [1]. From in vitro fundamental research to early clinical trials, suggestions of the potential use of NTP as a new cancer treatment are numerous [2]. However, with a wide array of NTP sources and biological assays evaluating multiple cancer models, it is difficult to draw a uniform picture of the effect of NTP on cancer cells, even in vitro [3]. On the NTP side alone, the diversity is remarkable. For instance, non-thermal plasma jets can be sustained using multiple plasma forming gases, excitation frequencies (or waveforms) and electrode configurations [4], without hav-ing taken into account dielectric barrier discharges (DBDs) and other devices that are also used in plasma medicine [5]. On the biological side, the type of cancer and in vitro model used for plasma experiments are numerous, resulting in great variations in outcomes [6], [7]. In order to compare the cancer treatment capability of different NTPs while keeping variability to a minimum, biological parameters should be fixed and controlled as much as possible [3], [8].
In this work, a convertible radio-frequency field appli-cator was designed to generate three NTPs of different physical properties. In section 2, the convertible plasma jet device is described while in section 3 some basic plasma
• Jean-S´ebastien Boisvert, Julie Lafontaine Audrey Glory and Philip Wong are with Institut du cancer de Montr´eal, CRCHUM, 900 rue St-Denis, Montr´eal.
E-mail: philip.wong.chum@ssss.gouv.qc.ca
• Jean-S´ebastien Boisvert and Sylvain Coulombe are with Plasma Processing Laboratory, Department of Chemical Engineering, McGill University, 3610 University Street, Montr´eal.
Manuscript received Month day, 2019; revised Month Day, Year.
diagnostics are performed. Application of the convertible plasma jet device to the treatment of triple negative breast cancer cell line MDA-MB-231 is presented in section 4. The results are then discussed with respect to the different discharge modes in section 5.
2
E
XPERIMENTAL METHODS2.1 Plasma jet and diagnostics
2.1.1 Mechanical design of the field applicator
The electrode configuration of the convertible plasma jet de-vice is a coaxial configuration in which a dielectric material separates the ground electrode and the annular open gap for the flowing gas. The electrode configuration is shown in Fig. 1(a), where the ground electrode consists of a stainless steel tube (4 mm and 6 mm of inner and outer diameters, respec-tively) and the high-voltage electrode consists of a smaller diameter stainless steel tube (0.686 mm and 1.067 mm of inner and outer diameters, respectively). A quartz tube (3 mm and 4 mm of inner and outer diameters, respectively) acts as the dielectric barrier (εr = 3.75), placed directly
inside the grounded tube, thus leaving an annular gap for gas injection between the dielectric and the central powered tube electrode. The whole assembly forms a dielectric bar-rier discharge (DBD) configuration of 3 cm in length. As the high-voltage electrode is hollow [9], the plasma-forming gas can be injected either through it or through the annular gap. 2.1.2 Electrical design of the field applicator
In the electrical circuit of Fig. 1(a), the central electrode is connected to a 13.56 MHz RF power supply (Cesar model
Fig. 1. (a) Electrode configuration inside the field applicator (front view) and simplified electrical circuit showing the current and voltage mea-surements. (b) Sketch of the convertible plasma jet device during a treatment of cells in suspension in culture medium inside a microtube (jet mode).
1312) via a matching network (Navio 57020137-00D) and the external electrode is connected to the ground. The instan-taneous current and voltage are measured with a current transformer (Pearson 2877) placed around the grounded electrode wire and a high-voltage probe (Tektronix P6015) placed on the high-voltage electrode, respectively. The elec-trical measurements are recorded via a 100 MHz bandwidth digital oscilloscope (Tektronix TDS2014C). Integrating the product of current and voltage measurements over a com-plete excitation waveform period [10], the plasma power density is estimated to vary in the 1 W cm−3to 100 W cm−3 range, according to the discharge mode.
2.1.3 Control of the discharge modes
Using the electrode assembly of Fig. 1, it is possible to sustain three different discharge modes when a 13.56 MHz sinusoidal excitation waveform is fed to the high-voltage electrode. These discharge modes, described in section 3, are controlled using two parameters:
1) the applied power and
2) where the plasma-forming gas is injected.
In this work, all experiments are performed at atmospheric pressure (101.3 kPa) with helium (Praxair, 99.999% purity) injected either within the annular gas gap between the dielectric and the hollow high-voltage electrode or through the high-voltage electrode itself.
2.1.4 Basic plasma diagnostics
The optical emission of the discharge was collected by an optical fibre for emission spectroscopy, and directly with a camera for imaging. Optical emission spectra are sampled in the electrode area and collected with the tip of an optical fibre (600 µm core diameter) pointing directly toward the plasma. The optical fibre is connected to a spectrometer system (200 nm to 850 nm) through a 100 µm slit (Ocean Op-tics, Flame-S equipped with a Sony ILX-511B detector and a 600 line/mm grating). The optical emission spectroscopy system was corrected by its complete response curve using a Princeton Instruments Intellical lamp above 400 nm and a
900 W Tungsten lamp below. Pictures of the discharge are recorded with a CCD camera (Nikon D40). The camera is positioned either in front of the nozzle to collect the light coming from the electrode area or perpendicularly to the nozzle to collect the light emission produced outside of the nozzle. Finally, to determine the temperature within the treatment zone, a grounded thermocouple (Omega, TJFT72-K-SS-116G) was used.
2.2 Treatment method and biological diagnostics
To investigate the cytotoxicity of the different discharge modes produced by the convertible plasma jet device, the triple negative (estrogen receptor, progesterone receptor and HER2 negative) breast cancer cell line MDA-MB-231 is exposed to plasma and then analyzed with various assays. 2.2.1 Cell culture and NTP treatment
Human breast cancer cell line MDA-MB-231, genetically modified to express H2B-GFP (described elsewhere [11]) was used in this work. The cells were cultured in Dul-becco’s modified Eagle’s medium (DMEM) containing 10% foetal bovine serum and 1% penicillin streptomycin in a humidified atmosphere at 5% CO2 and 37◦C. A cell
sus-pension was prepared and a total of 1 × 10⁴ cells together with 400 µl of medium were distributed in non-adherent 1.5 ml microtubes (Eppendorf). In this work, the plasma treatment is performed directly within the microtubes (see [Fig. 1(b)]). Hence, the cells are treated in suspension rather than attached to the bottom of a petri dish. To perform the treatments, the nozzle of the plasma applicator is positioned inside the microtube, about 5 mm above the surface of the medium. As shown in Fig. 1(b), the distance of 5 mm was selected so that for all NTP treatments, including the jet mode, the visible plasma or flowing afterglow was not in contact with the medium. Treatments were performed with the different discharge modes using an applied power of 0 W to 35 W at the generator and a gas flow of 0.6 l min−1 to 4.3 l min−1, for a duration of 5 s to 300 s. After plasma treatment, for which the temperature of the medium is always found below 37◦C, cells were collected and seeded in multi-well plates for either proliferation or cell death assays, or prepared a for a DNA damage assay. The same plasma conditions and procedures were used to produce plasma treated medium (PTM), but in this case, cells are not present in the microtube during the treatment but are rather seeded in the multi-well plate after collecting PTM from the microtube.
2.2.2 Proliferation assay
Approximately within 1 h after plasma treatment, cells were seeded into 24-well plates and allowed to recover and prolif-erate over a period of 6 d. During this proliferation period, cells were maintained in 500 µl of medium per well. Only 20% of this medium was carried from the treated microtube. Subsequently, the recovered cells were fixed and stained in 10% methanol solution containing 0.5% Crystal Violet. Staining with CellTag 700 (LI-COR) allows quantification using the Odyssey imaging system (LI-COR Biotechnology).
2.2.3 Cell death measurement by propidium iodide uptake Approximately within 1 h after plasma treatment, cells were seeded into multi-well plates and 1 µg ml−1 of propidium iodide (PI) were added to each well. Cells were allowed to recover and proliferate over a time period of 6 d, while being monitored by live-cell fluorescence microscopy (IncuCyte S3 Live-Cell Analysis System). Frames were captured at 4 h intervals using a 10x objective. The percentage of PI-positive cells was calculated from the number of PI-PI-positive cells on the total number of cells (via the count of H2B-GFP positive nuclei) using the IncuCyteTM S3 software. During the incubation period, cells were maintained in 500 µl of medium per well. Only 20% of this medium was carried from the treated microtube.
2.2.4 DNA damage assay
DNA damages (mostly double strand breaks) are investi-gated using the neutral single cell gel electrophoresis assay (comet assay). The neutral comet assay was performed according to the manufacturer’s protocol and reagent kit (Trevigen, 4250-050-K). In brief, after plasma treatment, cells were resuspended in phosphate-buffered saline (PBS) and mixed with low melting point agarose. The cell-containing agarose was then pipetted onto microscope slides and incu-bated with a lysis buffer overnight at 4◦C. The next day, the slides were removed from the lysis buffer and immersed in neutral electrophoresis buffer. Electrophoresis was then performed at 21 V, during 25 min. After ethanol cleaning and drying of the slides, staining with SYTOX Green Nucleic Acid Stain (Invitrogen) was performed. Images were ac-quired by fluorescence microscopy (Zeiss, AxioObserver Z1) with a 10x objective using the AxioVision (Zeiss) software. The percentage of DNA in the tail and the tail moment were obtained using the OpenComet ImageJ plugin [12]. Positive control for DNA damages were obtained by treating the cells with radiation therapy. Cell suspensions were exposed to 8 Gy of γ irradiation with the help of a Caesium-137 source (Best Theratronics, Gammacell 3000 Elan), using the same vessel and preparation method as for the plasma treatment.
2.2.5 H2O2and pH quantification
The production of H2O2 by the interaction of the plasma
effluent with DMEM was investigated using the PierceTM Quantitative Peroxide Assay Kit, Aqueous-Compatible For-mulation (Thermo Scientific). Additionally, pH variations of the culture medium after exposure to plasma were measured using a pH meter (FiveEasy F20-Std-Kit, Mettler Toledo). For these measurements, DMEM culture medium microtubes were prepared and treated using the same pro-cedure as for the proliferation assay. No cell suspension was present during the treatments. H2O2and pH were then obtained following the manufacturer’s instructions.
3
C
HARACTERIZATION OF THE DISCHARGE MODESIn order to determine the influence of plasma on cancer cells, some basic plasma properties are first investigated. The nature of the discharge is identified with the help of
spectrally integrated light emission, and the plasma and electron energy are investigated with the help of emission spectroscopy.
3.1 Discharge modes
In order to observe the different discharge modes, the light distribution between the electrodes is measured with the help of a CCD camera. Discharge pictures are shown in Fig. 2(a) to (c), where the distribution of light emission is superimposed on a sketch of the electrodes and dielectric.
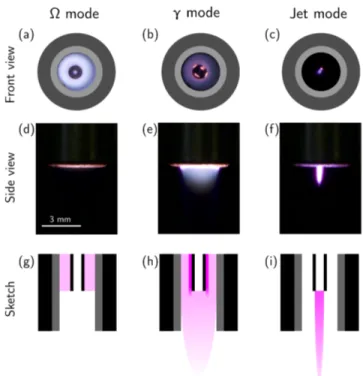
Fig. 2. Three discharge modes sustainable using the convertible plasma jet. (a) to (c) Digital photograph of the cross section (front view), showing the light distribution between the electrodes superimposed on a sketch of the electrodes and dielectric. (d) to (f) Digital photograph of the light emission exiting the nozzle (side view). (g) to (i) Sketch of the light emission inside and outside the nozzle showing the last3 mmof the nozzle. The CCD exposure is67 msin (a), 2.5 msin (b) and (c) and
769 msin (d),(e) and (f).
In Fig. 2(a), helium is flowing at a rate of 4.3 l min−1 in the annular region between the dielectric and the voltage electrode. No gas is injected through the high-voltage tube electrode, but a previous helium purge and the surrounding helium flow prevent air from accessing this region. The power applied at the generator is 10 W. Based on electrical measurements, the plasma power density is estimated at ∼ 7 W cm−3 (assuming a discharge volume defined by the annular gap and the length of the ground electrode). At such a reduced power, the light intensity is relatively low and uniform between the electrodes (in the ra-dial direction). This is typical of an atmospheric pressure RF discharge with a gas gap of about 1 mm [13]. This discharge mode is usually referred to as the Ω mode (sometimes α mode) [14], [15].
In Fig. 2(b), helium is flowing at a rate of 4.3 l min−1 in the annular gap (exactly as for the Ω mode) but a power of 20 W is applied at the generator. Based on electrical measurements, the plasma power density is estimated at
∼ 23 W cm−3 (assuming a discharge volume defined by
the annular gap and the length of the ground electrode). In this case, the light intensity distribution is non-uniform between the dielectric barrier and the high-voltage electrode (in the radial direction), with hot spots localized on the high-voltage electrode. Near the high-high-voltage electrode, the light intensity can be one order of magnitude higher than in the bulk of the discharge. In fact, this behaviour is typical of RF discharge at atmospheric pressure in the γ mode [14], [16]. In the present situation, the facts that only one dielectric barrier is present between the electrodes (on the ground electrode) [17] and that the radius of the high-voltage elec-trode is small (slight deviation from the uniform electric field produced in plane-to-plane configuration) favour the discharge in the γ mode to exhibit hot spots on the high-voltage electrode.
In Fig. 2(c), helium is flowing at a rate of 0.6 l min−1 through the high-voltage electrode and a power of 35 W is applied at the generator. No helium is injected in the annular gap, thus allowing air to fill this space. Consequently, as a helium channel is streaming out of the nozzle, a plasma is ignited in the region located at the tip of the high-voltage electrode. Due to the breakdown voltage that is much higher in air than in helium [18], no plasma is ignited in the annular gap. This results in a plasma that is completely different from the previously reported Ω and γ modes. Contrary to the Ω and γ mode, the plasma itself is allowed to exit the nozzle (see [Fig. 2(f)]) and is therefore referred to as the jet mode. Current and voltage measurements could not be performed on this mode, but based on radiometric com-parison to the Ω and γ modes, the plasma power density is estimated in the order of 100 W cm−3(assuming a discharge volume defined by the inner diameter of the high-voltage electrode and the length of the visible emission).
Even if these three discharge modes are all generated by an electric field oscillating at 13.56 MHz, the nature of the discharge and its geometry leads to very different schemes with respect to the potential application to living tissues. In fact, these discharge modes lead to a very different situation for a biological target located a few millimetres away from the exit nozzle.
1) In the Ω mode [Fig. 2(d)], no visible emission is ob-served. This suggests that only non-emitting long-lived gas phase species (such as O, O2(a1∆g), O3 N2O, etc.) can interact with the biological target. The treatment then necessarily occurs in the plasma effluent [19], [20].
2) In the γ mode [Fig. 2(e)], a visible flowing afterglow [21] is found at the exit of the nozzle. In such a situation, only a limited number of electrons, ions, and other short-lived species [22], [23] are present in the interaction zone with the biological target. The treatment could then occur within the flowing afterglow or in the plasma effluent.
3) In the jet mode [Fig. 2(f)], as supported by the in-tense light emission, the plasma itself exits the noz-zle. In this case, all the components of the plasma (electric field, charged particles, reactive species) could potentially interact with a biological target. In other words, depending on the selected distance
between the tip of the nozzle and the biological target, the treatment could occur within the plasma itself or in its effluent [24].
Let us note that in this work, the treatment of cancer cells is selected to always occur in the effluent in all three discharge modes, as neither the cells nor the culture medium containing the cell suspension is in visible contact with the plasma or the flowing afterglow.
Fig. 2(g) to (i) illustrate sketches of the plasma at the end of the nozzle (the last 3 mm of the nozzle). From these sketches, it is clear that in the Ω mode the plasma is confined in the annular region between the dielectric and the high-voltage electrode. However, in the jet mode, the plasma is not ignited in the same region and expands outside the nozzle, allowing it to interact with the biological target. With its flowing afterglow, the γ mode lies somewhere in between, as most of the plasma power density is consumed within the annular gap, but the plasma excitation zone is slightly extended outside of the nozzle. The treatment area is also highly dependent on the discharge mode as the diameter of the plasma-forming region is up to 7.1 mm2 in the Ω and γ modes, while it is of maximum 0.8 mm2in the
jet mode. For the remaining of this work, the applied power, helium flow, and gas injection configuration are fixed for each discharge mode. This is summarized in Table 1.
Ωmode γmode Jet mode Gas (ground electrode) He flow He flow Ambient air Gas (HV electrode) He He He flow He flow 4.3 l min−1 4.3 l min−1 0.6 l min−1
Applied power 10 W 20 W 35 W
TABLE 1
Summary of the experimental parameters fixed in this work so that the three discharge modes can be compared. In theΩand theγmodes,
the helium in the high-voltage electrode is assumed to be confined within the electrode but no flow is applied.
3.2 Optical emission spectroscopy
In order to compare the discharge modes, optical emission spectra are recorded. This is performed by placing the tip of the optical fibre 1 cm away in front of the nozzle (i.e. in the invisible effluent zone for all discharge modes). In this manner, the recorded light emission is integrated over the complete gas flow axis and represents the plasma emission itself in any discharge mode.
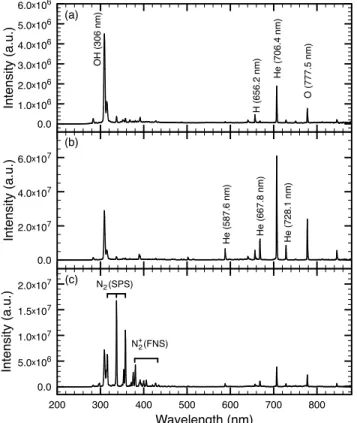
Fig. 3(a) displays the spectrum of the Ω mode for which the dominant emission is the OH(A2Σ+→X2Π) (band head
near 306 nm) molecular band often present in non-thermal atmospheric pressure discharge in contact with humid air environment [10], [25]. Other optical emission features typ-ically present in atmospheric pressure helium plasma in contact with ambient air are the O(35P→35S) (centre wave-length at 777.5 nm) and the H(32P→22S) (centre wave-length at 656.2 nm) atomic lines. The He(33S→23P) (centre wavelength at 706.5 nm) atomic line is also an important emission, but other helium lines are barely visible. Over-all, this spectrum is typical of non-thermal atmospheric-pressure helium discharges with traces of ambient air [10]. In Fig. 3(b), the spectrum of the γ mode is shown. In
200 300 400 500 600 700 800 Wavelength (nm) 0.0 5.0x10⁶ 1.0x10⁷ 1.5x10⁷ 2.0x10⁷ In te n si ty (a .u .) (c) N (SPS) 2 N (FNS)2+ 0.0 2.0x10⁷ 4.0x10⁷ 6.0x10⁷ In te n si ty (a .u .) H e (5 8 7 .6 n m) H e (6 6 7 .8 n m) H e (7 2 8 .1 n m) (b) 0.0 1.0x10⁶ 2.0x10⁶ 3.0x10⁶ 4.0x10⁶ 5.0x10⁶ 6.0x10⁶ In te n si ty (a .u .) O H (3 0 6 n m) H e (7 0 6 .4 n m) O (7 7 7 .5 n m) H (6 5 6 .2 n m) (a)
Fig. 3. Optical emission spectroscopy of the different discharge modes. The light emission is integrated over the complete plasma volume. The discharge is in (a) theΩmode (exposure90 ms), (b) theγmode (exposure3 ms), and (c) the jet mode (exposure15 ms).
this case, the same emission species are present in the spectrum but the He (706.5 nm) becomes dominant over the trace impurities. Other typical helium lines of non-thermal atmospheric-pressure helium discharge becomes clearly visible, namely the He(33D→23P) (centre wave-length at 587.6 nm), the He(31D→21P) (centre wavelength at 667.8 nm) and the He(31S→21P) (centre wavelength at 728.1 nm). The overall intensity of the emissions in the γ mode compared to the Ω mode is in good agreement with the higher power density of the plasma, indicating that the electron energy and density are higher in the γ mode [26]. At last, Fig. 3(c) shows the spectrum of the jet mode. In this mode, as helium is only flowing in the high-voltage electrode and ambient air fills the annular space between the dielectric barrier and the high-voltage electrode, the plasma is surrounded by air. Hence, mixing with ambient air is much more important in the jet mode than in other modes. As a consequence, nitrogen molecular bands are much more intense. In fact, N2(C2Πu→B3Π
g) (second positive system)
and N2+(B2Σu+→X2Σ+
g ) (first negative system) become the
dominant emissions.
As the plasma volume and amount of ambient air mixing changes significantly according to the discharge mode, absolute emission intensity is not a suitable pa-rameter to compare the discharge modes. To mitigate the dissimilarities between the discharge modes, line ratios can be considered. In non-thermal atmospheric-pressure helium discharges, He(33D→23P)/He(33S→23P) and He(31D→21P)/He(31S→21P) are considered to be
good indicators of electron energy [27]. To investigate how the discharge mode affects the electron energy and eventu-ally the reactive species production, helium line ratios are displayed in Table 2.
Ωmode γmode Jet mode He(33D→23P)
He(33S→23P) 0.03 0.10 0.15 He(31D→21P)
He(31S→21P) 0.6 1.6 2.0
TABLE 2
Helium line ratios as an indicator of the electron energy in non-thermal atmospheric-pressure helium discharges.
From Table 2, it is clear that both ratios increase from the Ω, to the γ and to the jet mode, which suggests that the electron energy also increases. In terms of plasma chemistry, higher electron energy can be interpreted as more electrons possessing enough energy to produce a given chemical reac-tion. Let us note that the helium line ratios (and the electron energy) also vary slightly as a function of the plasma power within the γ and jet modes.
4
C
ANCER CELLS RESPONSE TO PLASMAUsing the three modes described in section 3, the potential anti-cancer effect of plasma is evaluated using different biological assays.
4.1 Cell proliferation after plasma exposure
It is expected that an efficient anti-cancer treatment should lead to the death of cancer cells. However, owing to the variety of cell death and appropriate biological markers to assess and classify it [28], it is usually recognized that the best way to quantify the cytotoxic effect of a treatment is based on the ability of the cells to proliferate after the treatment [29]. The proliferative capacity of the cells is shown in Fig. 4, where the cells were allowed to grow for 6 d after plasma exposure using different treatment times and discharge modes.
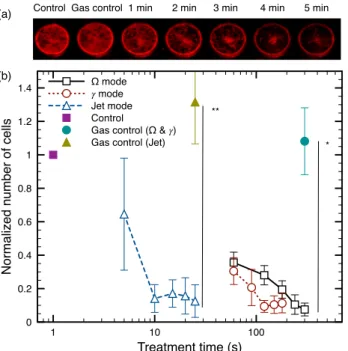
Fig. 4(a) shows representative images of the normalized MDA-MB-231 cancer cell number 6 d after treatment in the Ω mode. It is clear that untreated and gas flow treated cells (labelled as control and gas control) were able to colonize the well almost up to full confluence. However, as the duration of plasma treatment increases, the proliferative capacity of the cells decreases drastically. In Fig. 4(b), the number of cells normalized to the control as a function of treatment time is shown for the three discharge modes. After the proliferation period of 6 d, all three discharge modes can reduce the number of cells below 20% in comparison to the control. Even if this reduction of proliferation can reach the same level with all three discharge modes, the Ω mode requires longer treatment time than the γ mode, and much longer than the jet mode. With the jet mode, treatment time can be as low as 10 s, while in the Ω mode, several minutes are required to reach a similar anti-proliferative effect.
1 10 100 Treatment time (s) 0 0.2 0.4 0.6 0.8 1 1.2 1.4 N o rma lize d n u mb e r o f ce lls Ω mode 𝛾 mode Jet mode Control
Gas control (Ω & 𝛾) Gas control (Jet) (b)
Control Gas control 1 min 2 min 3 min 4 min 5 min (a)
* **
Fig. 4. Cell proliferation6 dafter plasma treatment. Different treatment times are presented for each mode (1 min, 2 min, 3 min, 4 minand
5 minfor theΩmode,60 s,90 s,120 s,150 sand180 sfor theγmode
and5 s,10 s,15 s,20 sand25 sfor the jet mode). (a) Example image of MDA-MB-231 culture stained with CellTag 700 for treatments in theΩ mode (all cells are marked in red). (b) Cell number (normalized to the control) as a function of exposure to plasma. Error bars represent the standard deviation on at leastn = 3independent experiments. Statisti-cal significance given by t-test with *= p < 0.05and **= p < 0.01.
4.2 Cell death dynamics
Even if the anti-proliferative capacity of plasma treatments could be assessed in section 4.1, results of Fig. 4 do not allow the investigation of the fate of individual cells after plasma exposure. To do so, cells are marked with PI after plasma treatment and then followed using live-cell fluorescence microscopy. The time evolution of the total number of cells and the percentage of cells marked with PI are shown in Fig. 5.
The total number of cells after exposure to different plasma treatments is shown in Fig. 5(a). In the control group, the cell count increases exponentially, indicating a normal proliferative capacity. However, all discharge modes presented in Fig. 5(a) show a completely different portrait than the control after a few days of incubation. The low total number of cells indicates that treated cells exhibit an impaired proliferation (confirming the results of Fig. 4). Fig. 5(b) presents the percentage of cells marked with PI as a function of time after the treatment. During the first day, almost no PI uptake is observed, indicating that cell membranes are not directly damaged by plasma. After 48 h, the percentage of PI-positive cells increases significantly for all discharge modes. The percentage of PI-positive cells does not rise above 60% because an important number of dead cells eventually detach from the well plate and no longer count as PI-positive.
Further insights in the cell death dynamics can be ob-tained by following the evolution of single cells by live-cell fluorescence microscopy. This is shown in Fig. 6 where a few cells were monitored after a treatment of 120 s in the
0 20 40 60 80 100 120 140 Time after the treatment (h)
0 20 40 60 80 100 Pe rce n ta g e o f PI p o si ti ve ce lls (% ) Ω mode ! mode Jet mode Control (a) (b) 10 100 1000 N u mb e r o f G F P ce lls Ω mode ! mode Jet mode Control
Fig. 5. Live-cell fluorescence microscopy of GFP fusion MDA-MB-231 marked with propidium iodide (PI). (a) Number of cells marked with GFP as a function fo time after plasma treatment in different conditions. (b) Percentage of PI positive cells as a function of time after plasma treatment for the different conditions. The conditions are:Ωmode for
300 s,γmode for180 s, jet mode for25 sand gas control for300 s. Error
bars represent the standard deviation on at leastn = 3independent experiments.
γ mode. In the control case [Fig. 6(f) to (j)], cells have a morphology typical of MDA-MB-231 and are proliferating normally. However, the cells that were exposed to the plasma treatment exhibit a completely different dynamics. Early after the treatment [Fig. 6(a)], it is clear that most cells are intact and morphologically similar to those present in the control group. Between 24 h and 60 h, cells seem to be
Fig. 6. Live-cell fluorescence microscopy of GFP fusion MDA-MB-231 marked with propidium iodide (PI) recorded at different times after treatment. In theγmode for120 sat (a)12 h, (b)36 h, (c)60 h, (d)72 h and (e)132 hafter the treatment. In the control group at (f)12 h, (g)24 h, (h)36 h, (i)48 hand (j)72 h.
attempting to divide and their cytoplasm tends to shrink. Only a few cells exhibit a PI uptake during this period. Finally, after 60 h most cells are marked with PI and some show fragmentation, likely a consequence of the formation of apoptotic bodies. It is worthy of note that the behaviour observed for the γ mode is representative of those observed using the Ω and the jet modes (data not shown).
4.3 Plasma-induced DNA damages
In order to identify potential DNA damages (mostly double strand breaks [30]) by plasma treatments, a comet assay was performed within 1 h of plasma exposure. The results are shown in Fig. 7. Subfigures (a), (b) and (c) display examples of comets for control (no treatment), plasma treated (300 s of Ω mode) and positive control (8 Gy). These images are typical of the neutral comet assay, for which DNA migration tails are smaller than for the alkaline comet assay [31]. In the control image, almost 100% of the DNA is found to be located in the comet head, while in the plasma and positive control cases, a significant portion of the DNA is found in the comet tail. In agreement with previously reported plasma cancer treatment experiments [32], the comet assay highlights the fact that plasma induces DNA damages to cancer cells.
Fig. 7(d) shows an example of a box-and-whisker plot of the percentage of DNA in the tail for different discharge modes after a single experiment. In this figure, the baseline level of DNA damage (median of the percentage of the DNA in the tail) is between 10% and 15% for the control and the gas flow control. This is typical of cancer cells [33], as they already encompass a significant amount of baseline DNA damages. Fig. 7(d) also shows that, for all conditions, the distribution of the percentage of DNA in the tail is defined by only one population (not necessarily normally distributed). Finally, Fig. 7(e) shows the mean of the percentage of DNA in the tail for four independent experiments (n = 4). It is found that, using any plasma treatment, the percentage of DNA in the tail reaches a level similar to the positive control. In fact, no statistically sig-nificant difference is observed between any discharge mode and positive control (8 Gy of radiation). In other words, for a given anti-proliferative effect, all discharge modes can be considered a DNA damaging agent.
4.4 Comparison of the treatment in suspension with
plasma treated medium
In this work, cells were exposed to plasma in the presence of culture medium. As a consequence, the anti-cancer effect of plasma could be secondary to indirect effects from the in-teraction between the medium and plasma. In other words, the anti-cancer effect of plasma might be caused by:
1) direct interaction of the gas phase reactive species with the cells and culture medium (through liquid phase short-lived species such as OH, H, NO, etc. [34]) or
2) long-lived liquid phase reactive species resulting from conversion of short-lived species that accumu-late in the culture medium over time (such as H2O2, NO2, H2, etc. [35]).
In the first case, cells actually need to be in contact with the gas phase effluents, while in the second case, the treatment is akin to an indirect treatment with PTM. In practice, it is complex to fully discriminate between these two situations. Due to the production of long-lived liquid phase reactive species during the treatment itself, long-lived species always potentially contribute to the treatment. However, it is possi-ble to discriminate between :
1) short-term exposure to both short-lived and long-lived reactive species (suspension) and
2) long-term exposure to long-lived liquid phase reac-tive species alone (PTM).
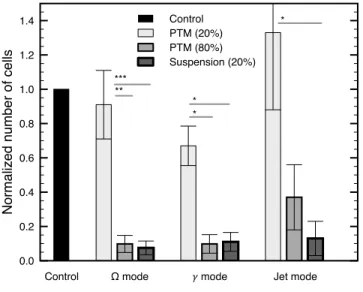
To verify that the treatment of cancer cells in suspension presented above is different from the indirect effects of PTM, a comparison of the two treatment methods is performed. This comparison is achieved using the proliferation assay (as in Fig. 4) with treatments for which cells are present or absent from the microtubes during plasma exposure. Results are shown in Fig. 8, where cells in suspension are seeded in the 24-well plate with 20% of treated medium (same as for the previous sections) or untreated cells are seeded in the 24-well plate with 20% or 80% of PTM.
First, whether the discharge is in the Ω, the γ or the jet mode, no statistically significant difference is observed between the control and the treatment of cells with 20% of PTM (same concentration as for the direct treatment of cells in suspension). As previously observed in Fig. 4, the direct treatment of cells in suspension followed by a proliferation assay (keeping 20% of the treated medium with the cells) significantly decreases proliferation (90% less than in the control). This clearly indicates that the long-term effect of 20% of PTM is not sufficient to provide the observed anti-proliferation capacity yielded by all discharge modes. In other words, whether tributary to the short-lived or the long-lived reactive species, it is the initial short-term RONS mixture that produces the anti-proliferation capacity in the treatment and not the long-term exposure of the cells to 20% of PTM.
Second, Fig. 8 indicates that 80% of PTM is enough to significantly affect the proliferative capacity of the cells. In fact, cell proliferation undergoes a decrease as important as for the treatment in suspension in both Ω and γ modes for a treatment with 80% of PTM. This suggests that in the absence of the initial high concentration of short-lived and long-lived reactive species, long-term exposure to long-lived reactive species alone can also lead to an anti-proliferative effect. In all cases, accumulation of H2O2 in the medium is not expected to contribute to the treatment, as it is always below detection level (about 1 µM, data not shown). In addition, no variation of pH (< 0.1) of the medium was observed after any treatment with respect to the control.
5
D
ISCUSSIONWhile plasma treatment of cancer cells in suspension is usu-ally not the preferred application method, it is an efficient model to compare the anti-cancer effect of different types of plasmas or discharge modes [19], [36]. In terms of anti-proliferative effect, the results shown above are in good agreement with other treatments by plasma in suspension
0 10 20 30 40 50 Pe rce n ta g e o f D N A i n t h e t a il (% ) Contro l Ω mo de 𝛾 mode Jet mo de (a) (b) (c) (d) Posit ive contro l Gas 0 10 20 30 40 50 Pe rce n ta g e o f D N A i n t h e t a il (% ) Contro l Ω mo de 𝛾!mode Jet mo de Posit ive contro l (e) Gas ***
Fig. 7. Comet assay showing the DNA damages induced by plasma treatment. Example of comet assay after (a) control, (b) treatment in theΩ mode, (c) positive control. (d) Standard box-and-whisker plot (box representing lower quartile, median and upper quartile and whiskers representing one standard deviation below and above the mean) of the percentage of DNA in the tail for all cells measured in the comet assay in each discharge mode for a single experiment. (e) Mean of the percentage of DNA in the tail in different discharge mode for multiple independent experiments
(n = 4) with the error bars being the standard deviation. Treatments are performed in theΩmode for300 s, in theγmode for180 sand in the jet
mode for25 s. Treatment times were chosen to give similar anti-proliferative effect. Positive control is obtained by irradiation with8 Gy. On average, about 75 cells were considered in each condition. Statistical significance given by t-test with ***= p < 0.001.
1 10 100 Treatment time (s) 0 0.2 0.4 0.6 0.8 1 1.2 1.4 N o rma lize d n u mb e r o f ce lls Ω mode 𝛾 mode Jet mode Control Control (Ω & 𝛾) Control (Jet) b) * ** 0.0 0.2 0.4 0.6 0.8 1.0 1.2 1.4 N o rma lize d n u mb e r o f ce lls Control PTM (20%) PTM (80%) Suspension (20%)
Control Ω mode ! mode Jet mode ***
**
* *
*
Fig. 8. Comparison of treatment in suspension and plasma treated medium using cell proliferation6 dafter plasma treatment. The method and experimental conditions are the same as in Fig. 4. The longest treatment time was used for each discharge mode:300 sin theΩmode,
180 s in the γ mode and 25 sin the jet mode. Error bars represent
the standard deviation on at leastn = 3 independent experiments. Statistical significance given by t-test with *= p < 0.05, **= p < 0.01 and ***= p < 0.001.
in the literature [19], [37], [38]. On the one hand, using the effluents of the Ω mode requires a treatment time of several minutes to produce its anti-proliferative effect. This is in agreement with its plasma properties that resemble those of the COST plasma jet [13], [19], [39]. On the other hand, treating cells in suspension with the effluent of the jet mode only requires a few seconds to yield the same anti-proliferative effect. In that case, the plasma properties are much closer to those of the kINPen plasma jet [36], [38]. Even if the COST and kINPen devices are the most often
used for plasma medical applications, they have very differ-ent plasma properties. One of the most basic parameters that differ significantly between these plasma jets is the electron energy [13], [24]. Electron energy is one of the most fundamental parameters that can drive the production of RONS, hence influencing the anti-cancer effect of plasma.
One of the key features of our experiment is that three discharge modes with different plasma properties are pro-duced using the same device and are evaluated using the same experimental procedure. Within the scope of the ex-periment, it is possible to associate the electron energy of each discharge mode with the efficacy of the treatment. This is done in Fig. 9 using the set of data presented in Fig. 4 and the helium line ratios given in Table 2 where the anti-proliferative effect of the plasma is given as a function of the mean of the normalized helium line ratios. As reported in Table 2, the electron energy (assuming the electron energy is proportional to the helium line ratios) increases from the Ω to the γ to the jet modes. Normalizing each line ratio to their value in the jet mode, it is found that the time to reach 90% of anti-proliferative capacity decreases when line ratios increase. While this relationship does not provide the precise reaction pathway from electrons within NTP to the RONS affecting cells within the medium, this suggests that a NTP with higher electron energy is more efficient to produce the RONS that can yield an efficient anti-cancer treatment.
As shown in Fig. 7, all discharge modes were able to induce DNA damages to MDA-MB-231. As the comet assay was performed about 1 h after treatment, some of the observed DNA damages could eventually be repaired over the course of time. Accordingly, the extent of the observed DNA damages cannot be directly linked to the fate of the cells. However, the amount of DNA damages measured by the neutral comet assay immediately after exposure to radiation therapy can be considered as a relative indicator of radiosensitivity [41]. In our experiment, the same amount of DNA damages is observed using any
dis-0 100 200 300 0.2 0.4 0.6 0.8 1 N o rma lize d n u mb e r o f ce lls Ω mode (a) (b) 0 50 100 150 200 Treatment time (s) Data Log-logistic 90% reduction 𝛾 mode 0 5 10 15 20 25 30 Jet mode 0.2 0.4 0.6 0.8 1
Normalized helium line ratio 0 100 200 300 400 T re a tme n t ti me t o re d u ce ce ll n u mb e r o f 9 0 %
Fig. 9. (a) Dose-response curves using a log-logistic fit [40] on the data of Fig. 4. The time required to obtain a 90% cell number reduction with respect to the control is indicated for all discharge mode (filled symbols). Error bars on the data represent the standard deviation on at least
n = 3independent experiments. Error bars on the 90% proliferation
reduction represent prediction error on the fit. (b) Relation between the mean of the normalized helium line ratios (values from Table 2 normalized to the jet mode value for each ratio) and the treatment time to reduce cell number of 90% with respect to the control. Horizontal error bars represent the standard deviation over the two line ratios and vertical error bars represent the prediction error on the log-logistic dose response fit of data from (a). Statistical significance given by a one-way ANOVA withp < 0.05.
charge mode (at a dose for which proliferation is similarly affected) or positive control (8 Gy of radiation therapy). Despite the generally accepted difference in the underlying physical mechanisms leading to cell death by plasma and radiation therapy (exogenous production of extracellular vs. intracellular RONS [42]), in the present experimental setup, it is possible that irradiation of cells in suspension with high energy photons (Caesium-137) relies on the same mechanisms as plasma treatment. As most of the irradi-ated volume (> 99%) is occupied by culture medium, the principal effect of radiation therapy might be related to radiation energy deposited within the liquid (as opposed to within cells). Via the detachment of low energy secondary electrons [43], irradiation could lead to the production of extracellular RONS in the medium that eventually penetrate cells to produce a cytotoxic effect. In such a situation, both plasma and radiation therapy would rely on the production of extracellular RONS.
Comparing the treatment of MDA-MB-231 cells in sus-pension with PTM, Fig. 8 showed that direct treatment is much more cytotoxic than PTM. This could be explained by the very low concentration of H2O2 observed in the treated medium (< 1 µM). H2O2 is likely rapidly scav-enged by pyruvate in the culture medium [44], [45], [46], disabling it from having any long-term effect on the cells.
Since H2O2 is considered one of the main plasma derived components causing biological effects [35], it can be ex-pected that, whether applied directly or indirectly, plasma should yield similar cytotoxic effect when H2O2 is allowed to accumulate in the medium containing the cells [47], [48]. As in the present work direct plasma and PTM have very different cytotoxicity, a more complex dynamic of the RONS interaction with the cells is expected. Another interesting feature of Fig. 8 is that PTM produced by the jet mode is less efficient at reducing cell proliferation than the PTM produced by the γ and Ω modes. This highlights the po-tential variability between the different discharge modes. This feature suggests that the jet mode is more efficient at producing short-lived reactive species, while the Ω and γ modes are more efficient at producing long-lived reactive species. These elements could be correlated to the treatment time, that is much longer with the latter modes than with the jet mode.
Even if the nature of cell death is a complex matter to settle, the facts that (1) plasma treatment immediately affects cell proliferation (Fig. 4), and that (2) cells are gradually driven to undergo cell death (Fig. 5 and Fig. 6), strongly indicate a form of regulated cell death (RCD). In addi-tion, observation of significant DNA damages shortly after treatment (Fig. 7) suggests that the dominant form of RDC could be mitotic death [49]. A possible mechanism would be that plasma treatment initially causes mitotic catastrophe. Then, although very low concentration of H2O2 is detected in our conditions (one of the RONS often recognized to lead to apoptosis in other plasma treatments [50]), low concentration of long-lived reactive species could be suffi-cient to induce mitotic death through intrinsic apoptosis. It is also possible that, due to the complex combination of extracellular RONS produced by the plasma [51], [52], more than one form of RCD occurs after plasma exposure. Further investigation is needed to clarify the ongoing form of RCD induced by our plasma treatments and method.
6
C
ONCLUSIONA convertible plasma jet device was designed to produce three different discharge modes. Feeding the device with a 13.56 MHz radio-frequency excitation waveform and he-lium gas flow, the Ω and γ modes of the atmospheric-pressure CCRF discharge were obtained. Additionally, a RF plasma jet could also be obtained only by changing the helium injection pattern. The cytotoxicity of the three dis-charge modes was then investigated on MDA-MB-231 triple negative breast cancer cell line. Treatments were performed with cells in suspension within DMEM culture medium, and only the gas phase effluent was put in contact with the cell-containing culture medium. The treatment time of the dif-ferent discharge modes to reach the same anti-proliferative effect was found to vary significantly from one mode to the other, the jet mode requiring less time than the other modes. A comparison of helium optical emission lines ratios in each discharge mode suggests a potential relationship between the electron energy within the plasma and the efficacy of the treatment (time required to reach similar cytotoxic effect on cancer cells). Using a treatment time that leads to an equivalent anti-proliferative effect in each discharge mode
was also found to induce a similar dynamic of cell death and an equivalent quantity of DNA damages, suggesting that all discharge mode lead to a similar form of regulated cell death. Finally, as the cytotoxicity of direct plasma treatment was found to be different from the one of plasma treated medium, the mechanism leading to cell death is expected to rely on the gas phase or liquid phase short-lived RONS. Further investigations need to be performed to clarify the nature of the cell behaviour and death after plasma expo-sure.
A
CKNOWLEDGMENTSThe authors would like to acknowledge funding from MEDTEQ grant number 8G (including contributions from NexPlasmaGen Inc. and InstaDesign Dev.), Mitacs grant number #IT10966 and FRQS grant numbers 32730 and 34612. The authors would also like to acknowledge NexPlas-maGen Inc. for its contribution of the convertible plasma device, Dr. Val´erie L´eveill´e for technical support and dis-cussions and Professor Franc¸is Rodier of Universit´e de Montr´eal for providing the fusion H2B-GFP modified MDA-MB-231 cell line used for this work.
R
EFERENCES[1] M. Laroussi, D. Graves, and M. Keidar, “Editorial plasma and can-cer treatment,” IEEE Transactions on Radiation and Plasma Medical Sciences, vol. 2, no. 2, pp. 85–86, 2018.
[2] H.-R. Metelmann, T. von Woedtke, and K.-D. Weltmann, Compre-hensive Clinical Plasma Medicine. Springer, 2018.
[3] S. Bekeschus, A. Lin, A. Fridman, K. Wende, K.-D. Weltmann, and V. Miller, “A comparison of floating-electrode dbd and kinpen jet: Plasma parameters to achieve similar growth reduction in colon cancer cells under standardized conditions,” Plasma Chemistry and Plasma Processing, vol. 38, no. 1, pp. 1–12, 2018.
[4] J. Winter, R. Brandenburg, and K.-D. Weltmann, “Atmospheric pressure plasma jets: an overview of devices and new directions,” Plasma Sources Science and Technology, vol. 24, no. 6, p. 064001, 2015. [5] K.-D. Weltmann and T. Von Woedtke, “Basic requirements for plasma sources in medicine,” The European Physical Journal Applied Physics, vol. 55, no. 01, p. 13807, 2011.
[6] A. Dubuc, P. Monsarrat, F. Virard, N. Merbahi, J.-P. Sarrette, S. Laurencin-Dalicieux, and S. Cousty, “Use of cold-atmospheric plasma in oncology: a concise systematic review,” Therapeutic advances in medical oncology, vol. 10, p. 1758835918786475, 2018. [7] E. Biscop, A. Lin, W. V. Boxem, J. V. Loenhout, J. D. Backer,
C. Deben, S. Dewilde, E. Smits, and A. Bogaerts, “Influence of cell type and culture medium on determining cancer selectivity of cold atmospheric plasma treatment,” Cancers, vol. 11, no. 9, 2019. [8] F. Jud´ee, J. Vaquero, S. Gu´egan, L. Fouassier, and T. Dufour,
“Atmospheric pressure plasma jets applied to cancerology: corre-lating electrical configuration with in vivo toxicity and therapeutic efficiency,” Journal of physics D: Applied physics, vol. 52, no. 24, 2019. [9] V. Leveille and S. Coulombe, “Design and preliminary charac-terization of a miniature pulsed rf apgd torch with downstream injection of the source of reactive species,” Plasma Sources Science and Technology, vol. 14, no. 3, p. 467, 2005.
[10] J.-S. Boisvert, J. Margot, and F. Massines, “Transitions between various diffuse discharge modes in atmospheric-pressure helium in the medium-frequency range,” Journal of Physics D: Applied Physics, vol. 49, no. 32, p. 325201, 2016.
[11] H. Fleury, N. Malaquin, V. Tu, S. Gilbert, A. Martinez, M.-A. Olivier, A. Sauriol, L. Communal, K. Leclerc-Desaulniers, E. Car-mona, D. Provencher, A.-M. Mes-Masson, and F. Rodier, “Ex-ploiting interconnected synthetic lethal interactions between parp inhibition and cancer cell reversible senescence,” Nature Commu-nications, vol. 10, no. 1, p. 2556, 2019.
[12] B. M. Gyori, G. Venkatachalam, P. Thiagarajan, D. Hsu, and M.-V. Clement, “Opencomet: An automated tool for comet assay image analysis,” Redox Biology, vol. 2, pp. 457 – 465, 2014.
[13] J. Golda, J. Held, B. Redeker, M. Konkowski, P. Beijer, A. Sobota, G. Kroesen, N. S. J. Braithwaite, S. Reuter, M. Turner, et al., “Concepts and characteristics of the ‘cost reference microplasma jet’,” Journal of Physics D: Applied Physics, vol. 49, no. 8, p. 084003, 2016.
[14] J. Shi and M. G. Kong, “Mechanisms of theαand γmodes in radio-frequency atmospheric glow discharges,” Journal of applied physics, vol. 97, no. 2, p. 023306, 2004.
[15] T. Hemke, D. Eremin, T. Mussenbrock, A. Derzsi, Z. Donk ´o, K. Dittmann, J. Meichsner, and J. Schulze, “Ionization by bulk heating of electrons in capacitive radio frequency atmospheric pressure microplasmas,” Plasma Sources Science and Technology, vol. 22, no. 1, p. 015012, 2013.
[16] M. G. Kong, G. Kroesen, G. Morfill, T. Nosenko, T. Shimizu, J. Van Dijk, and J. Zimmermann, “Plasma medicine: an introduc-tory review,” new Journal of Physics, vol. 11, no. 11, p. 115012, 2009. [17] J. Shi, D. Liu, and M. G. Kong, “Plasma stability control using dielectric barriers in radio-frequency atmospheric pressure glow discharges,” Applied physics letters, vol. 89, no. 8, pp. 081502– 081502, 2006.
[18] Y. P. Raizer, V. I. Kisin, and J. E. Allen, Gas discharge physics, vol. 1. Springer-Verlag Berlin, 1991.
[19] A. R. Gibson, H. O. McCarthy, A. A. Ali, D. O’Connell, and W. G. Graham, “Interactions of a non-thermal atmospheric pressure plasma effluent with pc-3 prostate cancer cells,” Plasma Processes and Polymers, vol. 11, no. 12, pp. 1142–1149, 2014.
[20] X. Lu, G. Naidis, M. Laroussi, S. Reuter, D. Graves, and K. Os-trikov, “Reactive species in non-equilibrium atmospheric-pressure plasmas: Generation, transport, and biological effects,” Physics Reports, vol. 630, pp. 1–84, 2016.
[21] C. M. Ferreira and M. Moisan, Microwave Discharges Fundamentals and Applications. Elsevier Science, 1993.
[22] K. Niemi, J. Waskoenig, N. Sadeghi, T. Gans, and D. O’Connell, “The role of helium metastable states in radio-frequency driven helium–oxygen atmospheric pressure plasma jets: measurement and numerical simulation,” Plasma Sources Science and Technology, vol. 20, no. 5, p. 055005, 2011.
[23] J. Levaton and J. Amorim, “Metastable atomic species in the n 2 flowing afterglow,” Chemical Physics, vol. 397, pp. 9–17, 2012. [24] S. Reuter, T. von Woedtke, and K.-D. Weltmann, “The kinpen—
a review on physics and chemistry of the atmospheric pressure plasma jet and its applications,” Journal of Physics D: Applied Physics, vol. 51, no. 23, p. 233001, 2018.
[25] S. Y. Moon, W. Choe, and B. Kang, “A uniform glow discharge plasma source at atmospheric pressure,” Applied physics letters, vol. 84, no. 2, pp. 188–190, 2004.
[26] J.-S. Boisvert, F. Montpetit, J. Margot, F. Vidal, and L. Stafford, “Time and space-resolved experimental investigation of the elec-tron energy distribution function of a helium capacitive discharge at atmospheric pressure,” Journal of Physics D: Applied Physics, vol. 52, no. 24, p. 245202, 2019.
[27] R. K. Gangwar, O. Levasseur, N. Naud´e, N. Gherardi, F. Massines, J. Margot, and L. Stafford, “Determination of the electron tem-perature in plane-to-plane he dielectric barrier discharge at atmo-spheric pressure,” Plasma Sources Science and Technology, vol. 25, no. 1, p. 015011, 2016.
[28] G. Kroemer, L. Galluzzi, P. Vandenabeele, J. Abrams, E. S. Alnemri, E. H. Baehrecke, M. V. Blagosklonny, W. S. El-Deiry, P. Golstein, D. R. Green, M. Hengartner, R. A. Knight, S. Kumar, S. A. Lipton, W. Malorni, G. Nu ˜nez, M. E. Peter, J. Tschopp, J. Yuan, M. Pia-centini, B. Zhivotovsky, G. Melino, and N. C. on Cell Death 2009, “Classification of cell death: recommendations of the nomencla-ture committee on cell death 2009,” Cell death and differentiation, vol. 16, pp. 3–11, 01 2009.
[29] M. O’Donovan, “A critique of methods to measure cytotoxicity in mammalian cell genotoxicity assays,” Mutagenesis, vol. 27, pp. 615–621, 09 2012.
[30] A. Azqueta and A. R. Collins, “The essential comet assay: a com-prehensive guide to measuring dna damage and repair,” Archives of Toxicology, vol. 87, pp. 949–968, Jun 2013.
[31] P. L. Olive and J. P. Ban´ath, “The comet assay: a method to measure dna damage in individual cells,” Nature Protocols, vol. 1, no. 1, pp. 23–29, 2006.
[32] C. Welz, S. Emmert, M. Canis, S. Becker, P. Baumeister, T. Shimizu, G. E. Morfill, U. Harr´eus, and J. L. Zimmermann, “Cold atmo-spheric plasma: A promising complementary therapy for
squa-mous head and neck cancer,” PLOS ONE, vol. 10, no. 11, pp. 1–15, 2015.
[33] Y. Yao and W. Dai, “Genomic instability and cancer,” Journal of carcinogenesis & mutagenesis, vol. 5, p. 1000165, 2014.
[34] P. J. Bruggeman, M. J. Kushner, B. R. Locke, J. G. E. Gardeniers, W. G. Graham, D. B. Graves, R. C. H. M. Hofman-Caris, D. Maric, J. P. Reid, E. Ceriani, D. F. Rivas, J. E. Foster, S. C. Garrick, Y. Gorbanev, S. Hamaguchi, F. Iza, H. Jablonowski, E. Klimova, J. Kolb, F. Krcma, P. Lukes, Z. Machala, I. Marinov, D. Mariotti, S. M. Thagard, D. Minakata, E. C. Neyts, J. Pawlat, Z. L. Petrovic, R. Pflieger, S. Reuter, D. C. Schram, S. Schr ¨oter, M. Shiraiwa, B. Tarabov´a, P. A. Tsai, J. R. R. Verlet, T. von Woedtke, K. R. Wilson, K. Yasui, and G. Zvereva, “Plasma-liquid interactions: a review and roadmap,” Plasma Sources Science and Technology, vol. 25, no. 5, p. 053002, 2016.
[35] A. Khlyustova, C. Labay, Z. Machala, M.-P. Ginebra, and C. Canal, “Important parameters in plasma jets for the production of rons in liquids for plasma medicine: A brief review,” Frontiers of Chemical Science and Engineering, vol. 13, pp. 238–252, Jun 2019.
[36] M. Weiss, D. G ¨umbel, E.-M. Hanschmann, R. Mandelkow, N. Gel-brich, U. Zimmermann, R. Walther, A. Ekkernkamp, A. Sckell, A. Kramer, et al., “Cold atmospheric plasma treatment induces anti-proliferative effects in prostate cancer cells by redox and apoptotic signaling pathways,” PloS one, vol. 10, no. 7, p. e0130350, 2015.
[37] A. Hirst, M. Simms, V. Mann, N. Maitland, D. O’connell, and F. Frame, “Low-temperature plasma treatment induces dna dam-age leading to necrotic cell death in primary prostate epithelial cells,” British journal of cancer, vol. 112, no. 9, p. 1536, 2015. [38] D. G ¨umbel, N. Gelbrich, M. Weiss, M. Napp, G. Daeschlein,
A. Sckell, S. A. Ender, A. Kramer, M. Burchardt, A. Ekkernkamp, et al., “New treatment options for osteosarcoma–inactivation of os-teosarcoma cells by cold atmospheric plasma,” Anticancer research, vol. 36, no. 11, pp. 5915–5922, 2016.
[39] Y. Gorbanev, J. Golda, V. S.-v. d. Gathen, and A. Bogaerts, “Ap-plications of the cost plasma jet: More than a reference standard,” Plasma, vol. 2, no. 3, pp. 316–327, 2019.
[40] C. Ritz, F. Baty, J. C. Streibig, and D. Gerhard, “Dose-response analysis using r,” PLOS ONE, vol. 10, pp. 1–13, 12 2016.
[41] S. Jayakumar, H. N. Bhilwade, B. N. Pandey, S. K. Sandur, and R. C. Chaubey, “The potential value of the neutral comet assay and the expression of genes associated with dna damage in assess-ing the radiosensitivity of tumor cells,” Mutation Research/Genetic Toxicology and Environmental Mutagenesis, vol. 748, no. 1, pp. 52 – 59, 2012.
[42] R. Moniruzzaman, M. U. Rehman, Q.-L. Zhao, P. Jawaid, K. Takeda, K. Ishikawa, M. Hori, K. Tomihara, K. Noguchi, T. Kondo, et al., “Cold atmospheric helium plasma causes syn-ergistic enhancement in cell death with hyperthermia and an additive enhancement with radiation,” Scientific reports, vol. 7, no. 1, p. 11659, 2017.
[43] H. Murshed, Fundamentals of Radiation Oncology: Physical, Biologi-cal, and Clinical Aspects. Elsevier Science, 3 ed., 2019.
[44] H. Babich, E. J. Liebling, R. F. Burger, H. L. Zuckerbraun, and A. G. Schuck, “Choice of dmem, formulated with or without pyruvate, plays an important role in assessing the in vitro cytotoxicity of oxidants and prooxidant nutraceuticals,” In Vitro Cellular & Developmental Biology - Animal, vol. 45, pp. 226–233, May 2009. [45] J. L. Kelts, J. J. Cali, S. J. Duellman, and J. Shultz, “Altered
cytotoxicity of ros-inducing compounds by sodium pyruvate in cell culture medium depends on the location of ros generation,” SpringerPlus, vol. 4, pp. 269–269, 06 2015.
[46] C. Bergemann, H. Rebl, A. Otto, S. Matschke, and B. Nebe, “Pyru-vate as a cell-protective agent during cold atmospheric plasma treatment in vitro: Impact on basic research for selective killing of tumor cells,” Plasma Processes and Polymers, vol. 16, no. 12, p. 1900088, 2019.
[47] D. Yan, A. Talbot, N. Nourmohammadi, X. Cheng, J. Canady, J. Sherman, and M. Keidar, “Principles of using cold atmospheric plasma stimulated media for cancer treatment,” Scientific reports, vol. 5, p. 18339, 2015.
[48] S. Vermeylen, J. De Waele, S. Vanuytsel, J. De Backer, J. Van der Paal, M. Ramakers, K. Leyssens, E. Marcq, J. Van Audenaerde, E. L. J. Smits, S. Dewilde, and A. Bogaerts, “Cold atmospheric plasma treatment of melanoma and glioblastoma cancer cells,” Plasma Processes and Polymers, vol. 13, no. 12, pp. 1195–1205, 2016.
[49] L. Galluzzi, I. Vitale, S. A. Aaronson, J. M. Abrams, D. Adam, P. Agostinis, et al., “Molecular mechanisms of cell death: recom-mendations of the nomenclature committee on cell death 2018,” Cell Death & Differentiation, vol. 25, no. 3, pp. 486–541, 2018. [50] S. Bekeschus, C. S. Sch ¨utz, F. Nießner, K. Wende, K.-D. Weltmann,
N. Gelbrich, T. von Woedtke, A. Schmidt, and M. B. Stope, “Elevated h2ax phosphorylation observed with kinpen plasma treatment is not caused by ros-mediated dna damage but is the consequence of apoptosis,” Oxidative Medicine and Cellular Longevity, vol. 2019, 2019.
[51] S. Mitra, L. N. Nguyen, M. Akter, G. Park, E. H. Choi, and N. K. Kaushik, “Impact of ros generated by chemical, physical, and plasma techniques on cancer attenuation,” Cancers, vol. 11, no. 7, 2019.
[52] F. Weinberg, N. Ramnath, and D. Nagrath, “Reactive oxygen species in the tumor microenvironment: An overview,” Cancers, vol. 11, no. 8, 2019.