RECONSTITUTIONS PALÉOENVIRONNEMENT ALES ET
PALÉOMAGNÉTIQUES À HAUTE RÉSOLUTION DE
SÉQUENCES SÉDIMENTAIRES PROVENANT DE LA BAIE
DE BAFFIN
Mémoire présenté dans le cadre du programme de maîtrise en océanographie en vue de l'obtention du grade de maître ès sciences
PAR
© MARIE-PIER ST-ONGE
UNIVERSITÉ DU QUÉBEC À RIMOUSKI Service de la bibliothèque
Avertissement
La diffusion de ce mémoire ou de cette thèse se fait dans le respect des droits de son auteur, qui a signé le formulaire « Autorisation de reproduire et de diffuser un rapport, un mémoire ou une thèse ». En signant ce formulaire, l’auteur concède à l’Université du Québec à Rimouski une licence non exclusive d’utilisation et de publication de la totalité ou d’une partie importante de son travail de recherche pour des fins pédagogiques et non commerciales. Plus précisément, l’auteur autorise l’Université du Québec à Rimouski à reproduire, diffuser, prêter, distribuer ou vendre des copies de son travail de recherche à des fins non commerciales sur quelque support que ce soit, y compris l’Internet. Cette licence et cette autorisation n’entraînent pas une renonciation de la part de l’auteur à ses droits moraux ni à ses droits de propriété intellectuelle. Sauf entente contraire, l’auteur conserve la liberté de diffuser et de commercialiser ou non ce travail dont il possède un exemplaire.
Composition du jury:
Gwenaëlle Chaillou, président du jury, Université du Québec à Rimouski Guillaume St-Onge, directeur de recherche, Université du Québec à Rimouski Torsten Haberzettl, examinateur externe, Friedrich Schiller University of Jena
REMERCIEMENTS
Je remercie Guillaume St-Onge pour la direction de mon projet de maîtrise, pour son temps, sa disponibilité, sa confiance et pour sa capacité à transmettre sa passion. Merci aussi à Gwenaëlle Chailloux pour avoir accepté d'être la présidente de mon jury, et pour l'influence positive qu'elle a eue au courant de mes études. Merci à Torsten Haberzettl d'être mon évaluateur externe et pour l'enrichissement scientifique qu'il m'a apporté.
J'adresse mes remerciements aussi au capitaine, à l'équipage et aux scientifiques à bord du NGCC Hudson lors de l'expédition océanographique HU2008-029 dirigée par Calvin Cambell et Anne de Vernal et financée par la Commission géologique du Canada et le Conseil de recherches en sciences naturelles et en génie du Canada (CRSNG). Ce projet de maîtrise a été financé par une bourse de maîtrise du Fonds québécois de recherche en nature et technologies (FQRNT), une subvention du CRSNG, une subvention de recherche en équipe du FQRNT et une subvention du ministère du Développement économique, de l'Innovation et de l'Exportation (MDEIE) dans le cadre de la participation canadienne au projet européen Past4future.
Merci à Anne de Vernal pour les discussions enrichissantes et pour le soutien qu'elle m'a apporté. Merci à Anne Jennings pour le partage de ses données et sa disponibilité à répondre à mes questions.
Un merci du fond du cœur à Francesco Barletta, Quentin Simon, Manuel Bringué et Agathe Lisé-Pronovost pour les discussions et explications ainsi que pour leur constant
soutien et leur précieuse amitié. Merci à Jacques Labrie et à sa merveilleuse capacité à résoudre des problèmes. Merci à Yanick et Élie pour leur soutien et pour avoir cru en moi.
Et un merci spécial à Jean-Claude Soulard et Pierre Letarte pour avoir fait germer en moi cet esprit et cette rigueur scientifique qui m'accompagnent aujourd'hui.
RÉSUMÉ
Le but de cette recherche est de reconstruire, à l'aide des propriétés physiques et magnétiques du sédiment, les changements environnementaux ayant eu lieu au cours de l'Holocène. Quatre longues séquences sédimentaires (HU2008-029-034PC, 038PC, -042PC et -070PC) ont donc été prélevées au Nord (Smith Sound et Jones Sound) et à l'Est (Disko Bugt) de la Baie de Baffin. De plus, sur trois de ces quatre carottes, les variations millénaires à séculaires de l'orientation du champ magnétique ont été reconstituées puis comparées à d'autres enregistrements provenant de l'Ouest de l'Arctique. Les résultats montrent que les quatre carottes, qui couvrent une période maximale de 12360 a cal BP jusqu'à aujourd'hui, présentent des faciès sédimentaires qui correspondent aux grands changements climatiques de l'Holocène, c'est-à-dire, la déglaciation et le maximum thermique. De plus, sur deux carottes (HU2008-029-038PC et 070PC), les signaux de deux évènements ayant une portée plus locale durant la période néo glaciaire ont été observés. Enfin, trois des quatre carottes (HU2008-029-034PC, -042PC et -070PC) ont présenté des propriétés magnétiques qui respectent les critères de qualité pour les enregistrements des variations d'orientation du champ magnétique terrestre. Les résultats ont donc été comparés avec d'autres carottes sédimentaires provenant de la mer de Chukchi et montrent que certaines variations millénaires à séculaires sont similaires de part et d'autre de l'Arctique canadien. Ce constat prend une place importante dans une meilleure compréhension du fonctionnement et du comportement du champ magnétique terrestre, spécialement dans l'Arctique. Cette découverte permet aussi une plus grande utilisation des résultats paléomagnétiques comme outil de chronostratigraphie.
Mots clés: Arctique, Baie de Baffin, Holocène, climat, paléomagnétisme, sédiment mann
ABSTRACT
The purpose of this research is to reconstruct, using the physical and magnetic properties of the sediment, environmental changes that occurred during the Holocene. Four long sediment sequences (HU2008-029-034PC, 038PC-, and-042PC - 070PC) have been taken in the North (Smith Sound and Jones Sound) and East (Disko Bugt) of Baffin Bay. In addition, three of the four cores were analyzed in order to reconstruct the paleomagnetic secular variation changes during the Holocene in Baffin Bay and compared to other records from the western Arctic. The results show that aIl four cores, which cover up to 12,360 cal
yr BP until today, have sedimentary facies that correspond to major climate changes of the
Holocene, i.e., deglaciation and the climatic optimum. In addition, for two cores (HU2008-029-038PC and 070PC), signaIs of two events during the Neoglacial period with a more local extent were observed. Finally, three of the four cores (HU2008-029-034PC, 042PC-and-070PC) have presented the magnetic properties that meet quality criteria for recording orientation variations of the geomagnetic field. The results have been compared with other sediment cores from the Chukchi Sea and show that sorne secular to millenia variations are similar at both sides of the Canadian Arctic. This observation took an important place in understanding the dynamic and behavior of the geomagnetic field, especially in the Arctic. This discovery also aIlows better use of paleomagnetic results as a chrono stratigraphie use.
Keywords : Arctic, Baffin bay, Holocene, climate, paleomagnetism, marine sediment.
TABLE DES MATIÈRES
REMERCIEMENTS ... VII RÉSUMÉ ... IX ABSTRA.CT ......... XI TABLE DES MATIÈRES ... XIII LISTE DES TABLEAUX ... XVII LISTE DES FIGURES ... XIX
INTRODUCTION GÉNÉRALE ... 1
LA BAIE DE BAFFIN ET LES CHANGEMENTS CLIMATIQUES ACTUELS ... 1
LA CIRCULATION OCÉANIQUE DANS LA BAIE DE BAFFIN ... 3
L'HoLOCÈNE DANS LA BAIE DE BAFFIN ... 3
LE CHAMP MAGNÉTIQUE TERRESTRE ET LES PARTICULARITÉS DE L'ARCTIQUE .. 5
OBJECTIFS ... 6
LES PROPRIETES PHYSIQUES ET MAGNETIQUES DES SÉDIMENTS DE LA BAIE DE BAFFIN: UN ENREGISTREMENT DES CHANGEMENTS ENVIRONMENTAUX ET DES VARIATIONS PALEOMAGNETIQUES SECULAIRES AU COURS DE L'HOLOCENE ... 7
1.1 RÉSUMÉ EN FRANÇAIS DU PREMIER ARTICLE ... 7
1.2 PHYSICAL AND MAGNETIC PROPERTIES OF BAFFIN BAY SEDIMENTS: A RECORD OF ENVIRON MENTAL AND PALEOMAGNETIC SECULAR VARIATION CHANGES DURING THE HOLOCENE ... 9
ABSTRACT ... 9
INTRODUCTION •••••••••••••••••••••••••••••••••••••••••••••••••••••••••••••••••••••••••••••••••••.••••••••••••••••••• 10 GEOLOGICAL AND ENVIRONMENTAL SETTING •••••••••••••••••••••••••••••••••••••••••••••••••••••• I l The Holocene in Baffm Bay ... 14
Sediment facies in Baffm Bay ... 15
MATERIAL AND METHODS ... 16
Coring sites and core handling ... 16
Wet bulk density and low-field volumetrie magnetic susceptibility ... 16
Diffuse spectral reflectance ... 17
Grain size ... 18
CAT -scan ... 18
Paleomagnetic analysis ... 18
Radiocarbon dating ... 20
Core top correlation ... 20
RESULTS ••••••••••••••••••••••••••••••••••••••••••••••••••••••••••••••••••••••••••••••.••••••.•••••••••.•.••••••.•••••••• 23 Lithostratigraphy, physical and magnetic properties ... 23
Natural remanent magnetization, magnetic mineralogy and grain size ... 29
CHRONOLOGY ••.••••••••••••••••••••••••••••••••••••••••••••••••••••••••••••••••••••••••••••••••••••••••••••••••••••• 33 ENVIRONMENTAL CHANGES DURING THE HOLOCENE AND SEDIMENT RESPONSE IN BAFFIN BAY ••••••••••••••••••••••••••••••••••••••••••••••••••••••••••••••••••••••••••••••••••••••••••••••••••••••••• 35 Site 34 - North Water Polynya ... 35
Site 38 - North Water Polynya ... 39
Site 42 - Jones Sound ... 40
Core 70 - Disko Bugt ... 43
P ALEOMAGNETIC SECULAR VARIATIONS IN THE EASTERN AND WESTERN CANADIAN ARCTIC ... 45
CONCLUSIONS •••••••••••••• ~ •••••••••••••••••••••••••••••••••••••••••••••••••••••.•.••••••••.••••••••••••••••••••••••• 49 ACKNOWLEDGEMENTS ••••••••••••••••••••••••••••••••••••••••••••••••••••••••••••••••••••••••••••••••••••••••••• 49 REFERENCES ••••••.•.••••••••••••••••••••••••••••••••••••••••••••••••••••••••••••••.••••••••.•.••.••••••••••••.•••••••. 50
xv
BACKGROUND DATASET ••••••••••••••••••••••••••••••••••••••••••••••••••••••••••••••••••••••••••••••.•••.••..•• 58
CONCLUSION GÉNÉRALE ... 63 RÉFÉRENCES BIBLIOGRAPHIQUES ... 65
LISTE DES TABLEAUX
Table 1. Coordinates and properties of the sampling sites ... l? Table 2. Radiocarbon dates ... 21
LISTE DES FIGURES
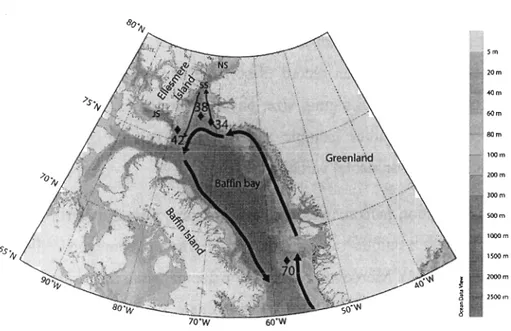
Figure 1. Map of Baffin Bay and the location of the four coring sites. The bathymetric base map is from Ocean Data View. Surface currents are based on Melling et al. (2001) and Tang et al. (2004). NS is for Nares Strait, SS for Smith Sound and JS for Jones Sound .
... 12 Figure 2. The continental shelf offshore Disko Bugt and the sampling location of core 70.
From Weidick and Bennike (2007). The black arrows indicates the melt flow direction ... 12 Figure 3. Core top correlation for cores (A) 32BC, 34TWC and 34PC, (B) 40BC and 42PC,
(C) 36BC, 38TWC and 38PC and (D) 68BC, 70TWC and 70PC. Open delta symbol represents the difference between each core. Colors illustrate the different sections .. 22 Figure 4. Downcore physical and magnetic properties with CT-Scan images for core A) 34, B) 38, C) 42 and D)70 ... 26
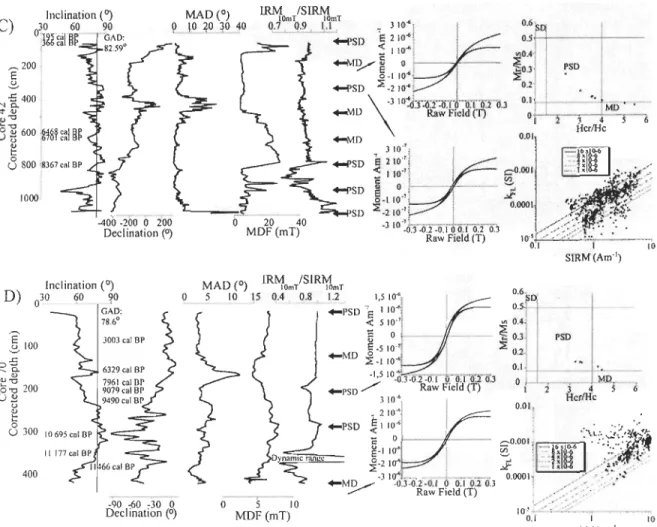
Figure 5. Downcore variations of inclination, declination, MAD values, MDF, pseudo-s
ratio as weIl as the magnetic grain size indicator SIRM vs kLF for cores A) 34, B) 38,
C) 42 and D) 70. The vertical line on the inclination graph indicates the expected GAD value for the latitude of each site. The magnetic grain size measurements also
represented in a Day plot with their associated hysteresis curves. The arrows indicate
where the u-channels were sub-sampled for the AGM measurements. The raw (red)
and high-field slope corrected (black) magnetizations are illustrated. Red dots in the Day plots are associated with MD grains ... 32
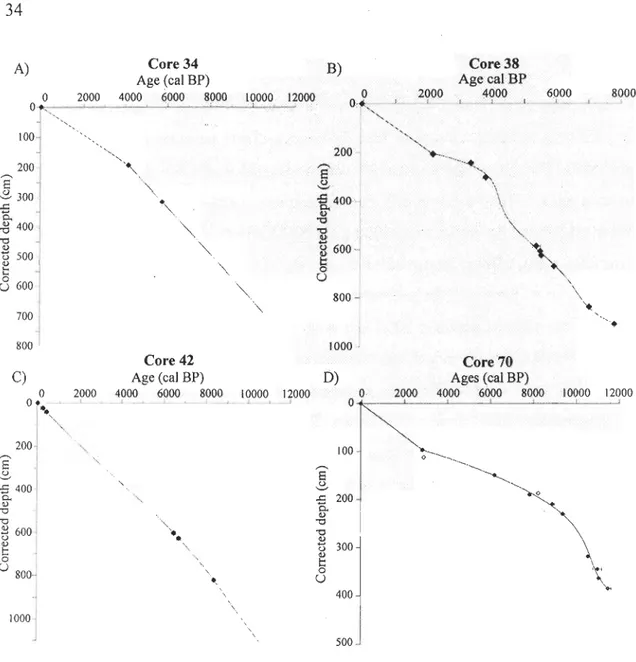
Figure 6. Age model for cores A) 34, B) 38, C) 42 and D) 70. The depths were corrected for the missing sediments due to piston coring. Error bars reflect the 20' ranges associated with the calibrated ages. Open symbols illustrate excluded ages ... 34 Figure 7. Downcore physical and magnetic properties with simplified lithology of cores A) 34, B) 38, C) 42 and D) 70 ... 37 Figure 8. Comparison between the MDF profile of core 42 and key paleoceanographic proxies of core HLY03-05GC from Jennings et al. (2011). TU is for the transiotionnal unit associated to the opening of Nares Strait observed in core HL Y03-05GC. LM is for the Last Glacial Maximum ... 42 Figure 9. Comparison of the magnetic susceptibility (blue squares) and density (black line) profiles of core 70 with temperature profiles from Weinick and Bennike (2007) and Dahl-Jensen et al. (1998) (ice core) ... 44 Figure 10. Comparison of inclination profiles between cores 34, 42 and 70 (this study) with cores from the eastern Canadian Arctic (Eastern Baffin bay stack; Andrews and J ennings, 1990) and western Canadian Arctic (HL Y050 1-08JPC; Lisé-Pronovost et
al., 2009, HLY0501-05; Barletta et al., 2008). The original age scale of the Eastern Baffin Island stack from Andrews and J ennings (1990) was converted to calibrated
ages ... 47
Figure Il. Comparison of the declination profiles between cores 34, 42 and 70 (this study)
with cores from the western Canadian Arctic (HLY0501-08JPC; Lisé-Pronovost et al., 2009, HLY0501-05JPC; Barletta et al., 2008) ... 48
INTRODUCTION GÉNÉRALE La baie de Bafîm et les changements climatiques actuels
La baie de Baffin est un bassin entourant un rift datant du Crétacé (MacLean et al., 1984). Le rift est entouré de demi-grabens plus récents qui se sont remplis de dépôts fluviaux deltaïques durant l'Éocène et le Pliocène (Li et al., 2011). La partie centrale du bassin atteint des profondeurs allant jusqu'à 2300 mètres (Li et al., 2011). Le plateau continental du côté ouest s'étend jusqu'à des profondeurs de 200-300 mètres avant d'atteindre le talus. Tandis que du côté Groenlandais, il atteint 400 à 500 mètres de profondeur (Li et al., 2011).
Sur le plan océanographique, la baie de Baffin est un élément clé de la circulation thermohaline puisqu'elle est un des lieux de transfert d'eau froide et de glaces provenant de l'Arctique vers l'Atlantique Nord où il y aura formation d'eau profonde (MÜllchow et al., 2006). C'est une baie aux multiples connexions: avec l'océan Atlantique par le détroit de Davis, avec l'Arctique principalement par le détroit de Nares, et avec l'archipel canadien par les détroits de Jones et Lancaster (figure 1). Mis à part la polynie des eaux du Nord, la baie de Baffin est recouverte de glace la majeure partie de l'année (Tang et al., 2004).
La polynie des eaux du Nord est une région qui est libre de glace pendant la plus grande partie de l'année. Elle est générée par un upwelling provoqué par les vents du Nord (Levac et al., 2001; Ingram et al., 2002). L'upwelling entraîne la remontée de cellules d'eau plus chaude que la surface, créant un havre pour la faune et flore (Levac et al., 2001;
Ingram et al., 2002). D'ailleurs, la Polynie des eaux du Nord est la région marine la plus productive au Nord du cercle Arctique (Barber et al., 2001b). Les polynies sont des systèmes océanographiques complexes, mais d'un intérêt majeur dans l'étude du climat. En effet, la période de couvert de glace permet la séquestration du carbone absorbé par les
algues le reste de l'année. En contrepartie, la période libre de glace est associée à un albédo plus faible entraînant une rétroaction positive sur le réchauffement climatique (Barber et al., 2001 b). La sensibilité au climat de cet écosystème particulier pourrait être comparée, selon Barber et al. (2001 a), au canari dans les mines de charbon en ce qui a trait aux changements climatiques actuels. Car une défaillance dans la dynamique des polynies, causée par les changements environnementaux actuels, serait un prélude à d'autres dysfonctionnements dans le système océanique global.
Une autre région de la baie de Baffin qui est d'un intérêt majeur pour l'étude du climat est Disko Bugt. C'est une baie d'approximativement 40000 km2 (Kelly et Lowell, 2009) dans laquelle se déversent les eaux de fon~e et les icebergs du glacier Jakobshavn
Isbrœ. Celui-ci est alimenté par jusqu'à 6,5% de toute la glace du Groenland (Weidick et Bennike, 2007). Les glaciers du Groenland sont très sensibles aux variations climatiques et sont aussi vulnérables face au réchauffement climatique actuel (Gregory et al., 2004; Hanna
et al., 2008). Les processus sédimentaires de Disko Bugt sont directement liés aux
variations du glacier Jakobshavn Isbrœ, et par conséquent, les changements climatiques.
Lorsque les conditions environnementales diminuent l'impact du glacier sur les processus de déposition dans la baie, c'est le courant de l'Ouest du Groenland (West Greenland Current: WGC) qui prend la relève. D'ailleurs, dans les conditions actuelles, c'est le WGC qui domine la circulation océanique de la côte Ouest du Groenland (Lloyd et al., 2007). Dans un scénario où le réchauffement climatique atteindrait une augmentation de 3°C au
Groenland, la fonte des glaciers provoquerait une augmentation du niveau marin moyen de
sept mètres pour une période d'au moins 1000 ans (Gregory et al., 2004).
D'après ce que l'on sait actuellement des changements climatiques, si la tendance se
maintient, l'Arctique sera libre de glace dans la seconde moitié du 21 e siècle (IpeC, 2007;
Zhang et Walsh, 2006). C'est une région très sensible aux changements climatiques qui
offre une vision accélérée du réchauffement de la planète. Le rapport de l'IPCC, en 2007,
. rapportait que l'augmentation des températures était deux fois plus importante en Arctique
3
de la Baie de Baffin, plus spécifiquement le détroit de Lancaster, est en quelque sorte la porte d'entrée au passage du Nord-Ouest qui se situe dans l'Arctique canadien et américain (Pharand, 2007). Cette région est donc d'un intérêt majeur au niveau environnemental,
politique et économique (Pharand, 2007).
La circulation océanique dans la Baie de Baffm
Tang et al. (2004) ont publié une étude basée sur une synthèse des données
disponibles depuis 80 ans, en plus de leurs propres analyses et modélisations. Cette étude
portait sur la variabilité de la circulation océanographique, des masses d'eau et de la
présence des glaces de mer dans la baie de Baffin. Selon les auteurs, la baie de Baffin se
compose de trois masses d'eau: les eaux de l'Arctique se situant dans les 100 à 300
premiers mètres de la baie, les eaux intermédiaires de l'Ouest du Groenland composant une couche située entre 300 et 800 mètres et les eaux profondes de la baie de Baffin présentent partout au-delà de 1200 mètres de profondeur (Tang et al., 2004). Au Nord de la baie,
particulièrement dans le détroit de Smith, la circulation est dominée par les eaux froides de
l'Arctique qui descendent vers le Sud. À la hauteur de Devon Island, le courant Arctique
rencontre le WGC. Celui-ci, après avoir remonté toute la côte Ouest du Groenland, est
défléchit. Il tourne vers l'Ouest à la baie de Melville (Qimusseriarsuaq) puis redescend
vers le Sud à partir de Cape York. La répartition verticale et horizontale des masses d'eau,
ainsi que la force des courants, sont influencées par une variabilité annuelle et interannuelle
(Tang et al., 2004).
L'Holocène dans la Baie de Baffm
L'Holocène dans la baie de Baffin peut se diviser en trois grandes étapes liées à des
changements environnementaux. Premièrement, les signatures sédimentaires associées à la
déglaciation du Nord de la Baie de Baffin sont datées autour de 10900-10500 a cal BP
(Knudsen et al., 2008; Levac et al., 2001). Toutefois, des indices d'une ré-avancée glaciaire
Baffin (Miller et al., 2005). La déglaciation s'accompagne d'un retrait progressif des glaces
des calottes Laurentidienne et Groenlandaise du détroit de Nares vers 9000 a cal BP (Jennings et al., 2011). Cela aurait permis la connexion entre l'Océan Arctique et l'Océan Atlantique et l'arrivée massive d'eau froide de l'Arctique dans la Baie de Baffin (Jennings et al., 2011; Knudsen et al., 2008; Levac et al., 2001). Il n'y a pas de signature
sédimentaire associée à cet évènement à Disko Bugt. Toutefois, le glacier Jakobshavn Isbrœ, qui aurait atteint Inner Egedesminde Dyb (chenal) au maximum glaciaire, se serait
progressivement retiré vers sa position actuelle pour laisser le WGC pénétrer l'intérieur de la baie et en contrôler les processus sédimentaires vers 7800 a cal BP (voir figure 2) (Lloyd et al., 2005).
Des reconstitutions océanographiques basées sur des assemblages de dinokystes
provenant de la baie de Baffin montrent que le climat se serait par la suite réchauffé pour
atteindre ce que l'on nomme l'Optimum climatique Holocène. Cette période, où les températures de surface auraient été 3°C plus élevées par rapport à aujourd'hui, a eu un maximum vers 6000 a cal BP (de Vernal et Rochon, 2011). À Disko Bugt, cette période se serait étendue de 4000 à 8000 a cal BP (Weidick et Bennike, 2007).
Finalement, suite à l'Optimum climatique Holocène, il y a eu la période des
néo glaciations (Weidick et Bennike, 2007; Jennings et al., 2011; Lloyd et al., 2005). Ce
sont des épisodes de refroidissement climatique, mais de magnitude régionale. Les origines et les amplitudes des trois principaux épisodes de néo glaciation sont bien décrites dans l'article de Wanner et al. (2011). Le premier d'entre eux a eu lieu entre 3300 et 2500 a cal
BP. Cet évènement froid coïncide avec une très faible activité solaire. Le deuxième, entre
1750 et 1350 a cal BP (AD 300-600) est aussi connu sous le nom de Migration Period
Co 0 ling. Ses origines sont encore discutées, mais des réavancées locales de glaciers ainsi
que des signes de sécheresses ont été observés pour cette période. Enfin, le dernier événement, qui comprend aussi le Petit âge glaciaire, a eu lieu de 700 à 150 a cal BP (AD 1250-1800). Il est associé à un grand minimum dans l'activité solaire et à de nombreuses et
5
2009) avancent que cet épisode pourrait aussi être lié à un changement vers un mode négatif de l'oscillation Nord Atlantique (NAO). Selon Wanner et al. (2011), d'autres études seront nécessaires afin éclaircir les incertitudes liées aux mécanismes et à la chronologie
des évènements climatiques holocène.
Le champ magnétique terrestre et les particularités de l'Arctique
L'échelle de temps basée sur la polarité géomagnétique est un outil fiable de stratigraphie pour les périodes de plusieurs centaines de milliers d'années. Sa découverte
nous a aussi permis de mieux comprendre la dynamique du champ magnétique terrestre.
Depuis les années 60, avec la découverte des anomalies magnétiques du plancher
océanique, les recherches abondent pour peaufiner l'échelle des temps de polarité géomagnétique (voir la revue de littérature sur le sujet de Opdyke et ChanneIl, 1996).
Depuis les années 80, des recherches ont été entreprises sur les enregistrements
sédimentaires afin d'approfondir les connaissances sur la géodynamo et la
magnétostratigraphie. Ces travaux ont montré que la paléointensité relative mesurée dans
des sédiments provenant de l'ensemble de la planète avait des variations communes et
cohérentes à des échelles millénaire et même séculaire (Brachfeld, 2007; St-Onge et al., 2003). Des compilations ont pu être réalisées afin de créer des courbes de référence, basées
sur des enregistrements sédimentaires régionaux (e.g.,Yamazaki et Oda, 2005; Stoner et al.,
2002; Gogorza et al., 2004; Barletta et al., 2010) et des modèles numériques (Korte et al., 2005).
La région de l'Arctique reste une énigme. La dynamique et le comportement du champ magnétique terrestre dans le haut Arctique sont méconnus (St-Onge et Stoner, 2011). Des questions demeurent sur les similitudes et les différences observées sur le peu d'enregistrements prélevés en Arctique (Korte et al, 2011). En les comparants à d'autres résultats provenant de plus basses latitudes, des théories peuvent naître sur le fonctionnement de la géodynamo et du champ magnétique terrestre (St-Onge et Stoner,
2011). Dans un contexte où le champ magnétique terrestre diminue d'intensité tout en se déplaçant à grande vitesse de l'Arctique canadien à la Sibérie (St-Onge et Stoner, 2011), il est primordial d'approfondir nos connaissances sur le comportement du champ magnétique terrestre dans l'Arctique.
Objectifs
Compte tenu de tous ces questionnements, les objectifs de cette maîtrise sont de (1) décrire et interpréter des unités sédimentaires associées à des changements environnementaux durant l 'Holocène dans la baie de Baffin et (2) reconstruire et décrire la variabilité du champ magnétiqlJe terrestre enregistrée dans l'Arctique à partir de quatre carottes sédimentaires prélevées au Nord de la baie de Baffin et au large de la baie de Disko afin de placer les changements actuels dans un contexte temporel et géographique plus important.
CHAPITRE 1
LES PROPRIÉTÉS PHYSIQUES ET MAGNÉTIQUES DES SÉDIMENTS DE
LA BAIE DE BAFFIN: UN ENREGISTREMENT DES CHANGEMENTS
ENVIRONNEMENTAUX ET DES VARIATIONS PALÉOMAGNÉTIQUES
SÉCULAIRES AU COURS DE L'HOLOCÈNE
1.1 RÉSUMÉ EN FRANÇAIS DE L'ARTICLE
Quatre longues séquences sédimentaires (HU2008-029-034PC, -038PC, 042PC et
-070PC) ont été prélevées au Nord (Smith Sound et Jones Sound) et à l'Est (Disko Bugt) de
la Baie de Baffin, dans le but de reconstruire, à l'aide des propriétés physiques et magnétiques du sédiment, les changements environnementaux ayant eu lieu au cours de
l 'Holocène. De plus, les variations millénaires à séculaires de l'orientation du champ
magnétique ont été reconstituées et comparées à d'autres enregistrements provenant de
l'Ouest de l'Arctique. Les datations au carbone 14 réalisées sur chacune des carottes
montrent des vitesses de sédimentation allant jusqu'à 136 cm/ka. Les résultats montrent que
les quatre carottes, qui couvrent une période maximale de 11850 a cal BP à aujourd'hui, présentent des faciès sédimentaires qui correspondent aux grands changements climatiques
de l 'Holocène, c'est-à-dire, la déglaciation et le maximum thermique. De plus, sur deux
carottes (HU2008-029-038PC et 070PC), les signaux de deux évènements ayant une portée plus locale durant la période néoglaciaire ont été observés. Enfin, trois des quatre carottes (HU2008-029-034PC, -042PC et -070PC) possèdent des propriétés magnétiques qui
respectent les critères de qualité pour les enregistrements des variations d'orientation du
champ magnétique terrestre. Les comparaisons avec d'autres carottes provenant de la mer
de Chukchi montrent que certaines variations millénaires· à séculaires sont similaires de part et d'autre de l'Arctique canadien. Cela suggère que le comportement du champ géomagnétique est similaire dans tout le Bas-Arctique, au moins jusqu'au 76~.
Cet article intitulé «Physical and magnetic properties of Baffin Bay sediments: a record of environmental and paleomagnetic secular variation changes during the Holocene» a été corédigé par moi-même, le professeur Guillaume St-Onge et par la chercheure Anne Jennings. Comme première auteure, je me suis chargée de la recherche, de la méthodologie, de la réalisation de toutes les analyses, de l'interprétation des résultats et de la rédaction. Le professeur Guillaume St-Onge a eu l'idée originale, a supervisé les travaux et a contribué à la rédaction. Anne Jennings, troisième auteure, a effectué de nombreuses analyses radiocarbones et contribué à l'établissement de la chronologie des carottes.
L'article sera soumis prochainement dans un numéro spécial portant sur la baie de Baffin dans la revue internationale Journal of Quaternary Science. La forme de l'article ainsi que celle des figures, des tableaux et des références sont celles exigées par la revue.
9
1.2 Physical and magne tic properties of Bafîm Bay sediments: a record of
environ mental and paleomagnetic secular variation changes during the Holocene
Marie-Pier St-Onge*1,2 and Guillaume St-Onge1,2
lCanada Research Chair in Marine Geology, Institut des sciences de la mer de Rimouski
(ISMER), Université du Québec à Rimouski, Rimouski, Canada
2GEOTOP Research Center, Montreal, Canada
*Corresponding author: Marie-Pier St-Onge, marie-pieLst-onge@ugar.gc.ca
Keywords: Paleoceanography, deglaciation, climatic optimum, Neoglacial, paleomagnetic
secular variations, Baffin Bay, Western Greenland, Disco Bugt
Paper submitted to the "Baffin Bay and the NW Passage" special issue of the Journal of
Quaternary Science
ABSTRACT: The physical and magnetic properties of four long sediment cores (HU2008-029-034PC, -038PC, -042PC and -070PC) sampled in Northern (Smith Sound and Jones Sound) and Western (Disko Bugt) Baffin Bay were analyzed in order to
reconstruct the environmental and paleomagnetic secular variation changes during the Holocene in Baffin Bay. The radio carbon dating performed on each core revealed
sedimentation rates up to 136 cm / ka. The results indicate that all four cores, which cover a
period from 12360 a cal BP to present, have sedimentary facies that correspond to the
major climatic changes of the Holocene: deglaciation and the climatic optimum. In addition, two cores (HU2008-029-038PC and -070PC), present the signal of two climatic events with a local influence during the Neoglacial period. Finally, three of the four cores
(HU2008-029-034PC, -042PC and -070PC) have magnetic properties that meet the criteria
of quality for recording directional variations of the geomagnetic field. Comparison with
other cores from the Chukchi Sea indicate that sorne millennial to secular variations are similar on both si des of the Canadian Arctic, suggesting that the geomagnetic field
behavior is similar up to at least 76~ in the low Canadian Arctic.
Introduction
The Baffin Bay region is a very important component of CUITent thennohaline circulation
because it is a pathway for Arctic fresh waters and ice to the North Atlantic Ocean, which is a site of deepwater fonnation and thus contributing to the global oceanic circulation. Similarly, the northern part of Baffin Bay is an area of sea-ice production, icebergs and a pathway for cold Arctic waters to the Labrador Sea (Tang et al., 2004; Holland et al.,
2001). This modem pattern of circulation in the North Atlantic Ocean took place during the Early Holocene, particularly with the opening ofthe Nares Strait at 9000 a cal BP (Jennings et al., 2011). The connection between the Arctic and Atlantic Oceans most likely triggered
local and global environmental changes, marked by associated sediment signatures. Many
other climatic events, such as the Neoglacial period (Wanner et al., 2011), may also have been recorded in this region.
The Disko Bugt area is also of special interest because of the proximity of the J akobshavn Isbrae ice stream, which is one of the fastest ice streams in the world (Lloyd, 2006), and
which drained ~6.5% of the Greenland Inland Ice (Weidick and Bennike, 2007). This is a
key area for the recording of environmental changes associated with Greenland glaciers and the West Greenland CUITent, which is a mixture of the warm Inninger CUITent and cold East Greenland CUITent (Andersen, 1981; Ribergaard et al., 2008; Tang et al., 2004; Lloyd, 2006; Krawczyk et al., 2010). Research on the influence of glaciers and CUITent variations upon sediment response is crucial because it is very hard to find unequivocal evidence of sea-ice margins' response to specific c1imatic changes (Lloyd, 2006). Having
II
paleoceanographic data from the northern and southern Baffin Bay establishes whether the Holocene climatic events were of local or regional extent. The physical and magnetic properties of marine sediments can record these changes at a high temporal resolution. Combined with other proxies, like grain size, physical properties, benthic and planktonic foraminiferal assemblages and/or isotopic analysis, they can be used to describe and constrain climatic and environmental variations.
In addition, high-resolution paleomagnetic data from cores near the North Magnetic Pole are rare and can present a unique vantage point on Holocene geomagnetic field dynamics (St-Onge and Stoner, 2011). Moreover, comparing paleomagnetic results to others from the Arctic region may aid in understanding the magnitude of secular to millennial scale variations of the Earth's magnetic field during the Holocene (e.g., Barletta et al., 2008;
Sagnotti et a!., 2011; Lisé-Pronovost et a!., 2009; Korte et al., 2011), allowing a better understanding of the geomagnetic field behavior in the Arctic as well as the development of an Arctic paleomagnetic dating tool (e.g., Barletta et al., 2010; Antoniades et al., 2011,
Olafsd6ttir et al., in press).
In this paper, we will (1) describe and interpret the sedimentary units associated with environmental variations during the Holocene in Northern Baffin Bay and offshore Disko Bugt regions, and (2) reconstruct paleomagnetic secular variations from these Arctic sites.
Geological and environ mental setting
Baffin Bay is located between Northeastern Canada and Western Greenland (Fig. 1). It is 450 km wide and 1300 km long (Aksu and Piper, 1987), and it connects the Arctic and North Atlantic Oceans via Nares Strait, Lancaster Sound and Jones Sound (Tang et a!.,
2004). Sediment transport is affected by fresh meltwater fluxes from land, icebergs, and seasonal pack ice (Perner et al., 2011). The dominant cUITent, consisting of cold Arctic waters, flows from West to East in the Jones Sound and from North to South in the Smith Sound (Tang et al., 2004).
Sm 'Om <Om OOm BOrn 100m 'OOm 300m SOOm 1000m 5S~ 1S00m 'OOOm 2S00m
Figure 1. Map of Baffin Bay and the location of the four coring sites. The bathymetric base map is from Ocean Data View. Surface currents are based on Melling et al. (2001) and Tang et al. (2004). NS is for Nares Strait, SS for Smith Sound and JS for Jones Sound.
The northem part of the Baffin Bay can pro vide important paleoclimate data due
to the meeting of the West Greenland
CUITent (WGC) and polar waters from
the Arctic Ocean (Knudsen et al., 2008;
Tang et al., 2004). In addition, the
northem part of Baffin Bay hosts the
largest Canadian Arctic polynya. This
80,000 k:m2 open water area is a result
of the wind-driven upwelling of a
warmer water layer: the Baffin Bay
EllllJ Depth >400 m
E2.i1 Depth <400 m
Figure 2. The continental shelf offshore Disko Bugt and the sampling location of core 70. From Weidick and Bennike (2007). The black arrows indicates the melt flow direction.
Atlantic intennediate water (Knudsen et al., 2008; Aksu, 1981). This polynya was
established in the Early Holocene, ~9400 a cal BP (i.e., 9000 14C a BP, Levac et al., 2001). It is the most productive marine area north of the Arctic Circle (Barber et al., 2001). The
l3
circulation inside the polynya is controlled by both the WGC and the Arctic Polar waters in a counter clockwise gyre (Melling et al., 2001).
Disko Bugt is a large marine embayment, having a surface area of approximately 40,000 km2 (Kelly and Lowell, 2009). The sampling site of core 70 (this study) is located northwest of Outer Egedesminde Dyb (valley) in a zone of intense iceberg scouring during the last glaciation (Weidick and Bennike, 2007) (Fig. 2). The sampling site was free of ice during the Last Glacial Maximum (LGM), which is very rare in the Holocene records for the region (Weidick and Bennike, 2007). Because it was unglaciated, it offers avantage point for observing changes in sedimentation due to icebergs and the WGc.
Knudsen et al. (2008) described two cores (cores 008P and 012P), which are located very close to cores 38 and 34. The current at the site of core 38 is mostly controlled by Arctic Polar waters from Smith Sound (Tang et al., 2004; Melling et al., 2001), while circulation at the sampling site of core 34 is dominated by the WGC and a counter-current from Hvalsund Fjord (Knudsen et al., 2008; Melling et al., 2001).
The different intervals observed by Knudsen et al. (2008) in cores 008P and 012P allowed the depiction and dating of the different steps of deglaciation in northem Baffin Bay. Their
interpretations are based on sediment facies, foraminifera, diatoms and stable isotope
analysis. They have established seven distinct time intervals for core 008P and eight for
core 0 12P. Moreover, J ennings et al. (2011) established the onset of the opening of N ares
Strait at ~9000 a cal BP.
In the Disko Bugt area, studies by Hogan et al. (2011), Kelly and Lowell (2009), Weidick
and Bennike (2007), Lloyd et al. (2005; 2007), and Johnsen et al. (2001) have identified
several Holocene climatic events and in sorne cases, their sedimentary signatures. The sediment facies observed in the present study will be related to sorne of these events.
.
The Holocene in Baffin Bay
Deglaciation started at 15000 a cal BP in the Baffin Island area. Sorne readvances of the Laurentian Ice Sheet (LIS) and local glaciers have been dated to 9900-9500 a cal BP (Miller et al., 2005). In Smith Sound, sediment signatures of the last deglaciation and extensive sea-ice coyer have been observed until 10900 a cal BP by Knudsen et al. (2008) and 10500 a cal BP (9300 14C a BP) by Levac et al. (2001). After this period, planktonic productivity indicates an influence of the WGC in the region and warmer conditions (Knudsen et al., 2008; Levac et al., 2001).
At 9000 a cal BP, a major oceanographic event has occuITed: the opening of Nares Strait, a pathway for Arctic waters entering Baffin Bay (Jenning et al., 2011). After that, the presence of Arctic Polar waters has been observed in the microfossil flora assemblages in the area (Knudsen et al., 2008).
For the Disko Bugt region, the Jakobshavn Isbrae icestream position was near the basaIt escarpment bordering the Inner Egedesminde Dyb (valley) until11700 a cal BP (see Fig. 2; Weidick and Bennike, 2007). The presence of the WGC in the bay has been recorded starting at 10200 a cal BP (Lloyd et al., 2005; Weidick and Bennike, 2007). The ice margin retreated to the eastern part of the bay, just west of the Jakobshavn fjord, until 9200 a cal BP. This new position of the n:eltwater and sediment source led to an increase in the influence of the WGC, particularly offshore. However, until 7800 a cal BP, the meItwater from Jakobshavn Isbrae, despite its retreat, deflected the warm CUITent in the bay. Since then, the WGC has penetrated the bay, reflected by the presence of Atlantic waters microfauna (Lloyd et al., 2005). According to Weidick and Bennike (2007), the western part of Egedesminde Dyb was unglaciated during the LGM.
During the Holocene, six global cold events (8200,6300,4700, 2700, 1550 and 550 a cal BP) have been triggered by different processes and recorded in lake/sea sediments, ice cores, speleothems, tree rings, peat bog sediments and fossil pollen records. Their structure and origin are weIl described in Wanner et al. (2011). Their influence, however, is not
15
recorded consistently on a regional scale, and often only local effects are observed. For
example, except at a few sites from lakes in Baffin Island and the central Arctic (Miller et
al., 2005; Seppa et al., 2003), there is no evidence from marine records of the 8200 a cal
BP event in the High Arctic (Miller et al., 2005).
Another important climatic event is the Holocene Thermal Maximum, which is a period of
warrn temperatures that have occurred around 6000 a cal BP in the northern Baffin Bay
region (de Vernal and Rochon, 2011). Paleoceanographical reconstructions from dinocyst assemblages indicate that the sea-surface temperatures were 3°C higher than today (de Vernal and Rochon, 2011).
Sediment
facies in Baffin Bay
Sediment deposits in high-latitude continental shelves are records of environrnental changes re1ated to the presence and proximity of ice (Hogan et al., 2012). Dowdeswell et al. (1998) have presented a review of glacimarine sedimentary processes and facies for the
Polar Atlantic region. The first facies associated with the last glaciation is a compact
diamicton interpreted as subglacial till. In sorne of the cores analyzed, this is overlaid by a
fine-grained litho facies with varying degrees of laminations. It is interpreted as a
deglaciation signal (Dowdeswell et al., 1998). In others cores, the transition between
diamicton and me1twater deposits comprises either pebbly diamictons interbedded with
grey mud, or dropstones in soft grey muds. Then, a change from these laminated lithofacies
to massive mud deposits represents the progression from ice proximal to ice distal
conditions. As the ice retreated, the sediment flux decreased. Finally, fine hemipelagic
sediments including possible !RD can be observed, indicating a period of no further
Material and methods
Co ring sites and eore handling
During the HU2008-029 oceanographic campaign in Baffin Bay, four piston cores (cores 034,038,042 and 070PC), their companion trigger weight cores (TWC) and associated box cores (BC) were collected on board the CCGS Hudson in 2008 (Fig. 1 and Table 1). Cores 034 and 038 were collected at water depths of 696 and 680 meters in the northem Baffin Bay polynya (Smith Sound). Core 042 was sampled at 580 meters in Jones Sound, whereas core 070 was raised offshore from Disko Bugt at a water depth of 444 meters (Fig. 1 and Table 1). The co ring sites were determined using a Knudsen 3.5 kHz chirp sub-bottom profiler to identify areas with thick apparent Holocene sequences with the absence of mass movements and/or sediment perturbations. Composite depths have been established (see the core top correlation section) and the composite cores are named cores 34, 38, 42 and 70. Once on board, the cores were cut into 1.5-m long sections and split lengthwise. They were then photographed at 500 dpi with a high-resolution Smart cube SmartCIS core scanner, then described and sampled with u-channels, rigid u-shaped plastic liners of 1.5 m length and 2 x 2 cm cross section. Trigger weight core HU2008-029-040 has no associated u-channel because the sediment was too watery for sampling. All cores were stored in a cold room at 4°C.
W
e
t bulk density and low-field volumetrie magnetie suseeptibility
Wet bulk density and low-field volumetric magnetic susceptibility (kLF) were first measured on board on whole cores using a GEOTEK Multi Sensor Core Logger (MSCL) at
17
Table 1. Coordinates and properties of the sampling sites.
Water Composite
Cores Latitude Longitude Location depth Lenght corrected
lenght
~
°w
m cm cm34 76.32905 71.418998 North water polynia 696 710 742
38 76.57349 73.955535 North water polynia 680 846 863
42 75.57939 78.629571 Sound Jones 580 1059 1112
70 68.22788 57.61746 Off Disko Bugt 444 250 431
1 cm and 0.5 cm intervals respectively for the piston cores and their companion trigger weight and box cores. kLF was also measured on u-channels in the laboratory at 1 cm
intervals using a point sensor. kLF is an indicator of the concentration of ferrimagnetic
material and is sensitive to variations in grain size (e.g., Stoner et al., 1996; Thompson and Oldfield, 1986; Dearing et al., 1999).
Diffuse
spectral
reflectance
Diffuse spectral reflectance was measured on board usmg a Minolta CM-2600d spectrophotometer at 0.5 cm intervals for the box and trigger weight cores and at 1 cm intervals for the piston cores. The spectral reflectance data are expressed in the CIE (International Commission on Illumination) L *, a*, b* color space which is often used in paleoceanography. L * ranges from black to white, a* from green to red and b* from blue to yellow (e.g., St-Onge et al., 2007).
Grain size
Grain size measurements (0.04 to 2000 /!m) were performed at 10 cm intervals in each core with a Beckman-Coulter LS 13320 laser diffraction particle size analyzer at ISMER. The top and bottom of each core sections were also measured. Prior to the measurements, sediments were added to a Calgon electrolytic solution (sodium hexametaphosphate) and rotated for about 3 hours using an in-house rotator. The samples were then sieved (2 mm) and disaggregated in an ultrasonic bath for 90 s before their analysis. The particle size distribution output was then processed using the Gradistat software for sediment parameters (Blott and Pye, 2001).
CA
T-
s
can
AlI core sections were passed through a computerized axial tomography-Scan (CAT -Scan) at INRS-ETE in Quebec City in order to characterize the sedimentary facies and sediment structures. It was notably used to determine the different sediment units, as weIl as to
identify sediment deformation and shells for radio carbon dating (see below).
Pa
l
eo
m
ag
n
e
tic anal
y
si
s
AlI measurements were made at the Sedimentary Paleomagnetism and Marine Geology Laboratory of ISMER. Paleomagnetic data were measured on the u-channels at 1 cm intervals using a 2G Enterprises SRM-755 u-channel cryogenic magnetometer and pulse magnetizer module for Isothermal Remanent (IRM) and Saturated Isothermal Magnetizations (SIRM). Because of the response function of the magnetometer (e.g., Roberts, 2006; Weeks et al., 1993) smoothing occurs due to the integration of empty space at the end and beginning of u-channe1s. The first and the last 4 cm of each section were thus excluded.
The natural remanent magnetization (NRM) was measured and then progressively demagnetized using stepwise peak altemating fields (AF) up to 80 mT at 5 mT increments. Declination and inclination of the characteristic remanent magnetization were ca1culated by
19
a least-square line-fitting procedure (Kirschvink, 1980) using the Mazaud (2005) software with AF demagnetization steps from 20 to 50 mT. Because the cores were not azimuthally oriented, the declination profiles are relative.
An anhysteretic remanent magnetization (ARM) was then induced using a 100 mT AF field with a 0.05 mT direct CUITent (DC) biasing field. The ARM was measured and demagnetized up to 60 mT at 5 mT increments and then at 70, 80, 90 and 100 mT. Two isothermal remanent magnetizations were imparted with a DC field of 0.3 T (IRM 0.3 T) and 0.95 T (SIRM) with the pulse magnetizer module. Each IRM was demagnetized and measured at peak AF at 5 mT steps up to 60 mT, and also at 70, 80, 90 and 100 mT. SIRM was demagnetized and measured at 0,10,30,50, 70, 90 and 120 mT.
Aiso presented in this paper are the Maximum Angular Deviation (MAD) values and the Median Destructive Field (MDFNRM) of the NRM. MAD values under 5° are associated with very high-quality marine data (e.g., Stoner and St-Onge, 2007). The MDFNRM, which
is the value of the AF necessary to reduce the NRM intensity to half of its initial value, was
also calculated with the Mazaud software. MDF values are dependent of the coercivity of
magnetic mineraIs and magnetic grain size, and are a useful parameter in estimating magnetic mineralogy (e.g., Dankers, 1981). Also, the ARM20mT/ ARMomT ratio is a
coercivity ratio that reflects variations in magnetic grain size if the mineralogy is dominated by low coercivity minreals such as magnetite (e.g., Andrews et al., 2003).
Hysteresis measurements were performed on selected sediment samples in each core using
a Princeton Measurement Corporation Micromag 2900 altemating gradient force magnetometer. Extracted from the hysteresis curves, the coercivity of magnetic mineraIs
(Hc), the coercivity of remanence (Hcr), the saturation magnetization (Ms) and the
saturation remanence (Mrs) were used to characterize the magnetic mineralogy and grain size (Day et al., 1977).
Radiocarbon dating
The chronologies of the composite sequences of cores 34, 38, and 42 were determined using accelerator mass spectrometry (AMS) 14C measurements at the Keck carbon cycle AMS facility, University of Califomia, Irvine, CA, USA. The measurements on boxcore 40, which is associated to core 42, were made at the Lawrence Livermore National Laboratory, Livermore, CA, USA. Radiocarbon measurements for core 70 samples were made at the NSF-Arizona AMS Facility and the Scottish Universities Environmental Research Centre in the UK (Jennings et al., this issue). Detailed data are presented in Table 2. The reported ages are in radio carbon years using Libby's half-life of 5568 years and following the convention of Stuiver and Polach (1977). Conversion of conventional 14C ages to calibrated years was made using the CALIB 6.0 online calibration software (Stuiver
et al., 2005) and the Hughen et al. (2004) marine dataset. The regional reservoir corrections used are indicated by a delta R in Table 1 and based on the online CALIB marine reservoir correction database. The calibrated ages are the median probability reported with a 1 cr confidence level.
Core top correlation
Correlations between the piston cores and their associated trigger weight and box cores were conducted with the physical and magnetic properties in order to determine the sediment lost during piston coring (Fig. 3). Composite depths were then constructed for each site using the determined sediment lost. Diffuse spectral reflectance (a*) and magnetic susceptibility were used to compare 32BC, 34TWC and 34PC.The correlation indicates a gap of 2 cm between the BC and TWC, and 34 cm between the TWC and PC. For core 42, a* values indicate that there were 57 cm ofmissing sediments on the top of the piston core. There is only a 4 cm gap between the BC and TWC of core 38, as shown by the inclination and hF data, whereas comparison of the a* and kLF data between the TWC and PC indicates a difference of 19 cm. Inclination and declination data and L * values were used to compare the BC, TWC and PC of core 70. There are 15 cm of missing sediment at the top.
21 N ...
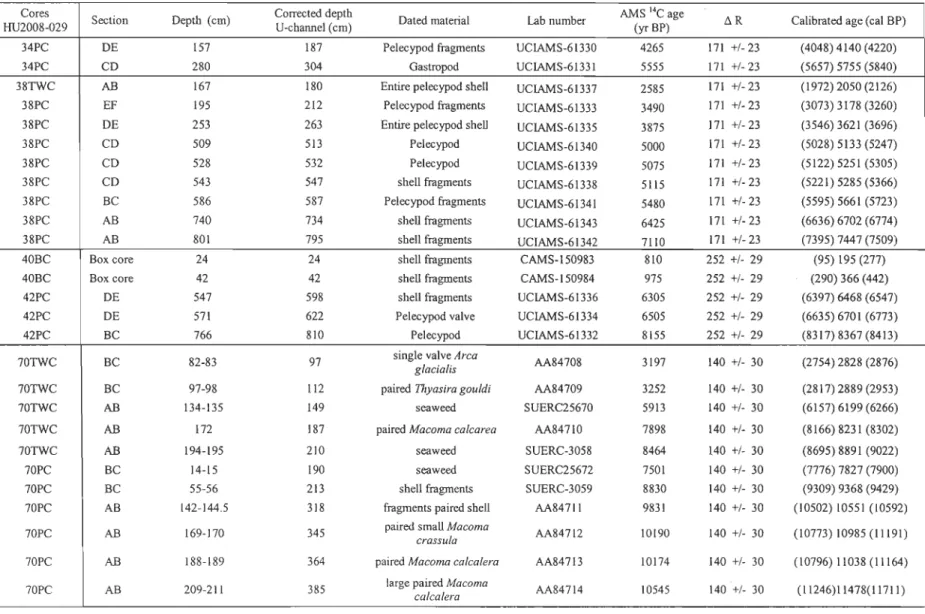
Table 2. Radiocarbon dates. The numbers in parentheses represent the lower and the upper lirnits of a one sigma error range. Except for ages 8891 cal BP, 11038 cal BP and 11478 cal BP, of core 70, which have a error range oftwo sigma.
Cores Section Depth (cm) Corrected depth Dated material Lab number AMS 14Cage l1R Calibrated age (cal BP)
HU2008-029 U·channel (cm) (yr BP)
34PC DE 157 187 Pelecypod fragments UCIAMS·61330 4265 171 +1·23 (4048) 4140 (4220)
34PC CD 280 304 Gastropod UCIAMS·61331 5555 171 +/·23 (5657) 5755 (5840)
38TWC AB 167 180 Entire pe\ecypod shell UCIAMS·61337 2585 171 +1·23 (1972) 2050 (2126)
38PC EF 195 212 Pelecypod fragments UCIAMS·61333 3490 171 +1· 23 (3073) 3178 (3260)
38PC DE 253 263 Entire pelecypod shell UCIAMS·61335 3875 171 +1· 23 (3546) 3621 (3696)
38PC CD 509 513 Pelecypod UCIAMS·61340 5000 171 +1·23 (5028) 5133 (5247)
38PC CD 528 532 Pelecypod UCIAMS·61339 5075 171 +1· 23 (5122) 5251 (5305)
38PC CD 543 547 shell fragments UCIAMS·61338 5115 171 +1· 23 (5221) 5285 (5366)
38PC BC 586 587 Pelecypod fragments UCIAMS·61341 5480 171 +1·23 (5595) 5661 (5723)
38PC AB 740 734 shell fragments UCIAMS·61343 6425 171 +/·23 (6636) 6702 (6774)
38PC AB 801 795 shen fragments UCIAMS·61342 7110 171 +1·23 (7395) 7447 (7509) 40BC Box core 24 24 shen fragments CAMS· 150983 810 252 +1· 29 (95) 195 (277) 40BC Box core 42 42 shen fragments CAMS· 150984 975 252 +1· 29 (290) 366 (442) 42PC DE 547 598 shen fragments UCIAMS·61336 6305 252 +/. 29 (6397) 6468 (6547) 42PC DE 571 622 Pe1ecypod valve UCIAMS·61334 6505 252 +1· 29 (6635) 6701 (6773) 42PC BC 766 810 Pe1ecypod UCIAMS·61332 8155 252 +1· 29 (8317) 8367 (8413) 70TWC BC 82·83 97 single valve glacialis Arca AA84708 3197 140 +1· 30 (2754) 2828 (2876) 70TWC BC 97·98 112 paired Thyasira gouldi AA84709 3252 140 +1· 30 (2817) 2889 (2953) 70TWC AB 134·135 149 seaweed SUERC25670 5913 140 +1· 30 (6157) 6199 (6266) 70TWC AB 172 187 paired Macoma calcarea AA84710 7898 140 +1· 30 (8166) 8231 (8302)
70TWC AB 194·195 210 seaweed SUERC·3058 8464 140 +1· 30 (8695) 8891 (9022)
70PC BC 14·15 190 seaweed SUERC25672 7501 140 +1· 30 (7776) 7827 (7900) 70PC BC 55·56 213 shen fragments SUERC·3059 8830 140 +/. 30 (9309) 9368 (9429)
70PC AB 142·144.5 318 fragments paired shell AA847 Il 9831 140 +1· 30 (10502) 10551 (10592)
70PC AB 169·170 345 paired small Macoma crassula AA84712 10190 140 +/. 30 (10773) 10985 (11191)
70PC AB 188·189 364 paired Macoma calcalera AA84713 10174 140 +1· 30 (10796) 11038 (11164)
The tirst 161 cm are from the TWC and the rest is from the PC. Comparison of foraminifera assemblages yielded similar results for this core (J ennings et al., this issue; Jennings and Walton, 2010).
A 100 . 032BC 1 density (g/cm) • 'j " i .• J j" l.ï·ï.2·I.J ï·'4Ù 034TWC 034TWC 1 a* density (g/cm ) 034TWC a* k034TWC '.f (xlO'Sl) o·~ ·1 q 15 .20. 25 J~ 35 ~o
j
', 6~
]'
20
.
34 f iJ
i,
~
,
[
~
_
f'
·2 ·1 0 1 2 15 20 25 30 35 40c
200· 800· 1000 ., 034PC 034PÇ a* klJ' (x 1 O' SI) 040BC a* -1 ... :~:.~ ... y... 0.5 BC TWC/::' 9cm PC /::,48cm ,..._ ... __ .. _._--...,...--_ ... ---_.,---_.--. ·15 ·1 ·0.5 0 0.5 1 042PC a* B 036BC 036BÇInclination (0) ku' (x 1 O' SI)
H~
è
39~
~4
:
~
6r!~~
o
soi ----., o 100 jo "-;---90 s-'lii'ï,ï'îï40 o 038TWC Inclination ( 0) 038TW,f k'J' (x 1 0 SI) 70TWC Dec1ination (Ol 70TWC 70TWC Incl ination (0 ~ L*!
:;5 .• 6.5 ... 75 ... ~. :~3L2 34 36,3.84042 oC ~ ë,.120 i G) ~ 0 160' 200-'~
"'-~f
55 60 6~ 70 7~ 80 85 90 070PC Inclination (0) J O J : S : 2 070PC L*Figure l, Core top correlation for cores (A) 32BC, 34TWC and 34PC, (B) 40BC and 42PC, (C) 36BC, 38TWC and 38PC and (D) 68BC, 70TWC and 70PC, Open delta symbol represents the difference between
23
Results
Lithostratigraphy, physical and magnetic properties
Core 34The physical and magnetic properties of core 34 allowed the identification of two distinct
lithostratigraphic units (Fig. 4a). Unit 1, from 715 cm to 560 cm, is composed of a
sequence characterized by two layers of reddish-brown sandy mud with pebbles and grave!.
The coarser material present in both layers is reflected by higher values in density and
magnetic susceptibility, and is visible on the CA T -scan images. Two peaks of magnetic
susceptibility, with values reaching 200 x 10-5 SI, are observed and represent two distinct sub-units: 1 a) and 1 b). The first magnetic susceptibility peak in sub-unit 1 a, around 615 cm,
is coeval with the sparse accumulation of pebbles. The second sub-unit (sub-unit lb: 715 -640 cm) is a dense and compact reddish layer with laminations, sand, gravel and pebbles. This sub-unit is highlighted by a peak in L * and a* values. It is also marked by very low
inclinations, sometimes even negative values (Fig. 5a). These 10w values in conjunction
with the presence of COarse material and laminations indicate that this unit may be
reflecting a rapidly deposited layer (e.g., St-Onge et al., 2004; 2012).
Unit 2, from 560 cm to the top of the core, is composed of olive-grey (5Y412) and dark
olive-grey (5Y3/2) silty clays. This unit is divided in four sub-units based on the presence of shell fragments and traces of bioturbation in sub-units a) and c). The density, magnetic susceptibility and magnetic remanence (NRM, ARM and IRM) profiles are re1atively
constant, but slightly increase to the bottom of the unit. On the other hand, an increase in
MDF and ARM20mT/ ARMomT is observed from 110 cm to the top of the unit, indicating the
presence of sediment with a higher coercivity and/or a decrease in magnetite grain size (e.g., Stoner and St-Onge, 2007; Andrews et al., 2003), as no significant change in
5). Furthennore, L
*
values, which are relatively constant in the entire unit, show a decrease starting around 60 cm to the top of the core.Core 38
Core 38 is composed of olive-grey (5Y412) and dark olive-grey (5Y3/2) siltly clays (Fig.
4b). Except for two peaks at 483 cm and 110 cm, MDF values are low (mean of 4.62 mT) and constant, suggesting a unifonn mineralogy with a combination of low coercivity and coarse magnetic grains. Based principally on the presence of shell fragments and traces of bioturbation, density, magnetic susceptibility and the magnetic properties (NRM, ARM and
IRM), two main lithostratigraphic units were observed.
The first unit of core 38, from 860 cm to 505 cm, is characterized by an increase in magnetic susceptibility and density. This unit is also characterized by the presence of
numerous shell fragments and traces ofbioturbation (see background dataset). It should be
highlighted that all the properties of this unit are constrained in the same range of values as .
sub-units 2a, 2b and 2c of core 34, possibly indicating a similar source and mode of deposition.
The second unit, from 505 cm to top of the unit, is characterized by very constant
parameters. There are no significant traces of bioturbation or color changes. Sub-units a)
and c) are very similar. Sub-unit 2b) contains sorne pebbles and shell fragments, as seen on
CAT-scan images (see background dataset). Higher values ofmagnetic susceptibility, from
280 cm to 180 cm, are apparent and reach a maximum of 52 x 10-5 SI. Elevated values in
the NRM, IRM and ARM profiles are also coeval with increased values of magnetic
susceptibility, indicating a higher concentration of ferrimagnetic mineraIs. The lower values
of ARM20mT/ARMomT in this interval indicate coarser magnetic grain size (e.g., Stoner and
St-Onge, 2007; Andrews et al., 2003) as no significant change in magnetic mineraI ogy can
A) a* (smooth) Green'"'-""Red i i 1 ARM(Nm) i i 1 32 36 40 o 0.02 0.04 b '1 ~ j 25
Cat-scan Mean gram
3 (;
.
9
size {Uin) 1'7 Black White NRM (A/m) IRM (Nm) o MD10 F(20 30 mT)B) -:::'300 .Q, 00-", MO. cu" .... '0 0'0 u t; ~ 15 u 600 900 Cat-scan Density (g/cm ') 1 i 1 i i 6 9 12 15 Mean grain size (um) "' ... ~ 1* (smooth) a* (smooth) Gree;···_·· .... ·1 1 i i i 30 33 36 Black ..........Whit.. e L* (smooth) i 1 i i 1 o 0.005 0.01 NRM (Nm) o IRM(Nm) 0.5. ARM 20mTI ARMOmT 0,.8 ! b 1'0 10 MDF(mT)
C) 200 1000 Density (g/cm ') 1.4 1.6 1.8 2 ku.(x JO ,sSI) o 100 200 t 1 1 a*'(smooth) Greêt:'.·--.--Red.· -,1 VIt 27 30 33 o 0.02 Cat-scan Me3 6 9 12 1an grain size (um) 5 Black White NRM (A/m)
o Dl 100 400 Cat-scan Density (g/cm ') 1.4 1.8 2.2 i 1 I i i 4 8 12 16 20 Mean grain size (um) « ... _ ...... L* (smooth) i i i 1 i i 1 i 32 34 36 38 40 o 0.05 0.1
Black White NRM (Alm)
..... _-,.. 1* (smooth) ARM 2OmT1 ARMOmT 0,5 0,6 o 0.5 1 1.5 2 IRM (Alm) o MDF(mT) 20' 40 ARM 20'nTi ARMOmT i i 1 1 0 2 4 6 o 5 JO IRM (Alm) MDF (mT)
Figure 2. Downcore physical and magne tic properties with CT-Scan images for core A) 34, B) 38, C) 42
27
Core 42
In core 42, two lithostratigraphic units were defined according to density, magnetic
susceptibility, color changes and the magnetic properties (NRM, ARM and IRM) (Fig. 4c).
Most of the core is composed of olive-grey (5Y4/2) and dark olive-grey (5Y3/2) siltly clays
with a graduaI color change to very dark brown (10YR2/2) starting at 980 cm.
Unit 1 is observed from 1087 cm to 835 cm. It is defined by a significant color change from
the base to the top of the unit, passing from a* values of +2 to -1. Magnetic susceptibility,
NRM, ARM and IRM profiles indicate that deposition seems to have occurred in several steps. Peaks observed only in magnetic susceptibility data at 1080, 1000 and 845 cm, are associated with large pebbles that were not sampled in u-channels, but measured on the whole core analysis. High values in magnetic susceptibility, NRM, ARM and IRM between
950 and 880 cm are related to small pebbles present in the u-channels.
The unit has been divided in two sub-units. Sub-unit 1 a), from 1087 to 1068 cm, is composed of compact clay with large pebbles. Sub-unit lb), from 1068 to 835 cm, is characterized by the presence of numerous pebbles in a very dark brown silty clay with layers of sandy mud. There are a few intervals with laminations and normal grading that we interpret as turbidites. For a detailed view of this facies, please refer to the CAT-scan images in the background dataset.
Unit 2 of core 42, from 835 cm to the top of the core, is composed of very homogeneous and strongly bioturbated olive-grey (5Y4/2) and dark olive-grey (5Y3/2) silty clays. Shell fragments are present at the top of the core at 110 cm and 80 cm. The
sub-units were determined using major changes in the MDF profile. Higher MDF values
suggest that magnetic grains have a higher coercivity and/or a finer magnetic grain size if the mineralogy is constant. Sub-unit a) has higher MDF values than sub-unit b), with a decrease starting at 480 cm. Sub-unit c), from 105 to 63 cm, is characterized by relatively higher MDF values. The density and magnetic susceptibility values are very similar to the ones observed in unit 2 of core 34 and unit 1 of core 38.
Core 70
Three units were detined in core 70 based on the density and the magnetic properties (NRM, ARM, IRM, ARM20mT/ARMOmT and MDF) (Fig. 4d). The tirst unit, from 417 cm to
375 cm, is composed of very dark gray (5Y 3/1) sands and the presence of numerous pebbles and sheU fragments. It is associated with a peak of density, mean grain size, and
magnetic susceptibility. Similarly, very low MDF and ARM20mT/ ARMOmT values most likely suggest a coarser magnetic grain size (e.g., Stoner and St-Onge, 2007; Andrews et
al., 2003), as the Day plot reveals a multi-domain magnetic grain size (Fig. 5d).
Unit 2 is observed from 375 cm to 175 cm. It is characterized by olive (5Y 4/3) and
dark olive gray (5Y 3/2) siltly clays and by relatively higher magnetic property values
(NRM, ARM, IRM, ARM20mT/ARMomT and MDF). Magnetic susceptibility reaches values around 200 x 10-5 SI in this unit, with a decrease at the top of the unit. Sub-unit 2b) is a
transitional unit to unit 3. In sub-unit 2b, there are sorne traces of bioturbation. Toward its
top, at 182 cm, there are a few laminations, whereas at the bottom of sub-unit 2a, a few pebbles are observed.
Unit 3 is a homogeneous olive-gray (5Y412) siltly clay unit with a few traces of bioturbation. AU the parameters have lower values than in the rest of the core. However, the magnetic susceptibility values from this unit, ranging from 58 to 140 xl 0-5 SI, are higher
than in the other cores. From 70 to 60 cm, an interval of higher density is observed on the
CA T -scan image. This interval is also characterized by normal grading and an increase in magnetic susceptibility values (max: 140 xl0-5 SI). We interpret this layer as a turbidite.
Then, from 45 cm to the top of the core, an increase in a*, L* and ARM20mT/ARMomT is observed.